In this article, we have explained the various Artificial Intelligence based visuals in Power BI. Using these visuals you can make your Power BI dashboard more powerful.
What is an Artificial Intelligence?
Artificial intelligence (AI) makes it possible for machines to learn from experience, adjust to new inputs and perform human-like tasks
Below are the AI based visual available in Power BI-
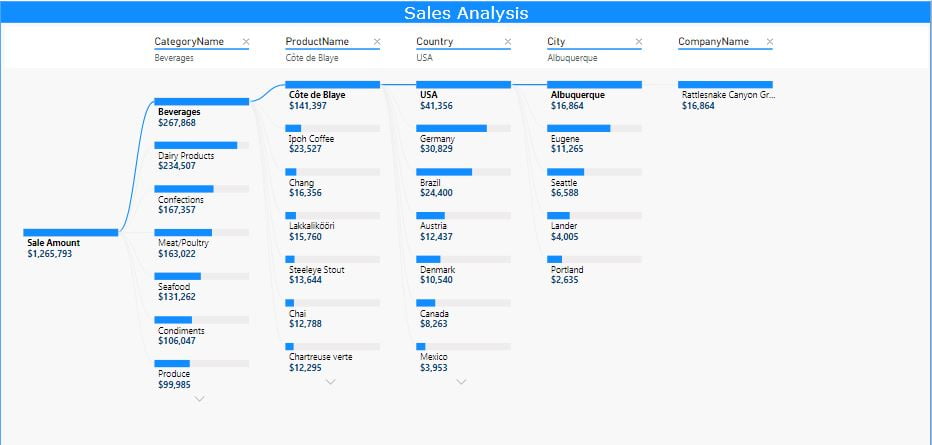
Decomposition Tree:
Decomposition Tree is an AI based visual available in Power BI. It lets you visualize data across multiple dimensions. It automatically aggregates data and enables drilling down into your dimensions in any order. It is also an artificial intelligence (AI) visualization, so you can ask it to find the next dimension to drill down into based on certain criteria. This makes it a valuable tool for ad hoc exploration and conducting root cause analysis. For example, when drilling into the tree, you can choose “High value” or “Low value”. Selecting one of these tells the visual to perform an “AI split”, which will then identify the next field to drill into and display the highest or lowest value, respectively. The Decomposition Tree is currently in public preview, so we can expect many enhancements in the coming months.
To enable the Decomposition Tree in Power BI Desktop go to the-
File >> Option and Settings >>Options>> Preview Features>> Check the Decomposition Tree Visual
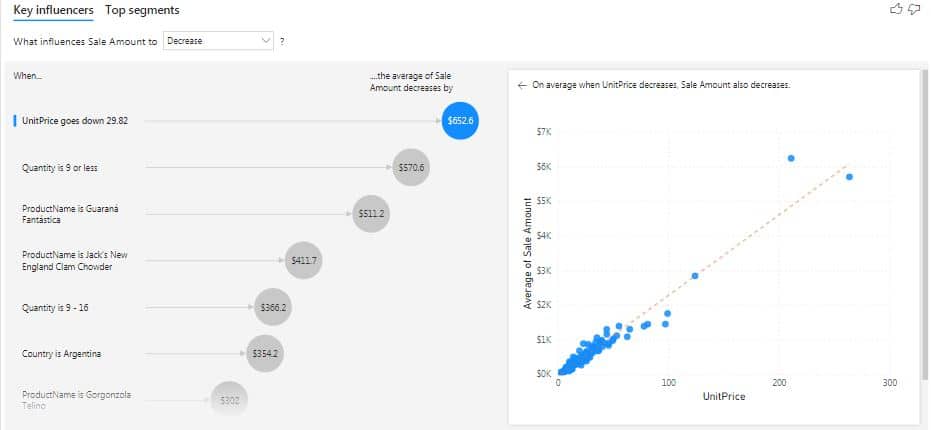
Key Influencers:
The key influencers visual helps you understand the factors that drive a metric you’re interested in. It analyzes your data, ranks the factors that matter, and displays them as key influencers. For example – suppose you want to figure out what influences Sales amount. Factors might be quantity sold, Discount, unit price etc.
When to use key influencers?
The key influencers visual is a great choice if you want to:
- See which factors affect the metric being analyzed.
- Contrast the relative importance of these factors
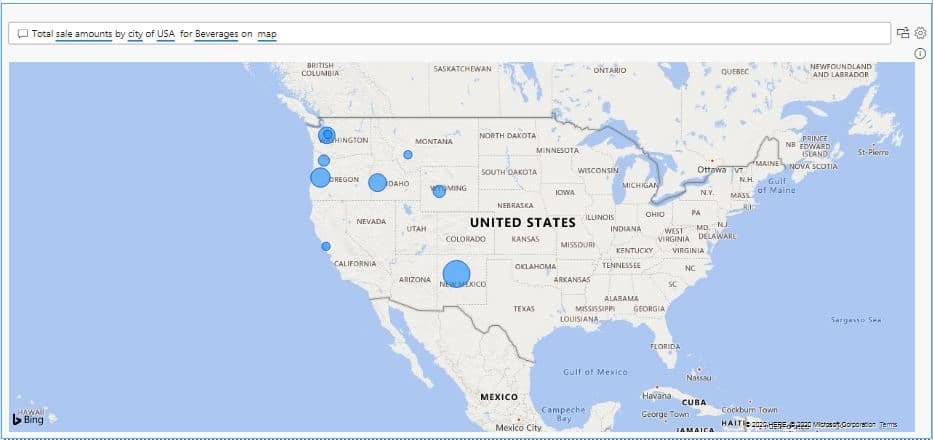
Q&A:
The Q&A visual can be both used as a tool to allow consumers to quickly get answers to their data, and by designers to create visuals in report by simply double-clicking anywhere on a report and using natural language to get started. As it behaves like any other visual, the Q&A visual can be cross-filtered/cross-highlighted and also supports bookmarks. The Q&A visual also supports themes and other default formatting options available inside Power BI.
The Q&A visual consists of four core components;
- The question box: This is where users type in their question and are shown suggestions to help them complete their question.
- A pre-populated list of suggested questions.
- Icon to convert the Q&A visual into a standard visual.
- Icon to open Q&A tooling which allows designers to configure the underlying natural language engine.
Insights:
The last feature of data visualizations we’ll mention is “Insights” which allows AI-powered analysis within traditional visuals like line chart. we’re all already familiar with.
Explain the Increase/Decrease:
This feature can be used to have Power BI identify and explain the increase or decrease between two data points. For example, perhaps you see a large decrease in sales between two months. Rather than performing a manual analysis to explain the decrease in sales, Power BI can perform that analysis for you!
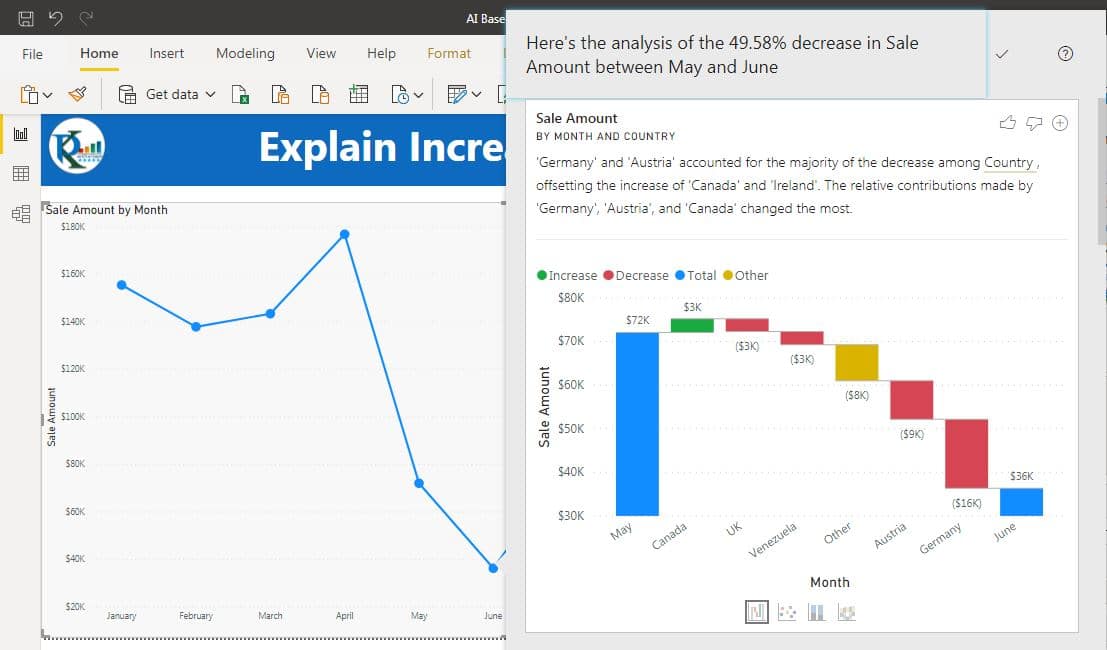
In the below line chart we are seeing a decrease in sales in Jun Month. Just Right click on Jun >> Analyze>> Explain the decrease
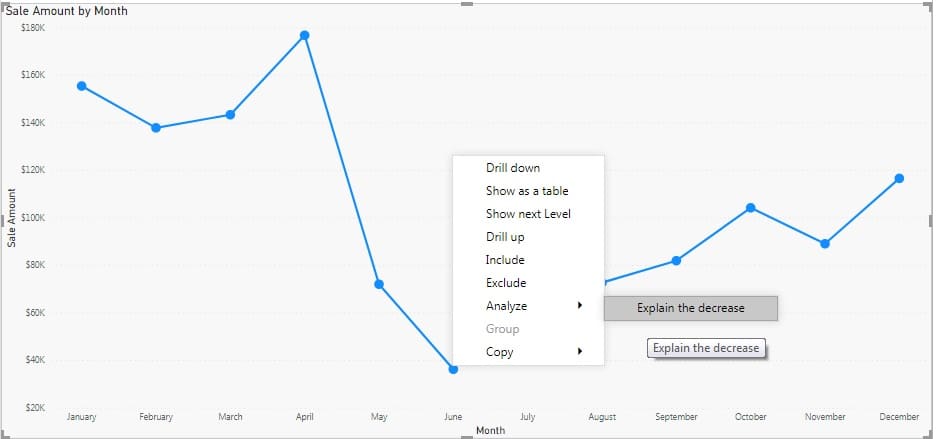
It will run the AI algorithm and will give the Insights
Watch the step by step video tutorial:
Click here to download Power BI file.
Visit our YouTube channel to learn step-by-step video tutorials