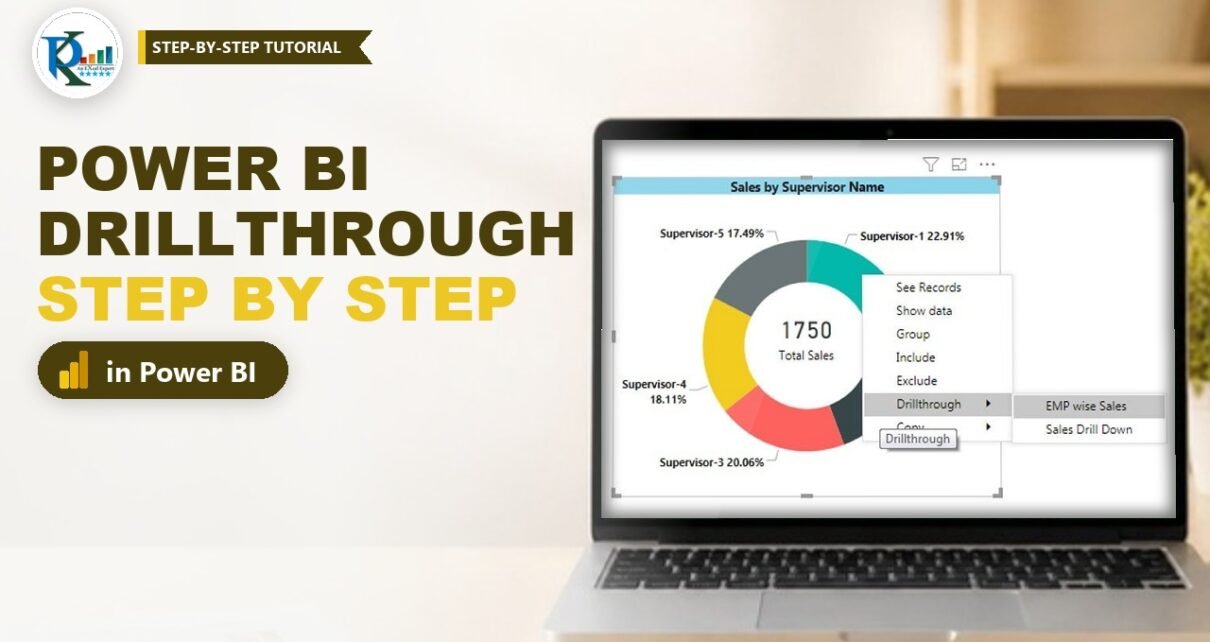
Power BI drillthrough lets your reader right-click a data point on a summary visual and jump to a detail page that is already filtered to that one item. In this tutorial you set up drillthrough on a supervisor sales report: a doughnut chart shows Total Sales by supervisor, and two detail pages, EMP wise Sales and Sales Drill Down, open filtered to the supervisor you clicked. You will also learn what Keep all filters does, how the automatic back button works, how to trigger drillthrough from a button, and how to fix the usual “the option is greyed out” problems. Everything here works in the current Power BI Desktop and in the Power BI service.

⬇️ Download the Free Practice File
Drillthrough in Power BI.pbix · .zip · Power BI Desktop (free)
Watch the Video Tutorial
The video builds the same report from the practice file: the supervisor doughnut chart, the two detail pages and the Supervisor Name drillthrough field, then right-clicks a slice to show the filtered detail.
What You Will Build
- A summary page with a “Sales by Supervisor Name” doughnut chart (Total Sales 1,750 in the practice file).
- Two drillthrough pages, EMP wise Sales and Sales Drill Down, that show only the selected supervisor’s employees and sales.
- A Drill through right-click menu that lists both pages on any visual that uses Supervisor Name.
- A back button that returns the reader to the page they came from.
- An optional drillthrough button, so readers who never right-click still find the detail.
The Practice File
The download contains one Power BI file, Drillthrough in Power BI.pbix, with a single table called Sales and three columns: EMP Name, Sales and Supervisor Name. Five supervisors (Supervisor-1 to Supervisor-5) each manage a group of employees. Open it in Power BI Desktop, which you can install free from the Microsoft Store.
How Power BI Drillthrough Works
Drillthrough has two sides. The target page (the detail page) declares which field it accepts, for example Supervisor Name. The source visual (any chart, table or card on another page) offers that page in its right-click menu whenever the visual uses the same field. When the reader drills through, Power BI opens the target page and applies the clicked value as a filter. That is the whole idea, so most problems come down to “the source visual doesn’t use the drillthrough field”.
Part 1 – Set Up the Drillthrough Page
Step 1: Add the detail pages
Click the + at the bottom of the report canvas to add a new page and rename it EMP wise Sales (double-click the tab). Add a second page called Sales Drill Down. Build whatever detail you want on them: for example a clustered bar chart of Sales by EMP Name on the first page and a table of EMP Name and Sales on the second.
Step 2: Add the field to the Drillthrough well
Stay on the detail page and click an empty part of the canvas so that no visual is selected. In the Visualizations pane, open Build visual and scroll down to the Drill through section. Drag Supervisor Name from the Data pane into Add drill-through fields here.
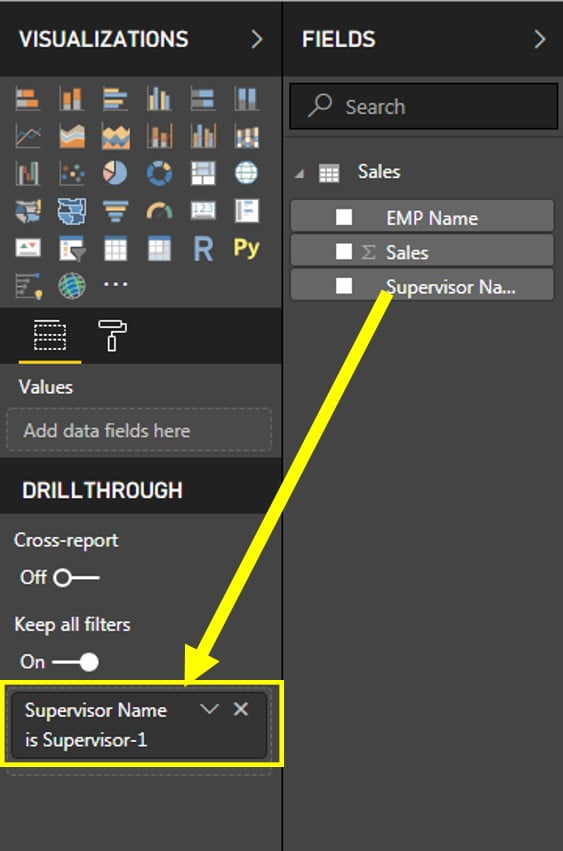
Two things happen as soon as you drop the field. Power BI adds a back button (a left-arrow image) to the top-left of the page, and the page is now a drillthrough target for every visual that uses Supervisor Name. Repeat the same step on the second detail page.
Step 3: Decide on “Keep all filters”
The Keep all filters switch sits just above the drillthrough field and is On by default.
- On: the detail page receives the clicked supervisor plus every other filter that was active on the source visual, such as slicers, page and report filters, and cross-highlighting. If the summary page is sliced to one region, the detail page shows that region too.
- Off: the detail page receives only the drillthrough field value. Use this when the detail page should always show the supervisor’s full picture, whatever the source page was filtered to.
Leave it on for most reports. Readers expect the detail page to match what they were looking at.
Step 4: Hide the detail pages (optional)
Readers should reach a drillthrough page through the drill, not by clicking its tab, because unfiltered it shows every supervisor. Right-click the page tab and choose Hide page. Hidden pages still work as drillthrough targets in Desktop and the service.
Part 2 – Drill Through From the Summary Page
Step 5: Right-click a data point
Go back to the summary page, right-click a slice of the doughnut chart, for example Supervisor-1 (22.91% of sales), and point to Drill through. Both EMP wise Sales and Sales Drill Down appear in the submenu. Click one and Power BI opens that page filtered to Supervisor-1.
To check the filter, hover over the funnel icon on any visual on the detail page, or look at the drillthrough well: it now reads Supervisor Name is Supervisor-1.
Step 6: Use the back button
Power BI added the back button automatically in Step 2. In Power BI Desktop, hold Ctrl and click it (buttons need Ctrl+click while you are editing). In the Power BI service and in reading view a normal click is enough. You can restyle it in the Format pane, or delete it and insert your own from Insert > Buttons > Back. The button’s action type is Back, which returns to the previous page.
Part 3 – Drillthrough Buttons
Many readers never right-click. A drillthrough button puts the same action in plain sight.
- On the summary page choose Insert > Buttons and pick a style, such as Blank.
- Select the button and open the Format pane. Turn on Action, set Type to Drill through and set Destination to EMP wise Sales.
- Give the button a text label, such as “See employee sales”.
The button is disabled until the reader selects a single supervisor in the doughnut chart, then it activates. Ctrl+click it in Desktop, or click it in the service. To make the disabled state friendly, set a Tooltip under Action with a message like “Select a supervisor first”. You can also make the destination dynamic by choosing Conditional formatting (fx) next to Destination and pointing it at a measure that returns a page name.
Part 4 – Cross-Report Drillthrough (Briefly)
Cross-report drillthrough jumps from a visual in one report to a drillthrough page in a different report in the same Power BI service workspace or app. Turn on the Cross-report switch on the target page (above Keep all filters), and on the source report go to File > Options and settings > Options > Current file > Report settings and allow visuals to use drillthrough targets from other reports. Both reports must be published to the service, and the field must have the same table and column names in both datasets. It works in the service only, not inside Desktop.
Common Problems and Fixes
The Drill through option is greyed out or missing
The source visual doesn’t use the drillthrough field. Add Supervisor Name to the visual (axis, legend or rows) and the page appears in the menu. Also check that you right-clicked a data point, not the visual’s blank background.
The drillthrough page shows more data than expected
Keep all filters is off, or the source visual had no filter on it. Turn Keep all filters on, and confirm in the drillthrough well that the page reads “Supervisor Name is …”.
The page doesn’t appear when the field is used as a value
Each field in the drillthrough well has a dropdown with Used as category (the default) and Summarized. Used as category only matches visuals that use the field as a category, such as an axis or legend. Switch to Summarized when you want to drill from visuals that use the field as an aggregated value. For a text column like Supervisor Name, keep Used as category.
The back button or drillthrough button does nothing
In Power BI Desktop you need Ctrl+click on buttons while editing. For a drillthrough button, a single data point must be selected first.
Tips
- Create the measure
Selected Supervisor = SELECTEDVALUE(Sales[Supervisor Name], "All supervisors")and show it in a card on the detail page, so readers always see which supervisor they drilled into. - Hide detail pages so they are only reached through a drill.
- You can add several fields to the drillthrough well. The source visual then needs all of them.
- Use the same detail page from many visuals: any visual with Supervisor Name will offer it.
- Microsoft’s drillthrough documentation on Microsoft Learn covers every option shown here.
Want It Ready-Made?
If you’d rather start from finished reports that already use drillthrough detail pages, tooltip pages and synced slicers, see the Power BI Dashboard Mega Collection (15 premium templates) on NextGenTemplates.com, or browse all Power BI templates.
Related Tutorials
- Power BI drillthrough: right click, buttons and tooltips
- Power BI tooltips: format and create report page tooltips
- Power BI dashboard design: make your report look like an app
- Dynamic conditional formatting in Power BI
Frequently Asked Questions
What is drillthrough in Power BI?
Drillthrough is a page-to-page filter. You right-click a data point on one page and open a detail page that is filtered to that value, for example one supervisor’s employees and sales.
What is the difference between drill down and drillthrough in Power BI?
Drill down moves through a hierarchy inside the same visual, such as Year to Month. Drillthrough opens a different report page filtered to the item you clicked.
Why is drillthrough greyed out in Power BI?
The visual you right-clicked doesn’t contain the field in the target page’s drillthrough well. Add that field to the visual, for example on its axis, legend or rows, and the option becomes available.
What does Keep all filters do in Power BI drillthrough?
When it is on, the detail page receives every filter from the source visual, including slicers and cross-highlighting. When it is off, only the drillthrough field value is passed.
How do I go back after a drillthrough?
Click the back button Power BI adds to the top-left of the drillthrough page. In Power BI Desktop, hold Ctrl while you click it.
Can I drill through with a button instead of right-click?
Yes. Insert a button, open the Format pane, turn on Action, set Type to Drill through and choose the destination page. The button activates when the reader selects a single data point.
About the Author
PK (Priyendra Kumar) is a Microsoft Excel expert and trainer, founder of PK: An Excel Expert and NextGenTemplates.com. He has been teaching Excel and Power BI since 2016 on the PK: An Excel Expert YouTube channel.
Conclusion
Power BI drillthrough takes one field in the Drill through well and turns any summary visual into a doorway to detail. Add the field, decide on Keep all filters, hide the detail pages and add a button for readers who don’t right-click, and your report becomes far easier to explore.