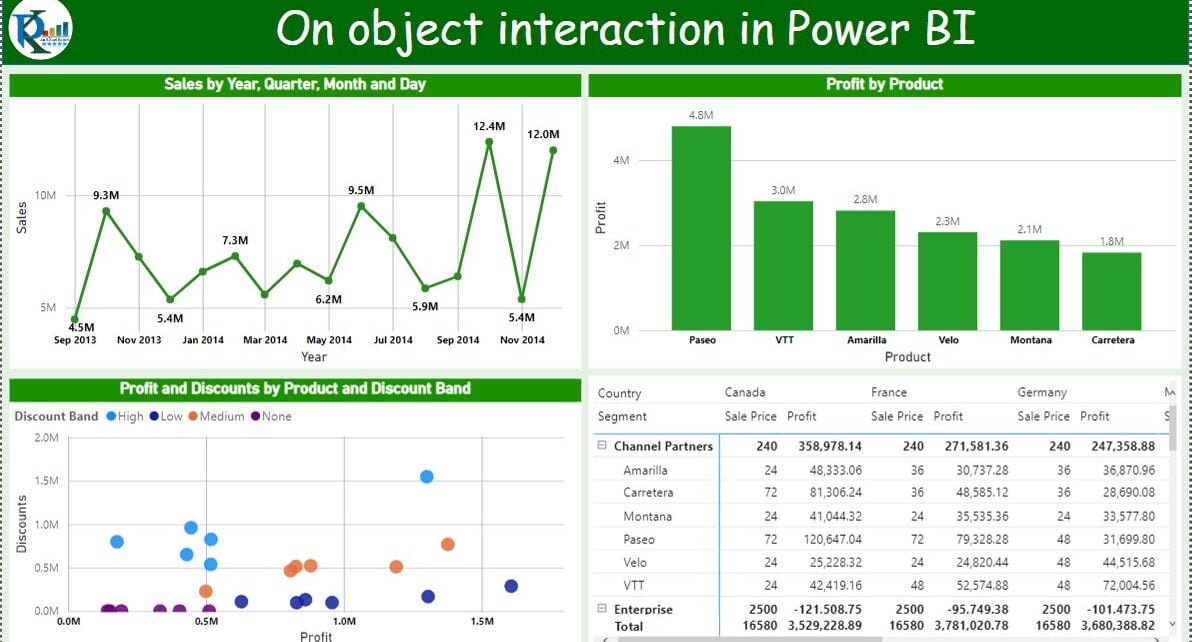
In this article, we will discover the benefits of using on-object interaction in Power BI, learn how to enable this feature, and understand the limitations and known issues.
What is On-Object Interaction in Power BI?
On-object interaction is an innovative way to build and format visuals directly on the visual itself. This feature streamlines common actions for creating and formatting visuals, such as adding fields, changing visualization types, and formatting text.
Enabling On-Object Interaction in Power BI
Since on-object interaction is a preview feature, you need to enable it first. By turning it on, you’ll also activate the new Visualizations and Format pane functionality changes. For more information, refer to the updated Format and Visualizations panes in Power BI article.
Follow these steps to enable on-object interaction:
- In Power BI Desktop, navigate to File > Options and settings > Options > Preview Features > On-object interaction.
- Restart Power BI Desktop to see the new experience.
- Building and Formatting Visuals with On-Object Interaction
Building a Visual
Start building a new visual in one of three ways:
- Select or drag fields from the Data pane.
- Select a new visual from the Insert section of the ribbon, then add fields. If the ribbon is collapsed, select Visual gallery > choose a visual.
- Right-click the canvas > Add visual.
The Visualizations pane is intentionally unavailable when using on-object interaction. More details can be found in the updated Format and Visualizations panes in Power BI article.
Changing Visual Types
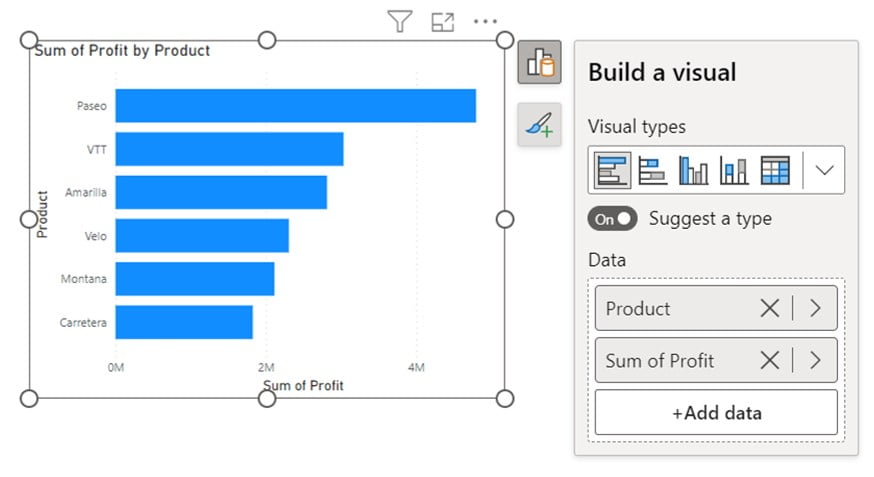
As you add fields, the visual type updates dynamically based on Power BI’s recommendation for the best visual type for your data. To change the visual type manually, select the Build a visual button and choose a visual in the Visual types tray or disable the automatic Suggest a type toggle.
Adding Data to a Visual
From the flyout menu, you can continue to add data. Click the Add data button and select fields from the Select data pane.
Adding Data to a Visual
Formatting a Visual On-Object
The default behavior when hovering over a visual is to see tooltips, while clicking around a visual gives the cross-highlight and cross-filter effect. To avoid conflicts with this existing behavior, a new format mode is introduced. In format mode, hover and click behavior changes to show sub selection regions.
Enter format mode in one of two ways:
- Double-click a visual.
- Right-click a visual > select Format.
When in format mode, the bounding box turns blue, handle shapes become squares, and hover and click behavior changes to show subs election regions. Now, you can hover and click around the visual to format specific sub selections. Right-click the selected element to access the mini-toolbar and shortcut menu.
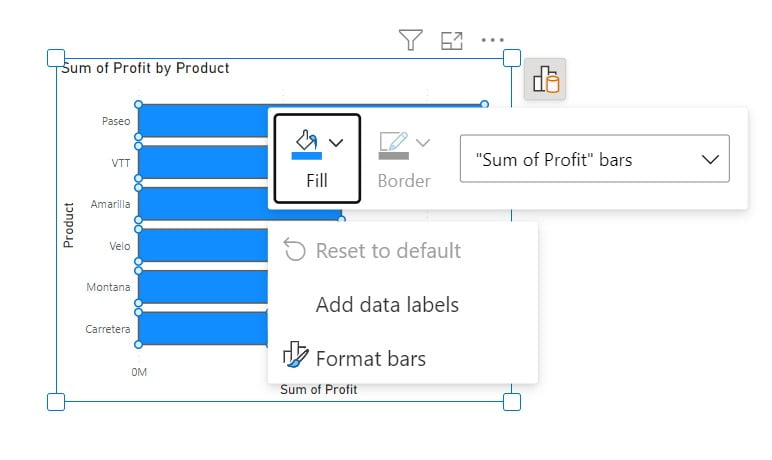
Formatting a Visual On-Object
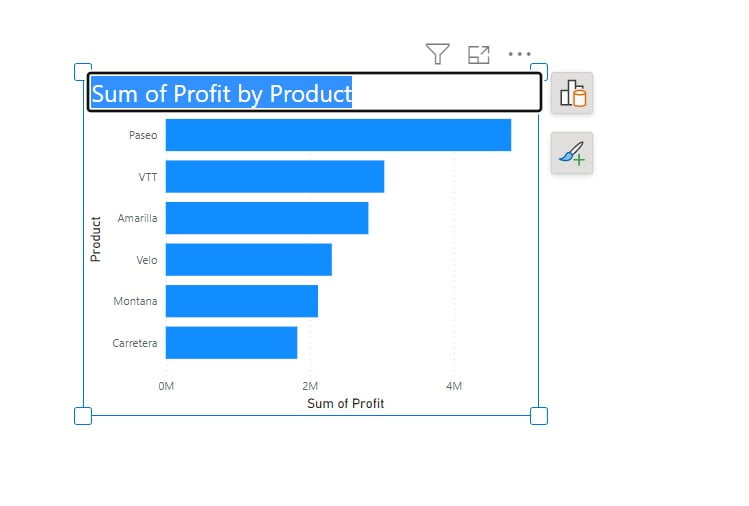
Editing Labels and Titles
Edit labels and titles on visuals directly by double-clicking the label you’d like to edit and typing. Click away from the label or press Enter to save your changes.
Limitations and Known Issues
Supported Visuals and Formatting Limitations
On-object formatting is currently supported for bar, column, line, area, combo, and scatter visuals, but not small multiples. Format mode is not supported in mobile layout or focus mode.
Sub-selections Limitations
Small multiples and analytics pane items are not selectable in format mode. Sub-selection regions don’t scale as expected in spotlight mode or after using zoom sliders. Reset to default may not reset direct text edit and background colors for data and category labels.
On-Object Buttons Limitations
On-object buttons might appear above the formula bar if they’re open simultaneously.
Warnings and Issues
- If you set the title or label by conditional formatting, it’s possible to override the text with the new direct text editing feature. Certainly, this is a known issue that is being addressed to block and warn users that dynamic text takes precedence.
- While responsive mode is on, the mini toolbar will increase to the responsive upper bound and then stop. Also, this may appear as a bug, but an error state will be added to communicate this limitation.
Custom Visuals and Accessibility
- An API is planned for custom visual developers to define sub-selection regions within their visuals. To find custom visuals using the new visualization gallery in the ribbon, you must expand the full dropdown.
- Full accessibility is not currently supported for on-object interaction.
By understanding the capabilities and limitations of on-object interaction in Power BI, you can improve your data visualization experience and make more informed decisions about how to format and present your data.
Conclusion
On-object interaction in Power BI is a powerful and innovative feature which enhances the process of creating and formatting visuals. By understanding how to enable and utilize this feature, you can streamline your data visualization experience and create more effective and dynamic visuals. However, it’s essential to be aware of the limitations and known issues with on-object interaction. It will help you make better decisions when using this feature. As Power BI continues to evolve, users can look forward to further improvements and the introduction of new features which will make data visualization even more efficient and accessible. This feature is in Preview mode as of now (in March 2023 update) and will be available for general availability. So, Update your Power BI desktop application today from below link-
https://www.microsoft.com/en-us/download/details.aspx?id=58494
Frequently Asked Questions:
Q1: What is on-object interaction in Power BI?
A1: On-object interaction is a feature which allows users to build and format visuals directly on the visual itself. It streamlines common actions like adding fields, changing visualization types, and formatting text, making it easier and more efficient to create and format visuals in Power BI.
Q2: How do I enable on-object interaction in Power BI?
A2: To enable on-object interaction, follow these steps:
- In Power BI Desktop, go to File > Options and settings > Options > Preview Features > On-object interaction.
- After that, restart Power BI Desktop to see the new experience.
Q3: How can I build a visual using on-object interaction?
A3: To build a visual using on-object interaction, you can:
- Select or drag fields from the Data pane.
- Select a new visual from the Insert section of the ribbon, then add fields.
- Alternatively, right-click the canvas > Add visual.
Q4: How do I format a visual using on-object interaction?
A4: To format a visual on-object, enter format mode by double-clicking a visual or right-clicking a visual and selecting Format. Now, the bounding box will turn blue, and you can hover and click around the visual to format specific sub-selections. Finally, right-click the selected element to access the mini-toolbar and shortcut menu.