Data visualization is an important part of modern businesses. It helps companies to make decisions based on data-driven insights. Microsoft Power BI is a business intelligence tool Which provides the capabilities to transform data into visualizations. In this article, we will show you how to create a beautiful Power BI dashboard with 3D Glass Charts. We will walk you through step by step how to create it and the techniques to customize it according to your requirements.
Live Power BI dashboard with 3D Glass Chart
Creating the Power BI dashboard with 3D Glass Chart
To create the 3D glass and attractive background for the dashboard, we have used Microsoft PowerPoint. Microsoft PowerPoint is a part of Microsoft Office. Many people are familiar with it. It has a lot of design capabilities. We created a 3D glass image which suited our requirements for the dashboard. We customized the image with the colors and design we wanted. Once the 3D glass image was ready, we saved it as an image file and imported it into Power BI. We also added other images and shapes to create a more dynamic and visually appealing background.
Displaying KPIs
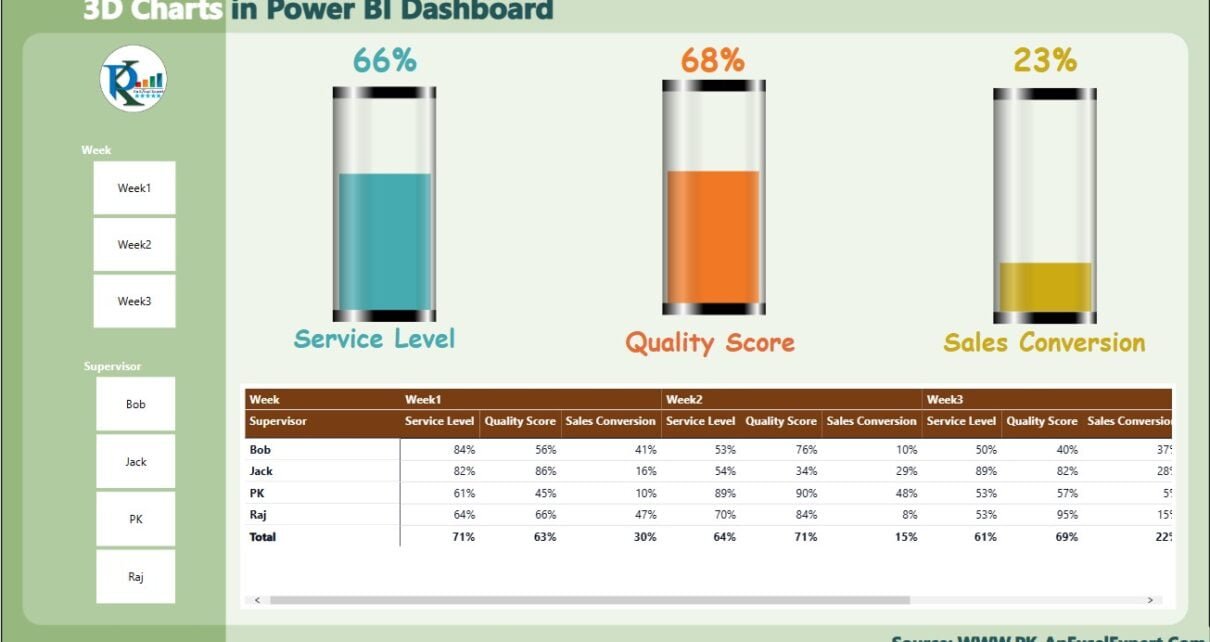
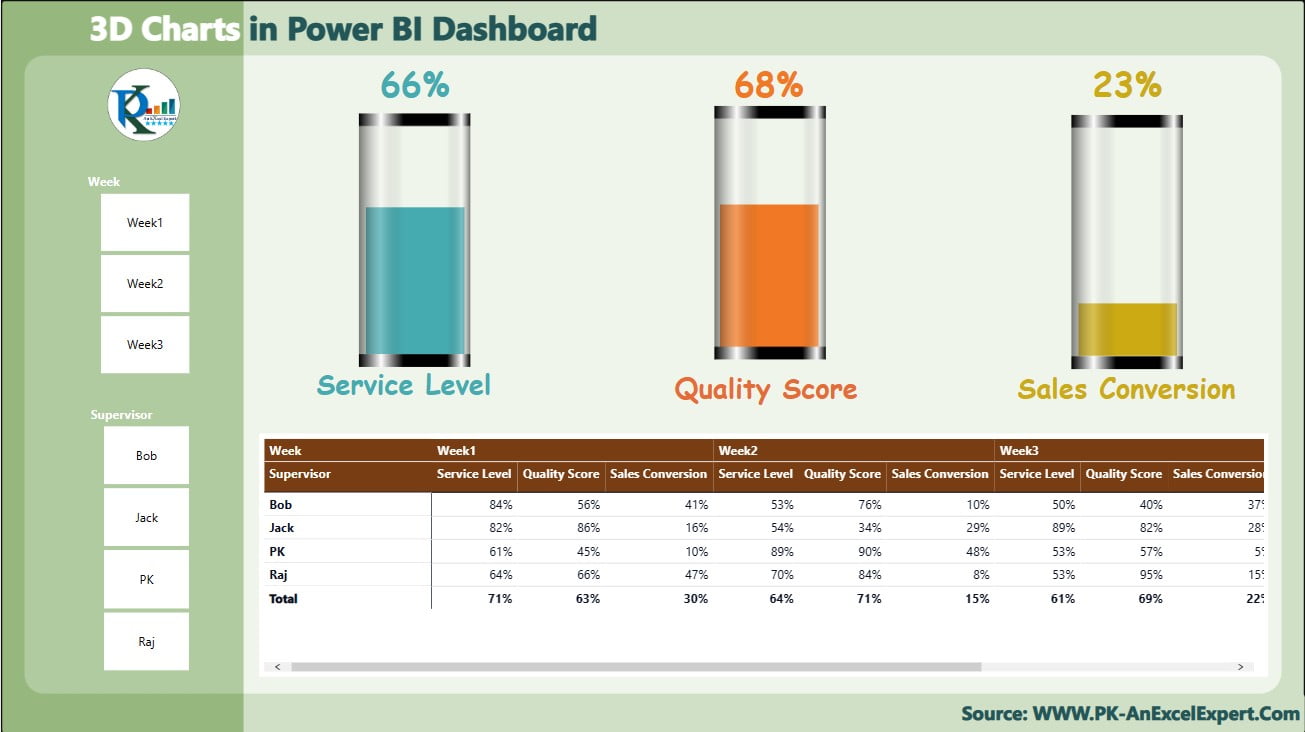
The dashboard displays three KPIs – Service Level, Quality Score, and Sales Conversion. We used 3D glass charts to display these KPIs, making them more interesting and engaging. The charts are dynamic, meaning they will update when you use the slicers to filter. In addition to the 3D glass charts, we added supporting data in the form of tables, which provide additional information for the user.
Using Slicers
On the left side of the dashboard, we created a slicer panel where we added Week and Supervisor slicers. The slicers are used to filter the data and update the 3D glass charts accordingly. This makes it easy for the user to see the performance of different departments or teams and make informed decisions.
Detailed Table
Below the 3D glasses, we added a detailed table that shows the data used in the charts. This table provides additional information for the user and allows them to see the numbers behind the KPIs.
Step-by-Step Tutorial
We have created a step-by-step YouTube video tutorial that shows you how to create this beautiful dashboard in Power BI. The video covers everything from creating the 3D glass chart in PowerPoint to importing it into Power BI and adding the data. We have also provided the free download of practice files so that you can follow along and create the dashboard yourself.
Visit our YouTube channel to learn step-by-step video tutorials
Watch the step-by-step video tutorial:
Conclusion:
Microsoft Power BI is a powerful business intelligence tool to create data-driven dashboards and reports. In this article, we have explained to you how to create a beautiful dashboard with a 3D Glass Chart, slicer panel, and table in Power BI. We used Microsoft PowerPoint to create the 3D Glass image and customized the dashboard background.
You can create the visually stunning dashboard using the techniques which we explained to you in this article. We also provided a step-by-step YouTube video tutorial and free practice files to help you create your own dashboard. We hope you found this article helpful. You can use these techniques to create your own Power BI dashboard.