Home>Blogs>Power BI>Quality Analysis Dashboard in Power BI
Quality Analysis Dashboard
Power BI

Quality Analysis Dashboard in Power BI

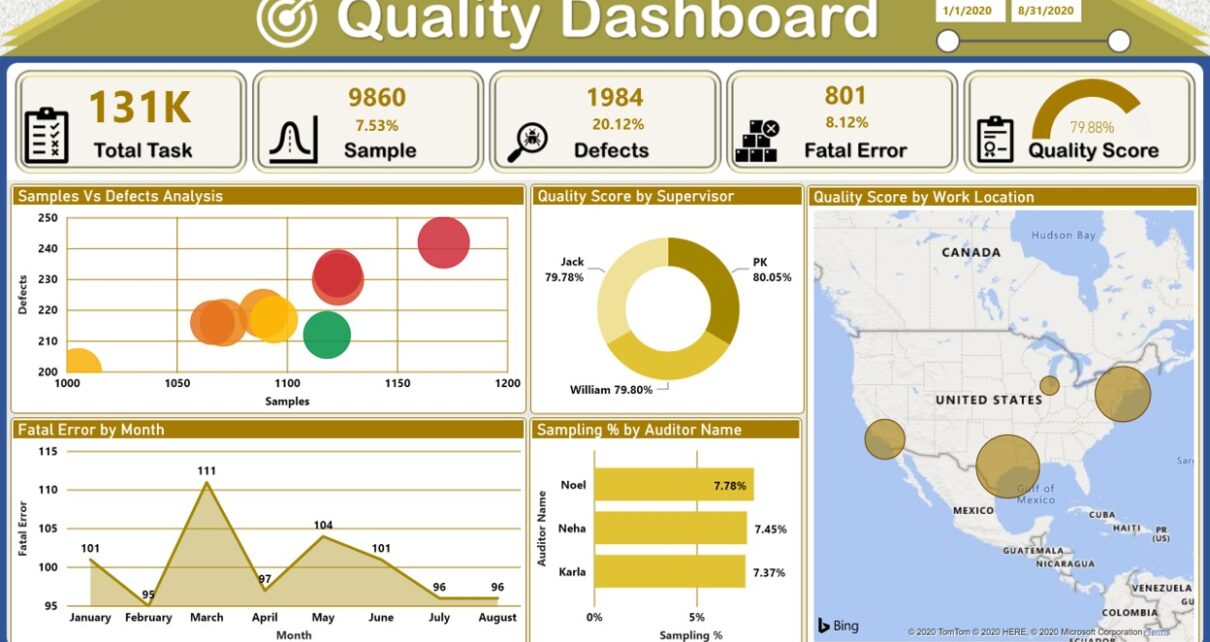
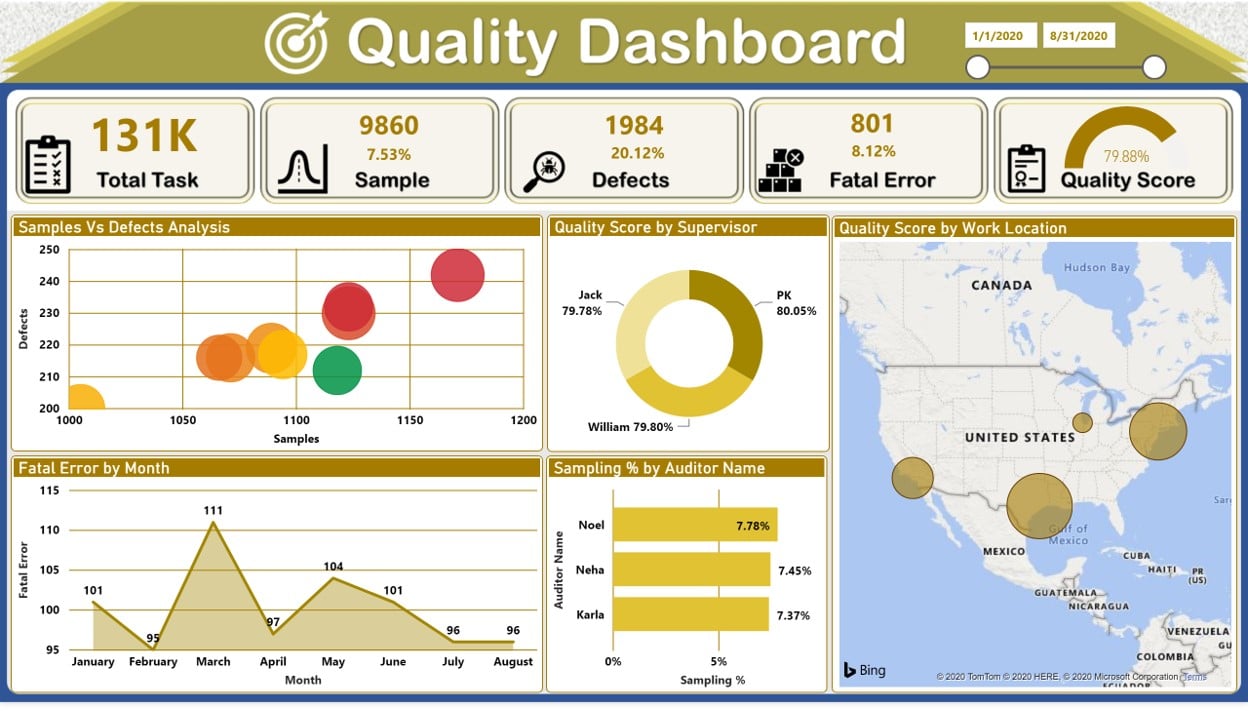
In the article, we have created a beautiful Quality Analysis Dashboard in Microsoft Power BI. We have used sample data to create this dashboard. In this dashboard, we have displayed Total Task, Sample, Defect, Fatal Error, and Quality Score.

This dashboard has two pages. The First page is the main dashboard page, wherein we have displayed multiple charts and cards for various metrics.


Quality Analysis Dashboard in Power BI
or

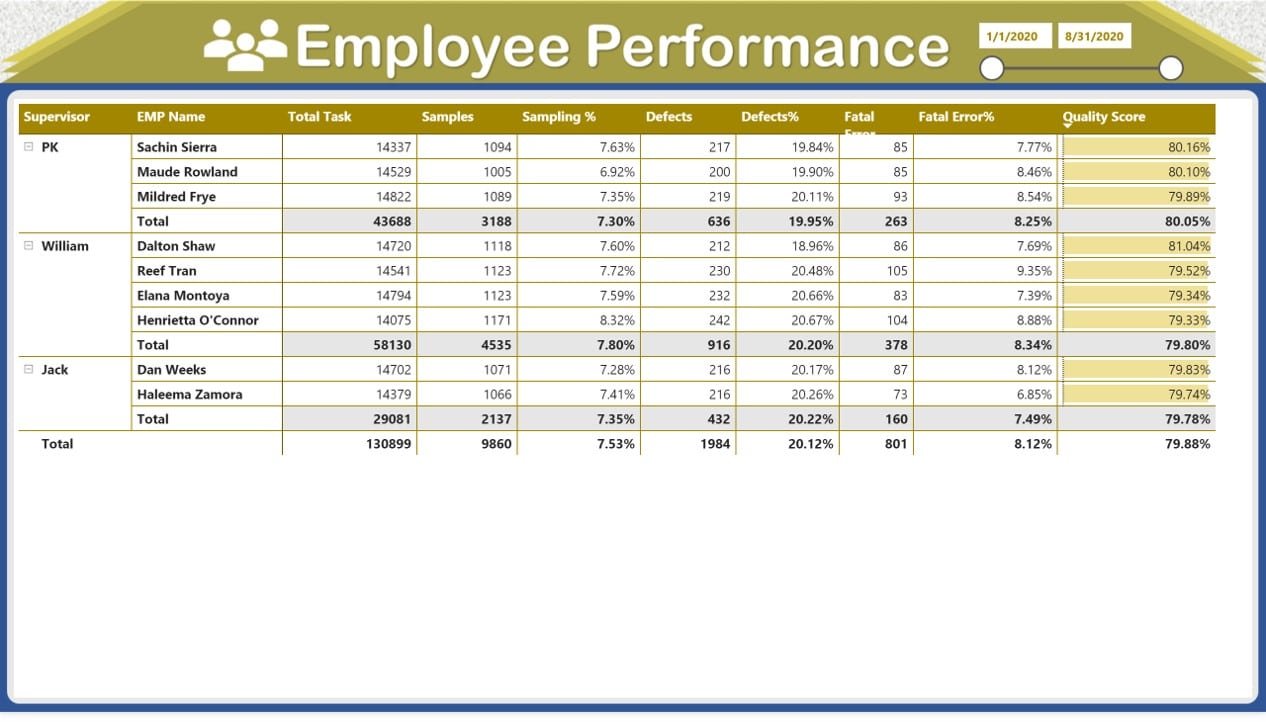
In the 2nd, we have displayed the tabular view by employee and supervisor.

Tabular view
Tabular view

Live dashboard is given below-

Visit our YouTube channel to learn step-by-step video tutorials

Youtube.com/@PKAnExcelExpert

Watch the step by step video tutorial:

or


PK
Meet PK, the founder of PK-AnExcelExpert.com! With over 15 years of experience in Data Visualization, Excel Automation, and dashboard creation. PK is a Microsoft Certified Professional who has a passion for all things in Excel. PK loves to explore new and innovative ways to use Excel and is always eager to share his knowledge with others. With an eye for detail and a commitment to excellence, PK has become a go-to expert in the world of Excel. Whether you're looking to create stunning visualizations or streamline your workflow with automation, PK has the skills and expertise to help you succeed. Join the many satisfied clients who have benefited from PK's services and see how he can take your Excel skills to the next level!
https://www.pk-anexcelexpert.com