New: NextGenTemplates Academy - video courses on Excel formulas with AI and Pivot Tables & dashboards. Early-bird: 20% off with code EARLYBIRD20 - first 20 orders only. See the courses →
  • Learn Excel (Free Course)
    • 1. Shortcut Keys
    • 2. Fill & Flash Fill
    • 3. Find & Replace
    • 4. Sort & Filter
    • 5. Formulas & Functions
    • 6. Data Validation
    • 7. Conditional Formatting
    • 8. Basic Charts
    • 9. Advanced Charts
    • 10. Pivot Tables
    • 11. Excel Dashboards
    • 12. VBA Course
    • 13. Excel Formulas with AI
  • Templates
  • Tutorials
    • Charts and Visualization
    • VBA
    • Excel Tips and Tricks
    • Excel Dashboards
    • Power Pivot & DAX
  • Power BI
  • Template Store
    • Ready to Use Templates
  • Courses
  • Academy
    • Excel + AI Mastery: 100 Formulas
    • Excel Pivot Tables & Dashboards
  • About Us
  • Contact Us

PK: An Excel Expert

Transforming Data into Decisions

Tag: Power BI Desktop

Dashboard Power BI

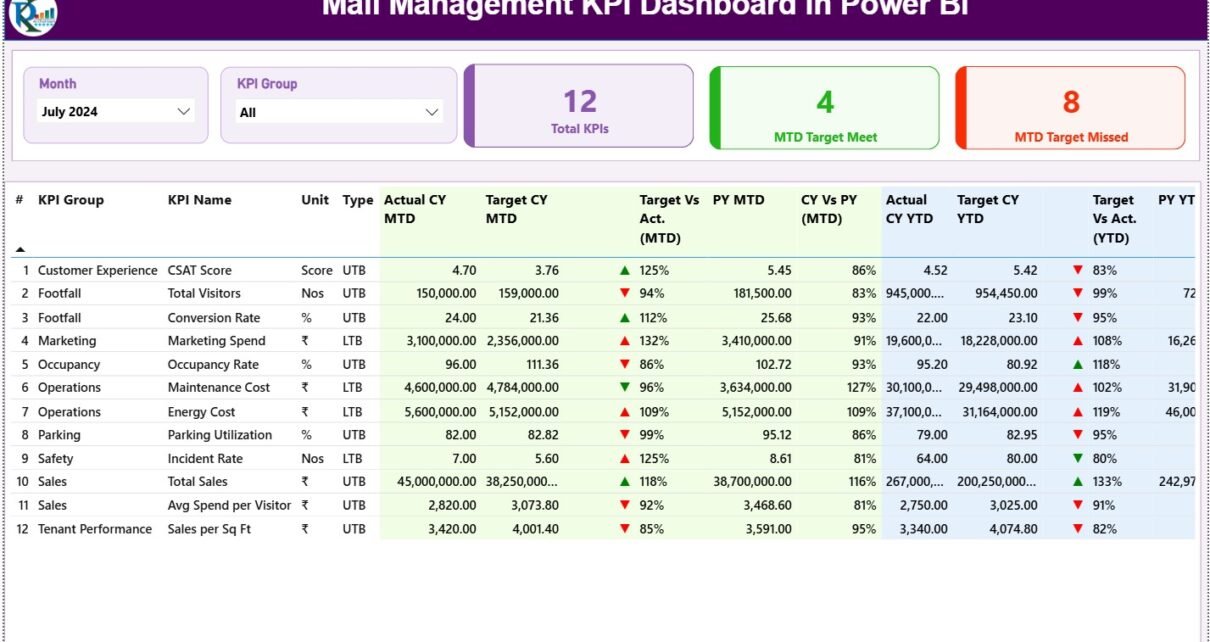
Mall Management KPI Dashboard in Power BI

December 16, 2025December 16, 2025 PKComments Off on Mall Management KPI Dashboard in Power BI
Managing a shopping mall today requires much more than leasing spaces and collecting rent. Mall managers must constantly track footfall, revenue performance, operational efficiency, tenant success, and customer experience. However,
Read More
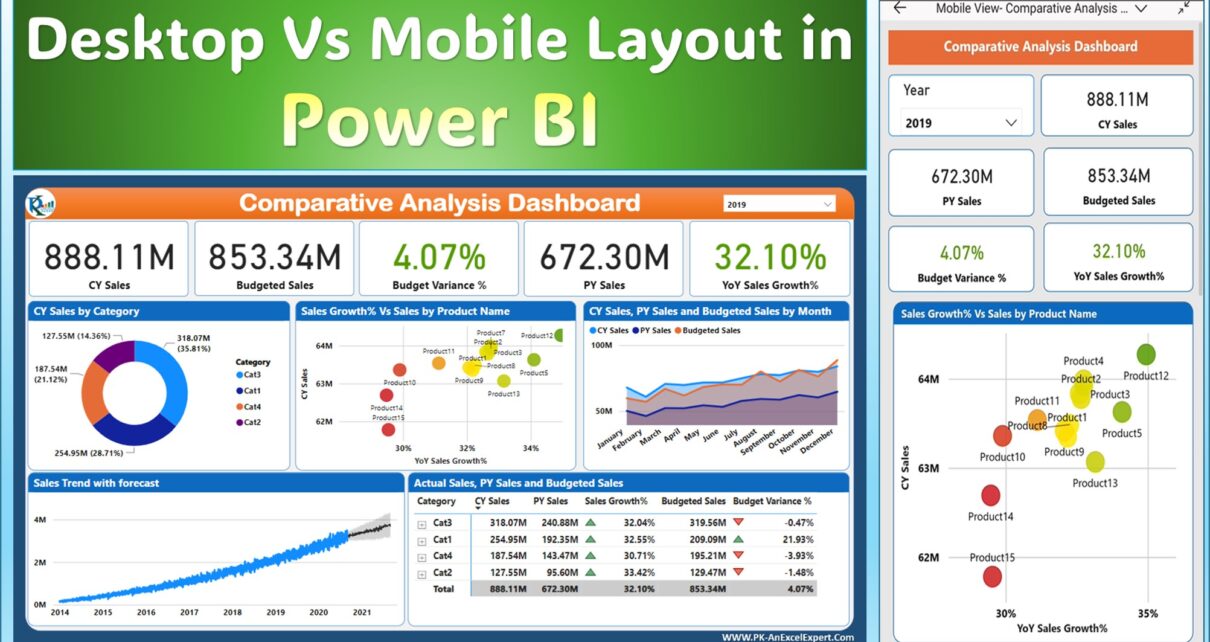
Mobile Layout in Power BI
Power BI

Power BI Sales Dashboard Design for Mobile

October 5, 2023February 25, 2025 PKComments Off on Power BI Sales Dashboard Design for Mobile
With an increasing number of people accessing their data on mobile devices, Power BI Sales Dashboard Design for Mobile for mobile has become essential. It has the power to revolutionize
Read More
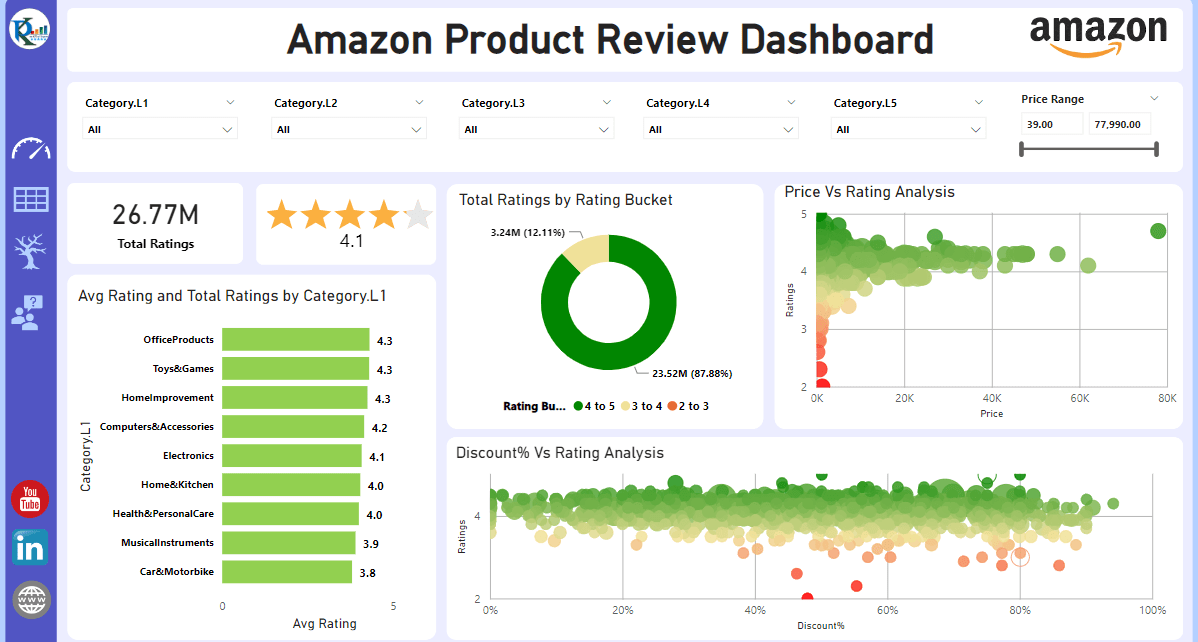
Amazon Product Review Dashboard
Power BI

Product Review Dashboard in Power BI

June 5, 2023February 25, 2025 PKComments Off on Product Review Dashboard in Power BI
Introduction In an era where data is king, it's crucial to have efficient tools that help businesses draw insightful conclusions from their data. One such tool is Power BI, a
Read More
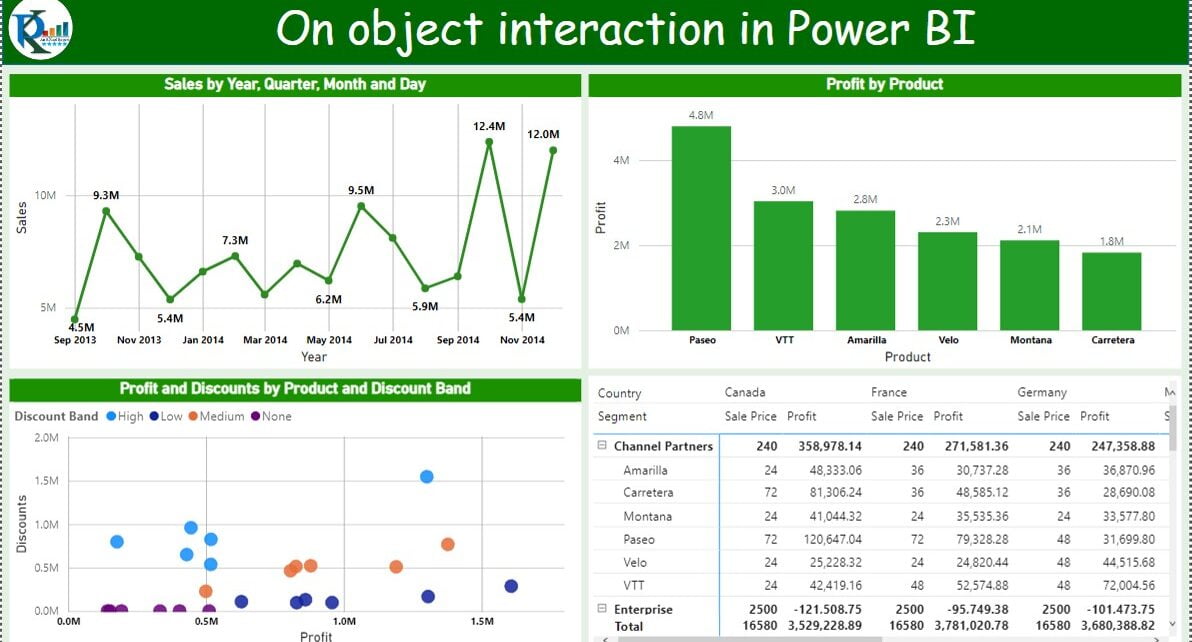
On object interaction in Power BI
Power BI

Enhance Your Power BI Experience with On-Object Interaction

March 19, 2023October 10, 2026 PKComments Off on Enhance Your Power BI Experience with On-Object Interaction
In this article, we will discover the benefits of using on-object interaction in Power BI, learn how to enable this feature, and understand the limitations and known issues. What is
Read More
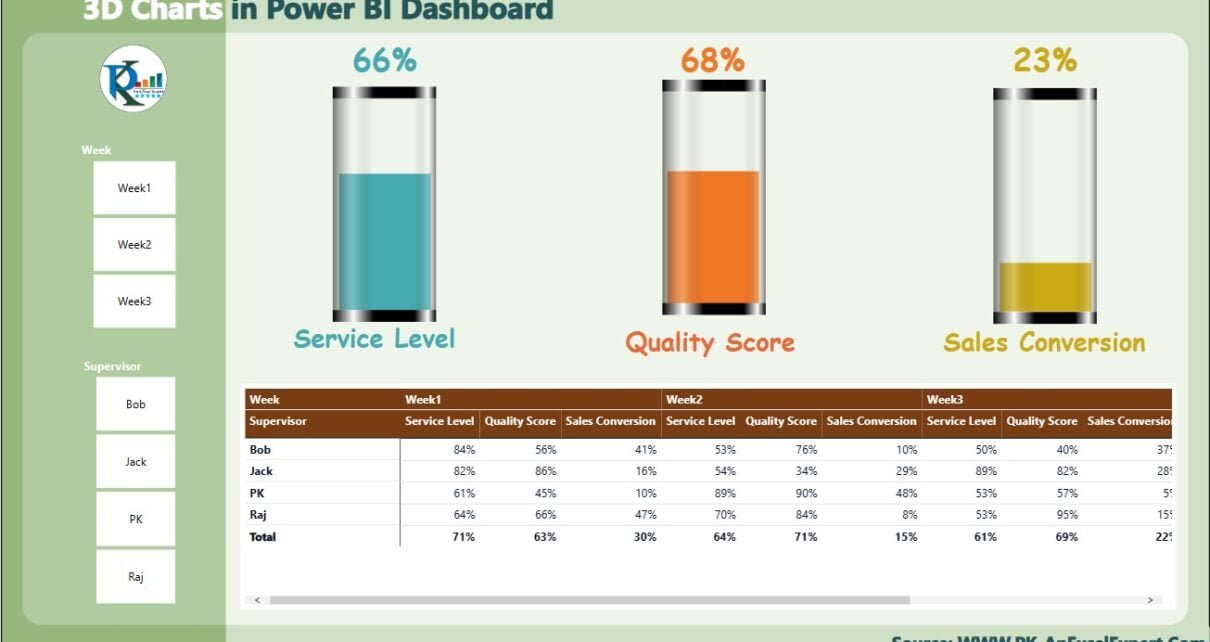
3D Glass Chart in Power BI
Power BI

Power BI dashboard with 3D Glass Chart

January 23, 2023October 10, 2026 PKComments Off on Power BI dashboard with 3D Glass Chart
Data visualization is an important part of modern businesses. It helps companies to make decisions based on data-driven insights. Microsoft Power BI is a business intelligence tool Which provides the
Read More
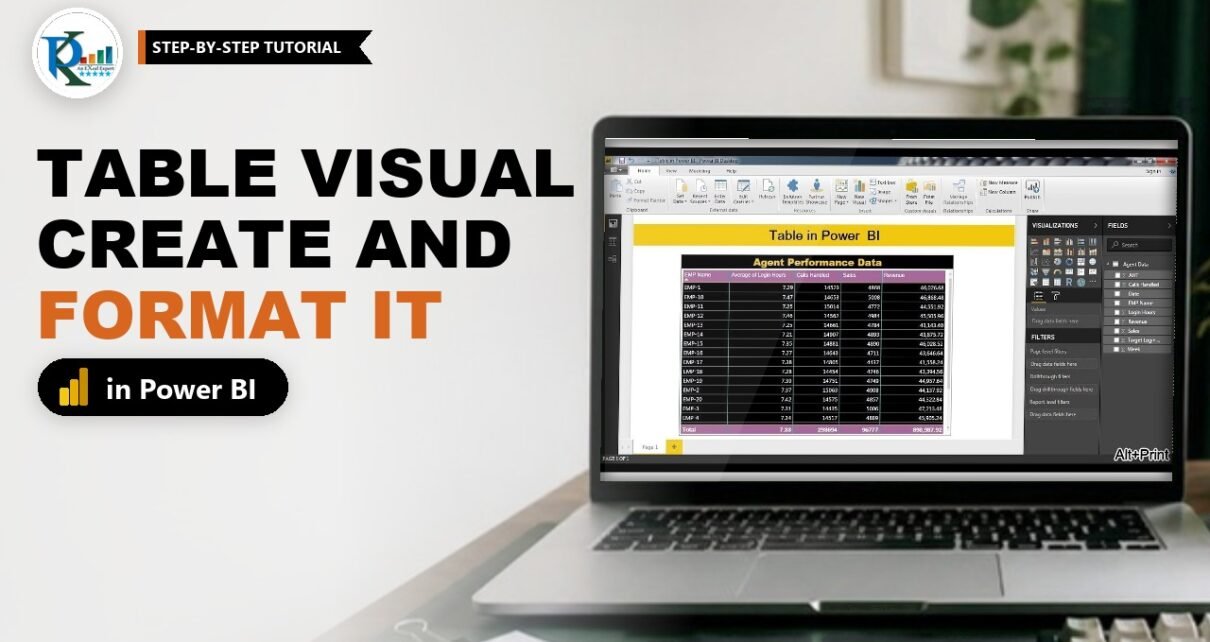
Table in Power BI: Create and Format a Table Visual
Power BI

Table in Power BI: Create and Format a Table Visual

October 4, 2022October 10, 2026 PKComments Off on Table in Power BI: Create and Format a Table Visual
A table in Power BI is the quickest way to show exact numbers: one row per item, one column per field, and a total row at the bottom. In this
Read More
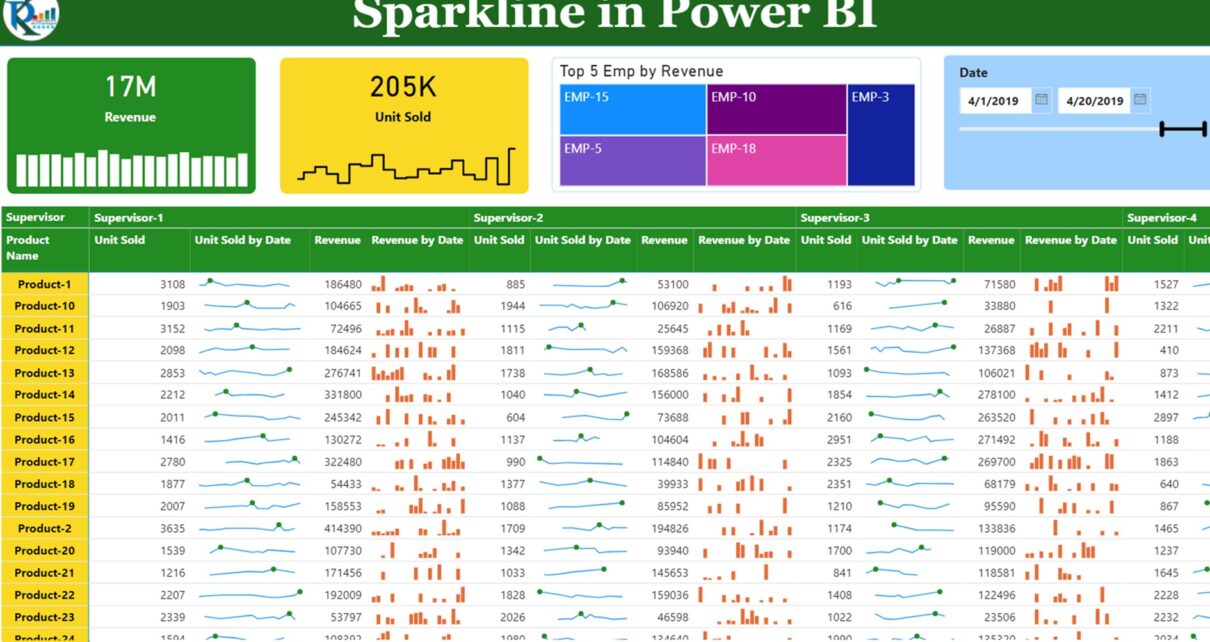
Sparklines in Power BI
Power BI

Sparklines in Power BI

May 17, 2022October 10, 2026 PKComments Off on Sparklines in Power BI
Sparklines are the small charts that can be created in the Table/Matrix cell to show the trend of over the period. We can use the sparklines in the Power BI report also. It
Read More
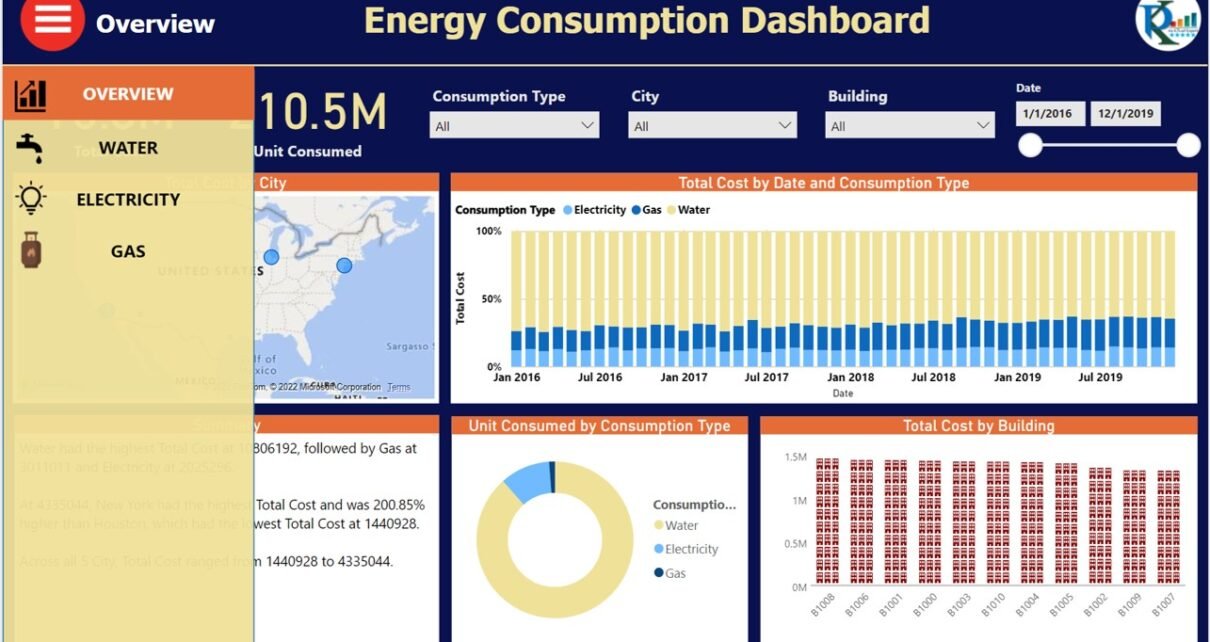
Energy Consumptions Dashboard
Power BI

Energy Consumptions Dashboard in Power BI

March 1, 2022March 27, 2024 PKComments Off on Energy Consumptions Dashboard in Power BI
We have created this Energy Consumptions Dashboard in Microsoft Power BI. We have explained step by step data transformation in Power Query, Creation of the Relationship between fact & dimension
Read More
  • Learn Excel (Free Course)
    • 1. Shortcut Keys
    • 2. Fill & Flash Fill
    • 3. Find & Replace
    • 4. Sort & Filter
    • 5. Formulas & Functions
    • 6. Data Validation
    • 7. Conditional Formatting
    • 8. Basic Charts
    • 9. Advanced Charts
    • 10. Pivot Tables
    • 11. Excel Dashboards
    • 12. VBA Course
    • 13. Excel Formulas with AI
  • Templates
  • Tutorials
    • Charts and Visualization
    • VBA
    • Excel Tips and Tricks
    • Excel Dashboards
    • Power Pivot & DAX
  • Power BI
  • Template Store
    • Ready to Use Templates
  • Courses
  • Academy
    • Excel + AI Mastery: 100 Formulas
    • Excel Pivot Tables & Dashboards
  • About Us
  • Contact Us
Copyright © 2023 PK-AnExcelExpert.com - Privacy Policy