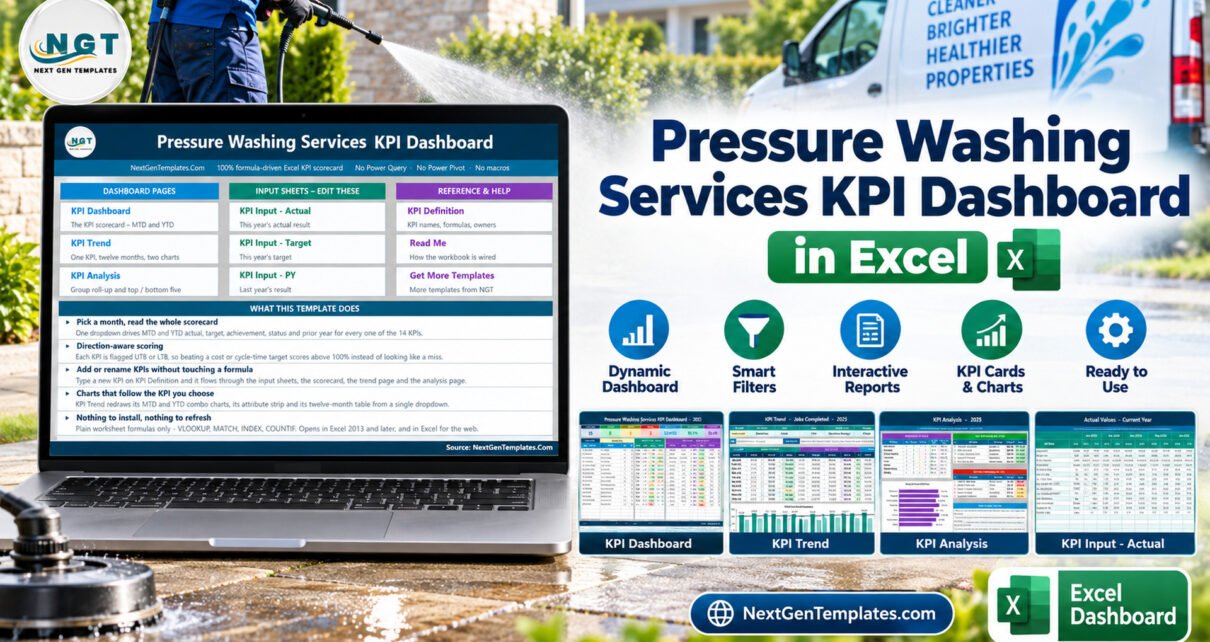
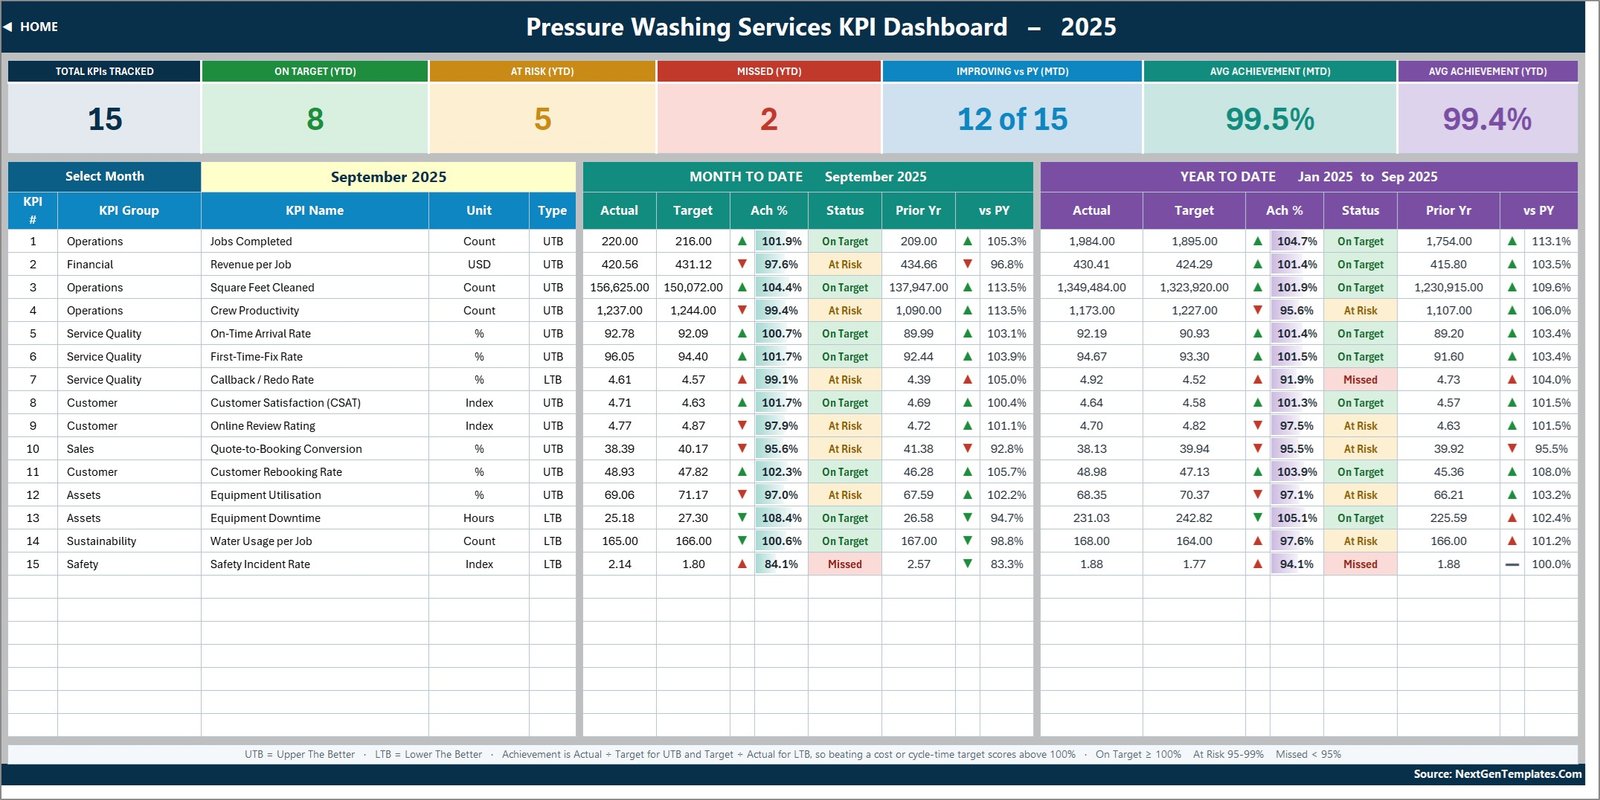
The Pressure Washing Services KPI Dashboard in Excel puts 15 pressure washing KPIs from 8 groups on one monthly scorecard. For each KPI it shows MTD and YTD actual, target, achievement percentage, a traffic-light status and a prior-year comparison. With the September 2025 sample selected, the summary cards read 8 KPIs On Target, 5 At Risk and 2 Missed for the year to date, 12 of 15 improving on last year, and average achievement of 99.5% MTD and 99.4% YTD.
Most exterior cleaning companies keep jobs in a scheduling app, revenue in accounting software and callbacks in someone’s memory, so a monthly review means pulling three sources together. This Excel KPI dashboard template puts operations, revenue, service quality, customer, sales, equipment, water use and safety KPIs in one workbook, driven by a single month dropdown. It belongs to the NextGenTemplates KPI Dashboard family (month picker, traffic lights, KPI Trend and KPI Analysis pages). It is not an analytical data dashboard, and it is a different workbook from the separate Pressure Washing Services KPI Scorecard edition.
Key Features of the Pressure Washing Services KPI Dashboard in Excel
- 15 ready-made KPIs for pressure washing. Jobs Completed, Revenue per Job, Square Feet Cleaned, Crew Productivity, On-Time Arrival Rate, First-Time-Fix Rate, Callback / Redo Rate, Customer Satisfaction (CSAT), Online Review Rating, Quote-to-Booking Conversion, Customer Rebooking Rate, Equipment Utilisation, Equipment Downtime, Water Usage per Job and Safety Incident Rate.
- One month picker. Cell D6 on the KPI Dashboard lists the twelve months of the reporting year. Changing it recalculates the scorecard, the seven summary cards and the KPI Analysis page.
- Direction-aware achievement. Achievement is Actual divided by Target for Upper The Better KPIs and Target divided by Actual for Lower The Better KPIs. The sample has 11 UTB and 4 LTB KPIs, so cutting callbacks, downtime, water per job or incidents below target scores above 100%.
- Consistent status rules. On Target from 100%, At Risk from 95% to 99%, Missed below 95%, used on every page.
- Built to grow. The sheets are wired for 22 KPIs. Adding a row on KPI Definition feeds all three input sheets, the scorecard, the trend page and the analysis page.
- Formula-only. No macros, Power Query, Power Pivot or add-ins. It runs in Excel 2013 and later, and in Excel for the web.
Dashboard Pages Explanation
The workbook has 11 sheets. Ten are shown below. The eleventh, Support, holds helper calculations and needs no editing.
Home
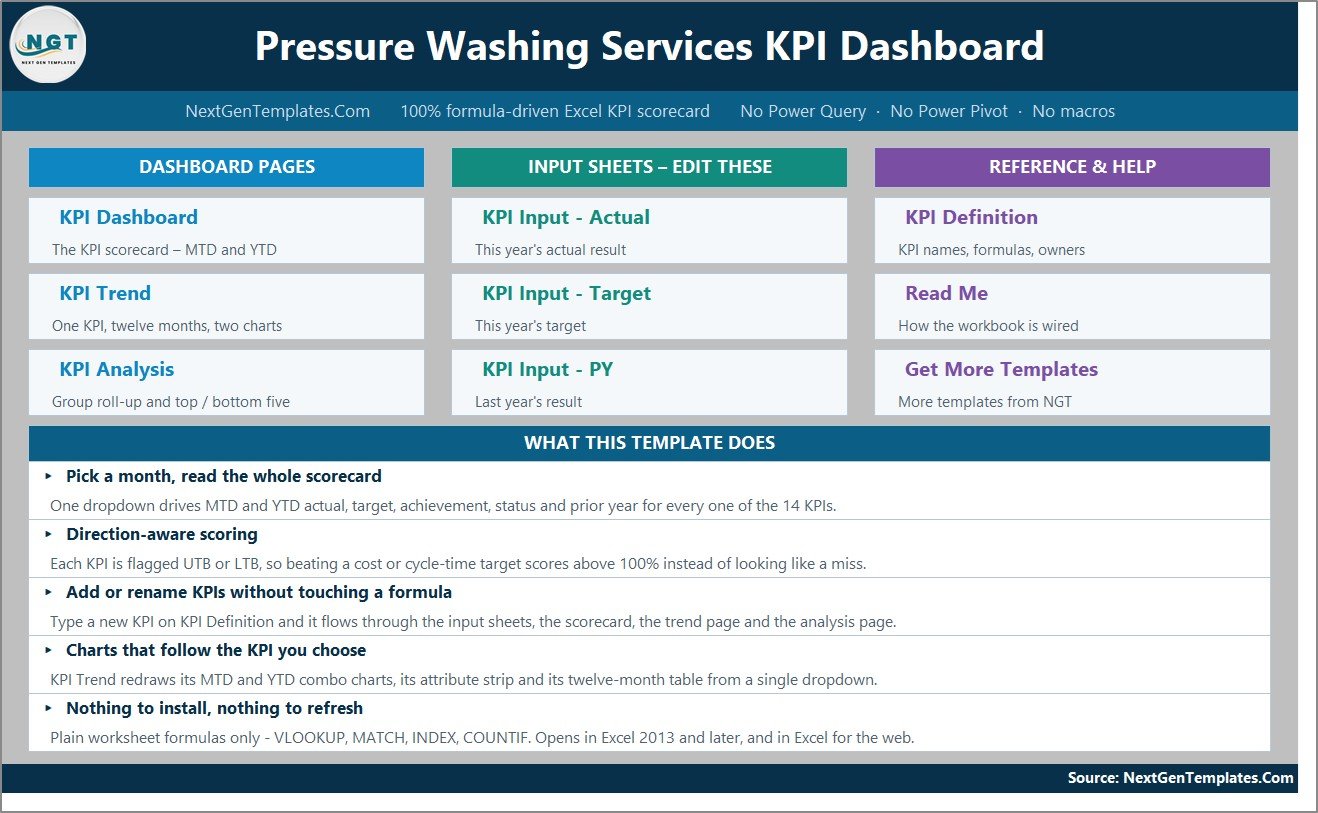
The landing page links to the three dashboard pages (KPI Dashboard, KPI Trend, KPI Analysis), the three input sheets, and the reference sheets (KPI Definition, Read Me, Get More Templates). It also summarises the five things the template does.
KPI Dashboard
Seven cards sit across the top: Total KPIs Tracked (15), On Target YTD (8), At Risk YTD (5), Missed YTD (2), Improving vs PY MTD (12 of 15), Avg Achievement MTD (99.5%) and Avg Achievement YTD (99.4%). Below them, one row per KPI shows group, name, unit and type, then a Month To Date block and a Year To Date block, each with actual, target, achievement %, status, prior year and vs PY. In September, Jobs Completed reads 220 against a target of 216, Revenue per Job is At Risk at $420.56 against $431.12, and Safety Incident Rate is Missed at 84.1%.
KPI Trend
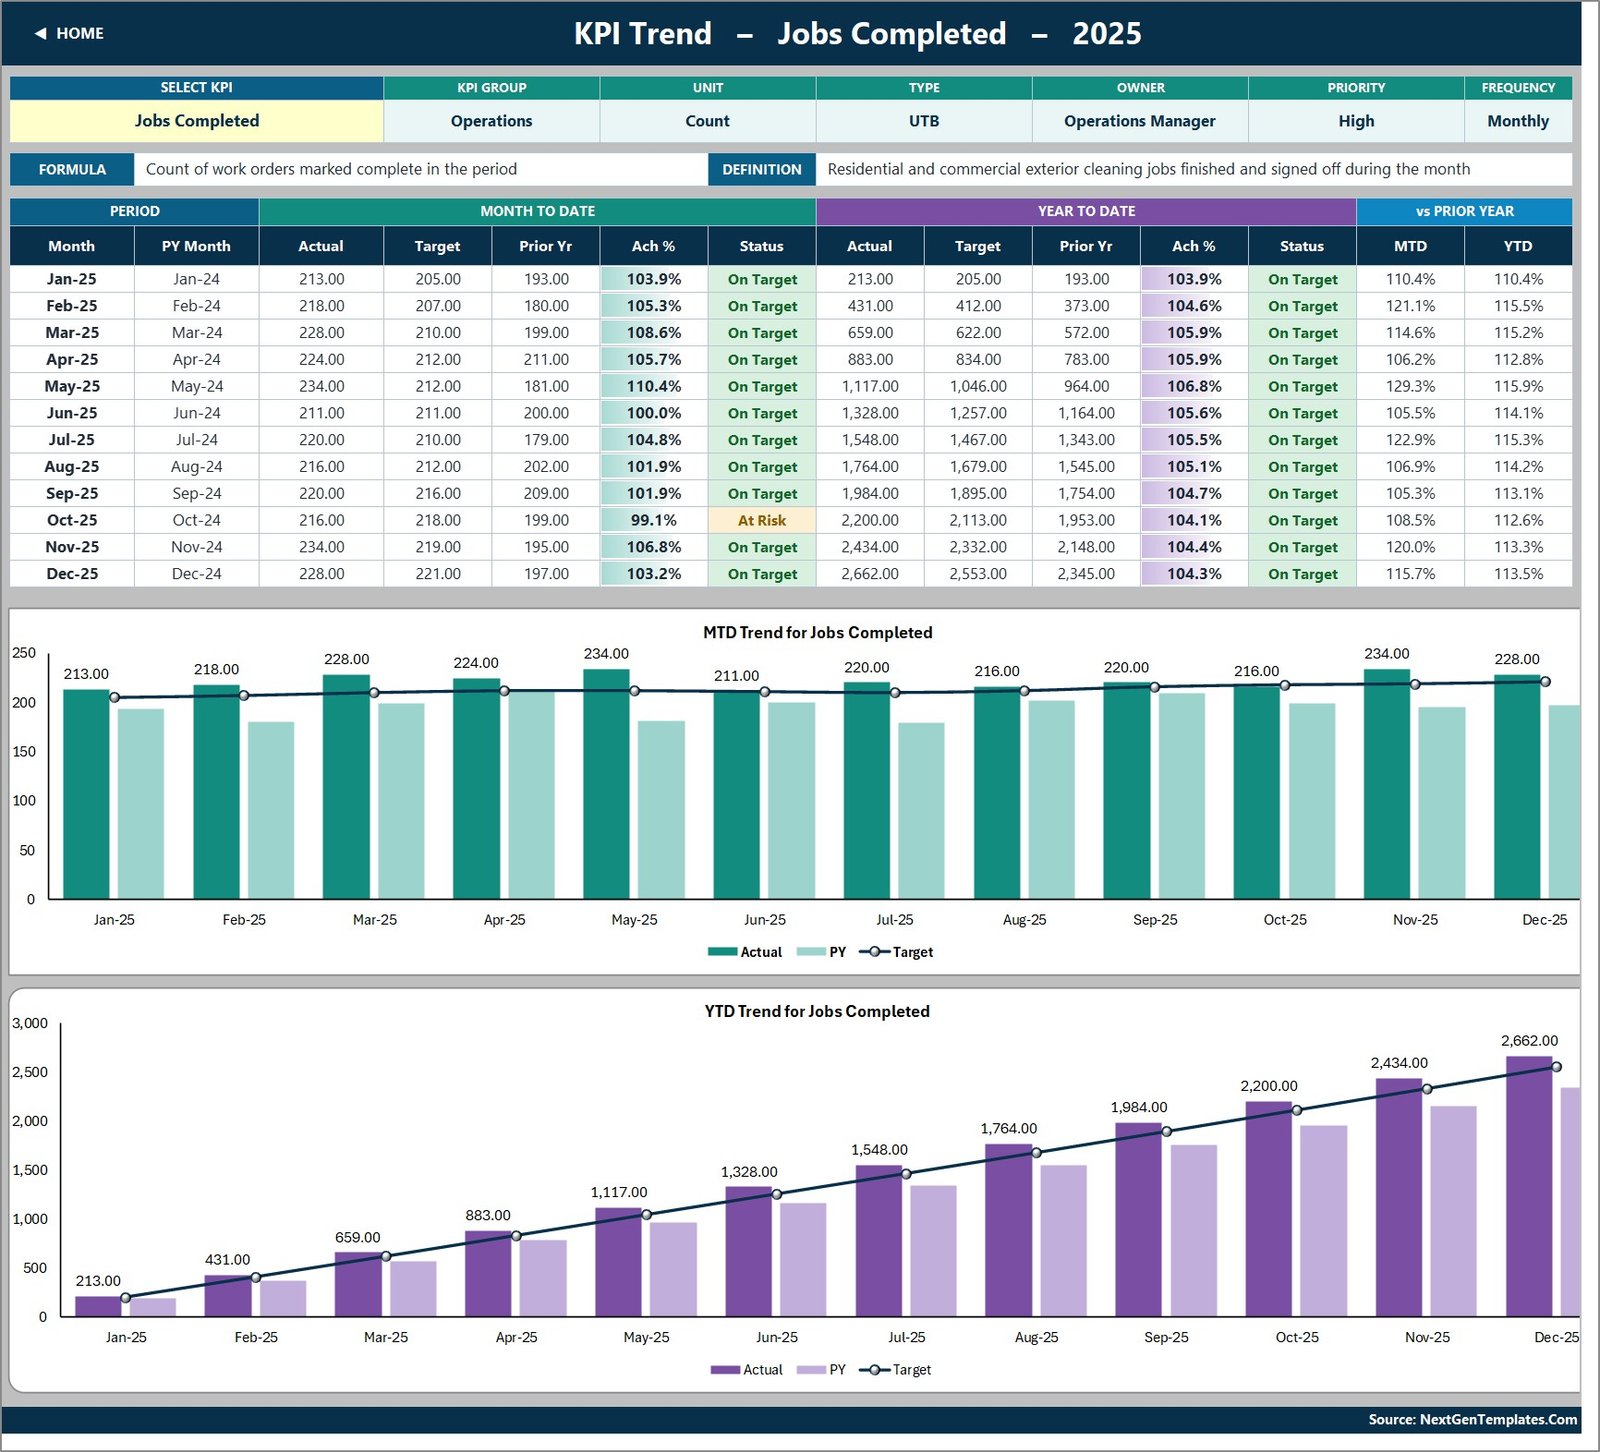
Choose a KPI in cell B4 and the page shows its group, unit, type, owner, priority, frequency, formula and definition. A twelve-month table lists MTD and YTD actual, target, prior year, achievement and status. Two charts follow: MTD Trend by Month and YTD Trend by Month, each with actual and prior-year columns and a target line. The screenshot shows Jobs Completed, owned by the Operations Manager, On Target in every month except October (99.1%).
KPI Analysis
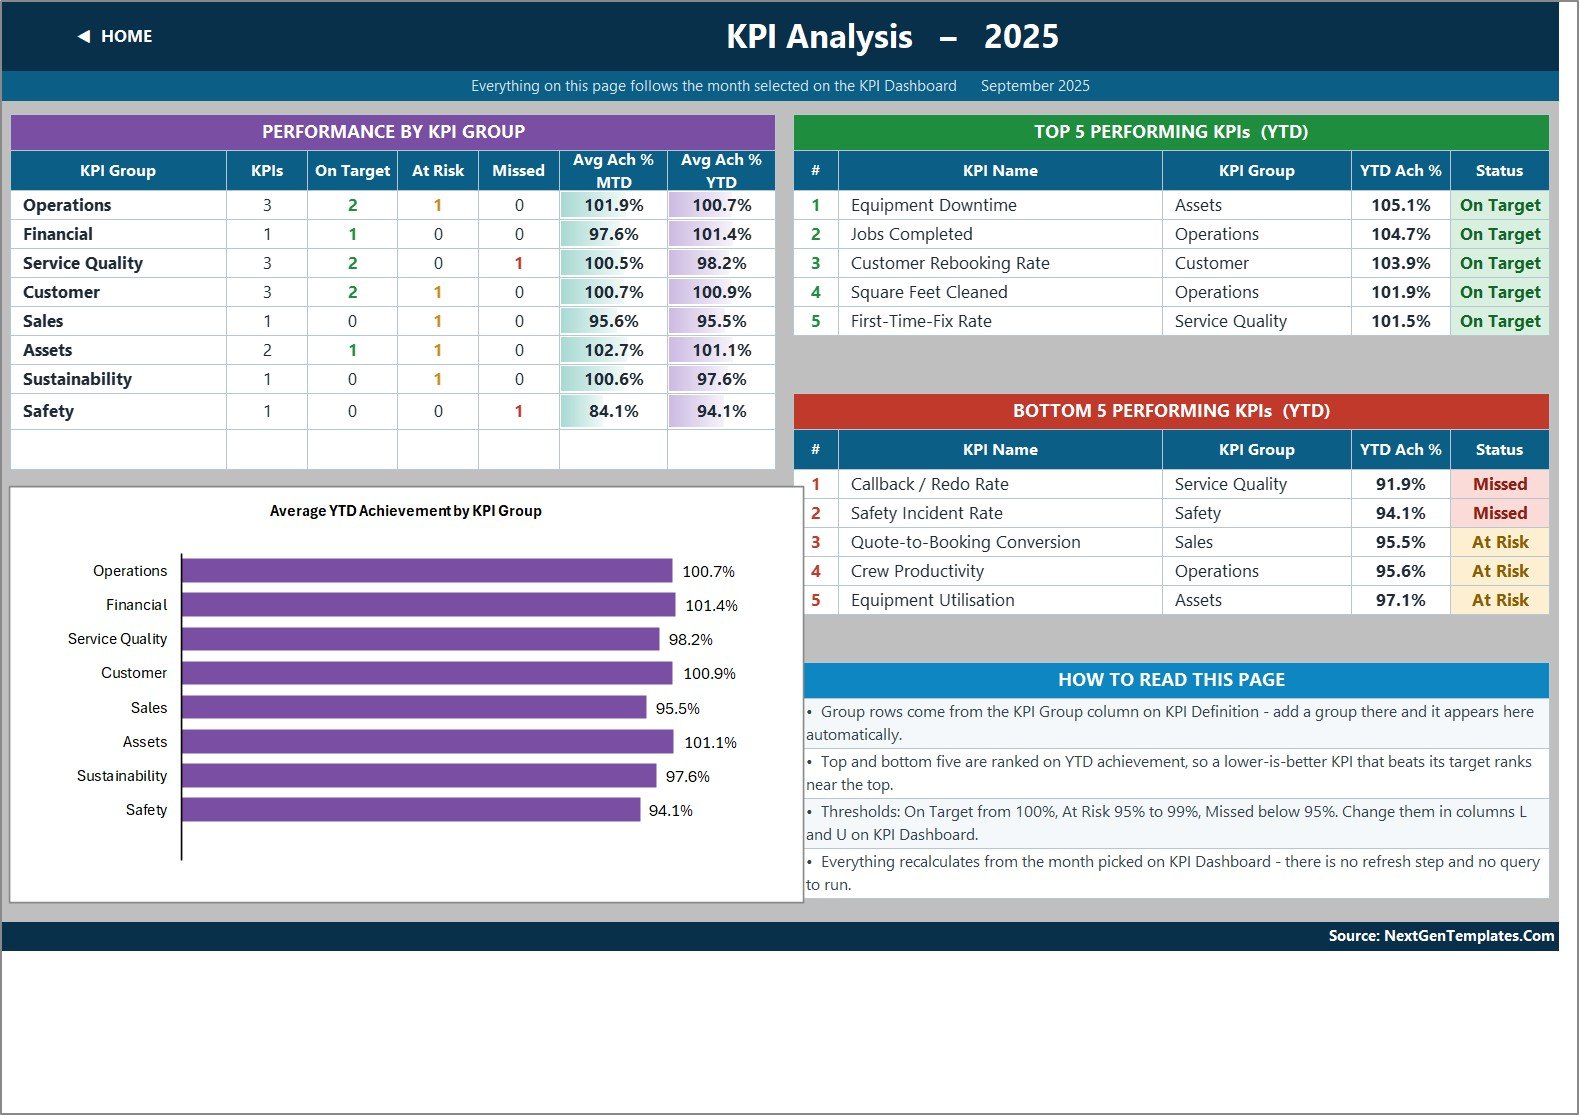
This page follows the month picked on the KPI Dashboard. Performance by KPI Group shows each group’s KPI count, On Target, At Risk and Missed counts, and average MTD and YTD achievement. In the sample, Financial leads at 101.4% YTD and Safety trails at 94.1%. The Average YTD Achievement by KPI Group chart shows the same comparison as bars. Top 5 and Bottom 5 Performing KPIs (YTD) rank the list: Equipment Downtime tops it at 105.1%, and Callback / Redo Rate sits at the bottom at 91.9%.
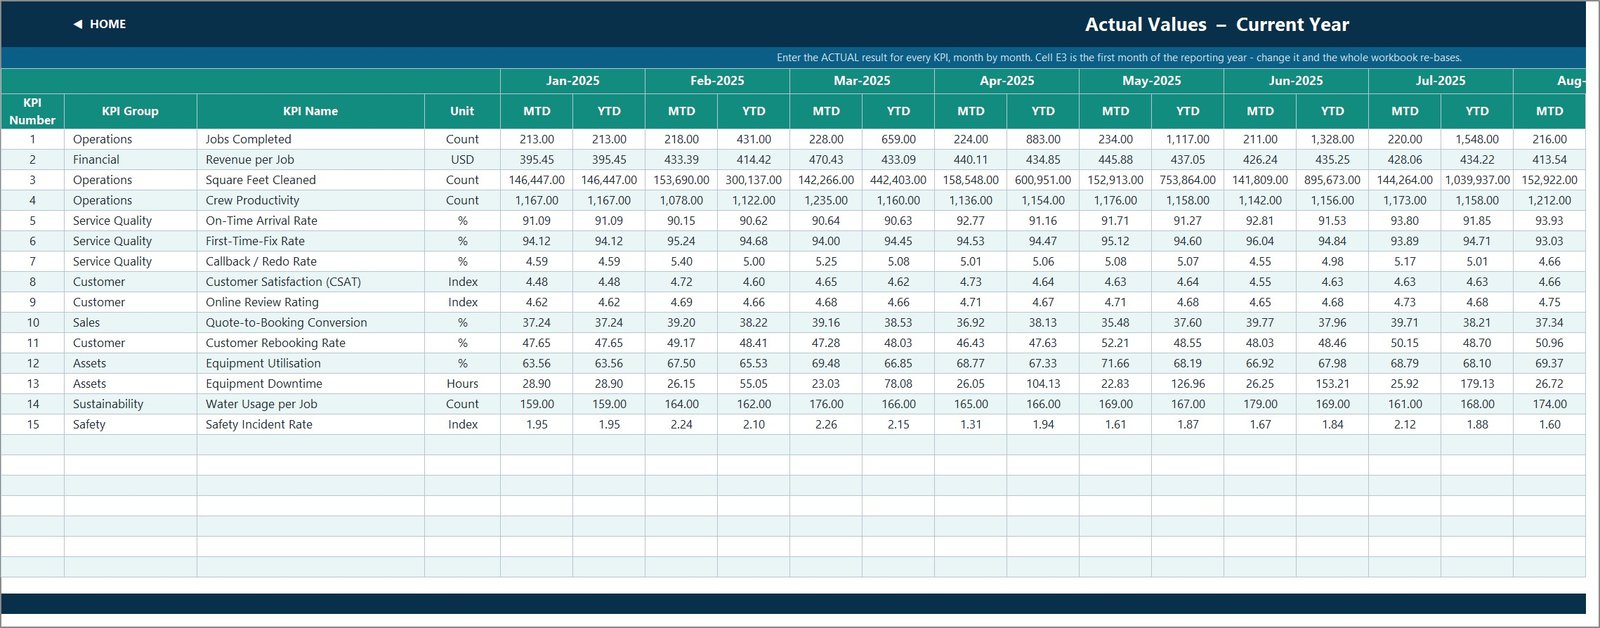
KPI Input – Actual
Enter the actual MTD and YTD result for every KPI, month by month. Cell E3 is the first month of the reporting year. Change it and the month headers, the dropdown and every sheet title re-base.
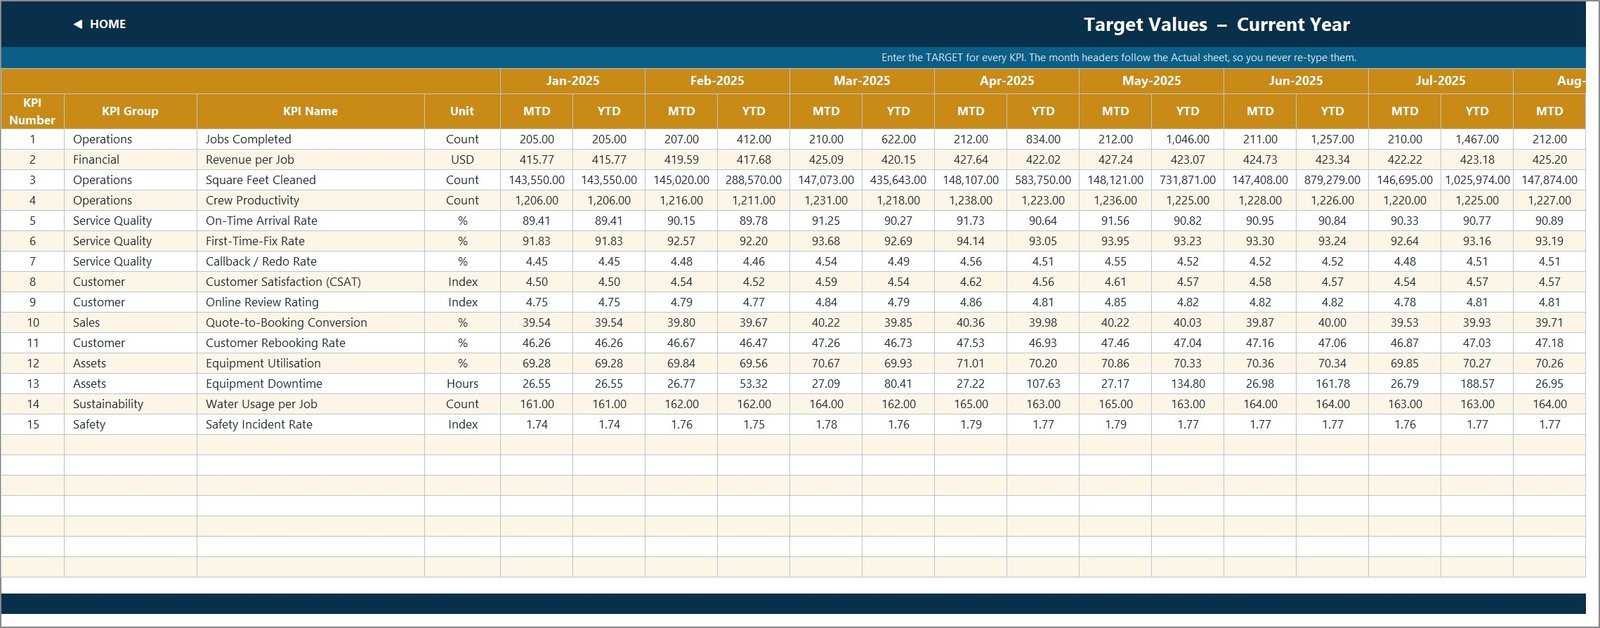
KPI Input – Target
The same grid for targets. Its month headers follow the Actual sheet, so you never retype them.
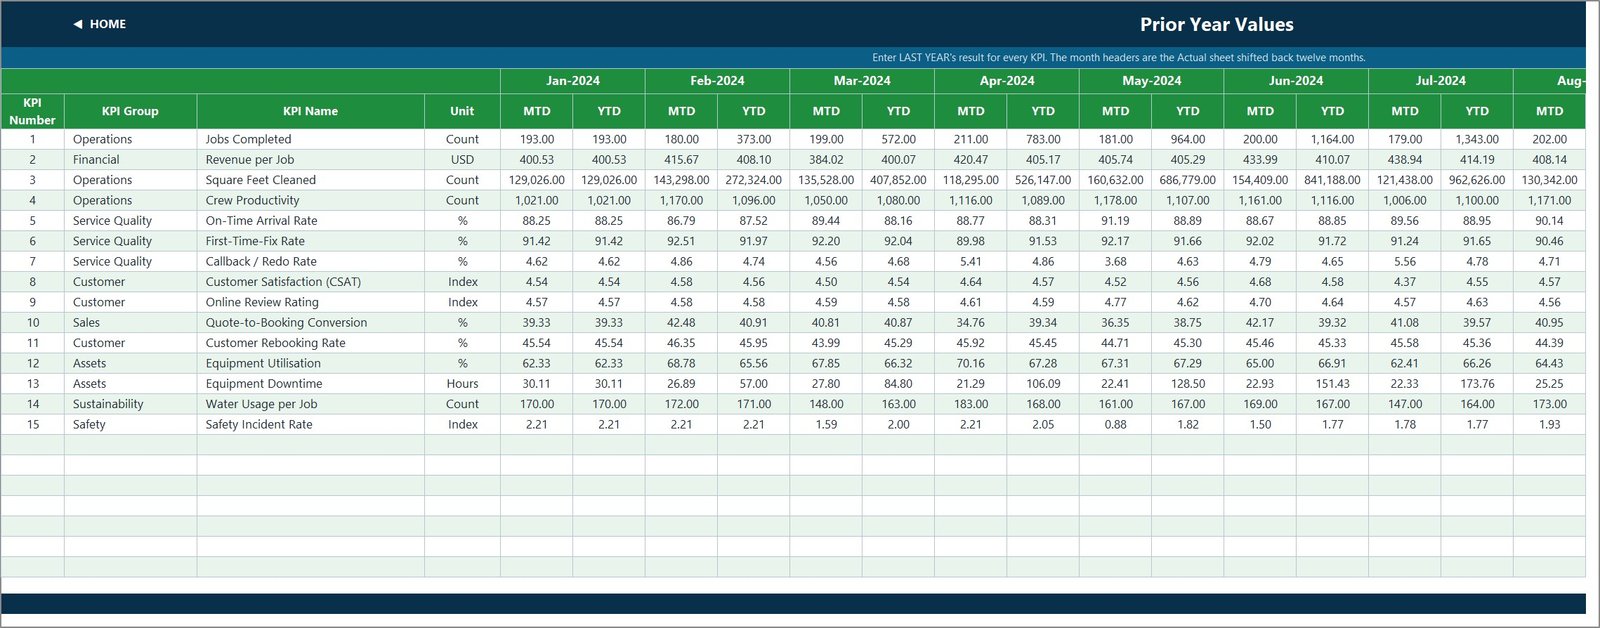
KPI Input – PY
Last year’s results. The headers are the Actual sheet’s months shifted back twelve months, which feeds the Prior Yr and vs PY columns.
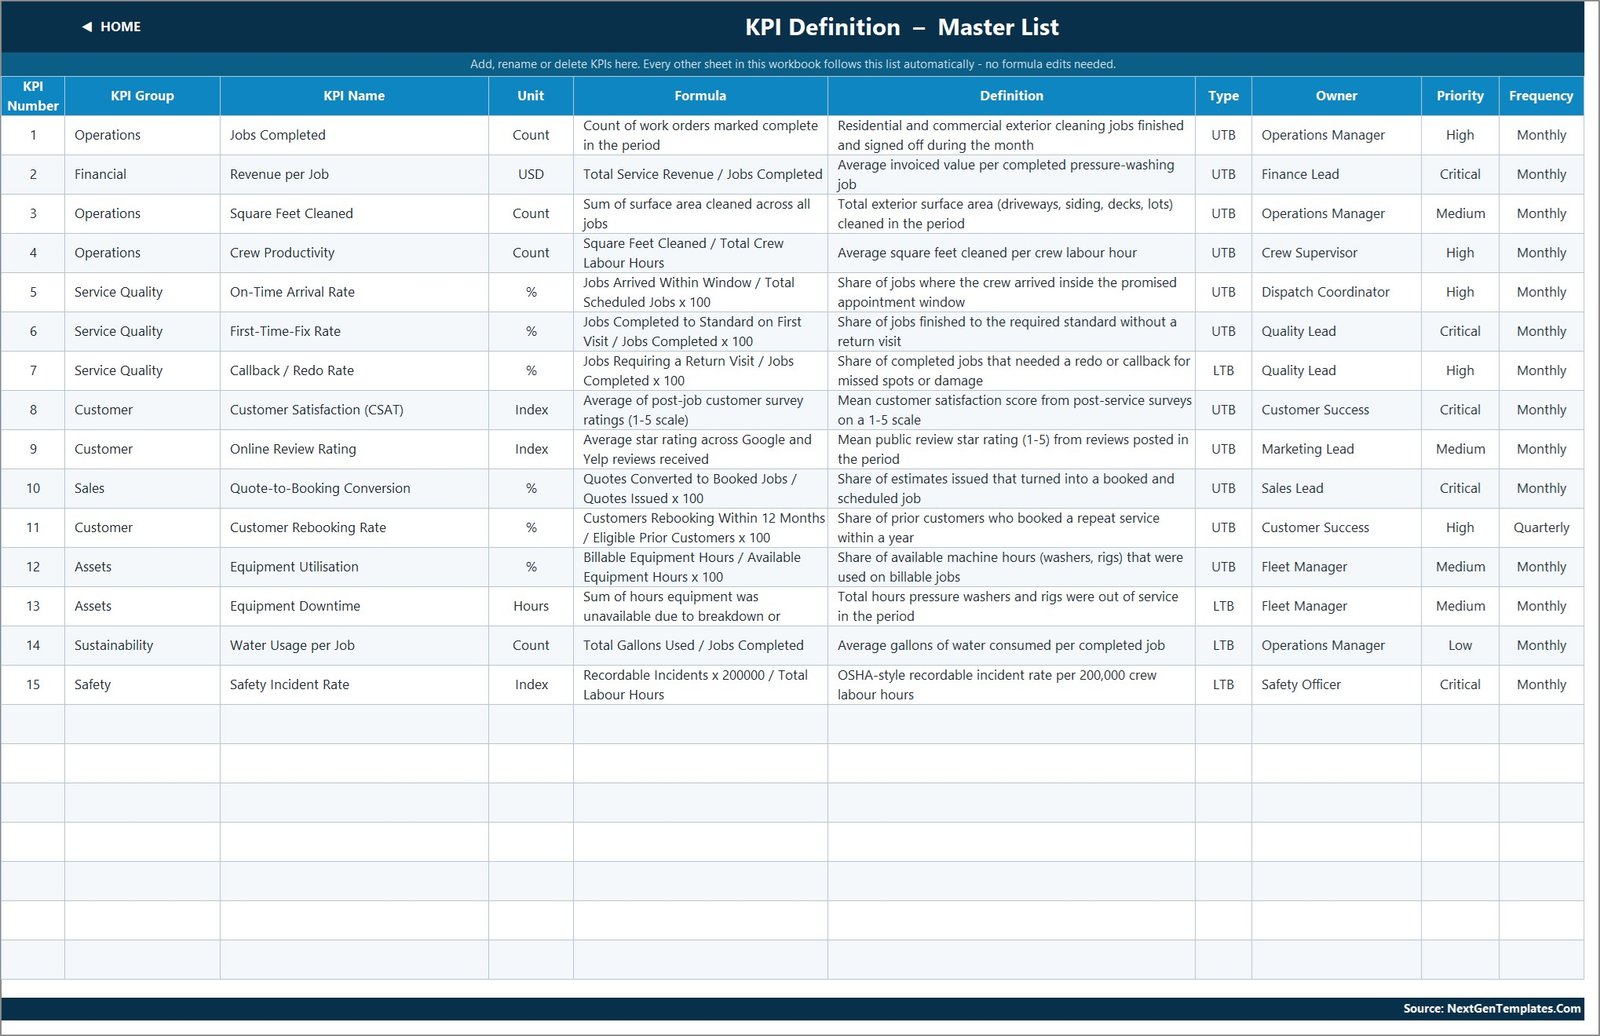
KPI Definition
The master list with number, group, name, unit, formula, definition, UTB/LTB type, owner, priority and frequency. For example, Crew Productivity is Square Feet Cleaned divided by Total Crew Labour Hours, owned by the Crew Supervisor, and Customer Rebooking Rate is reviewed quarterly.
Read Me and Get More Templates
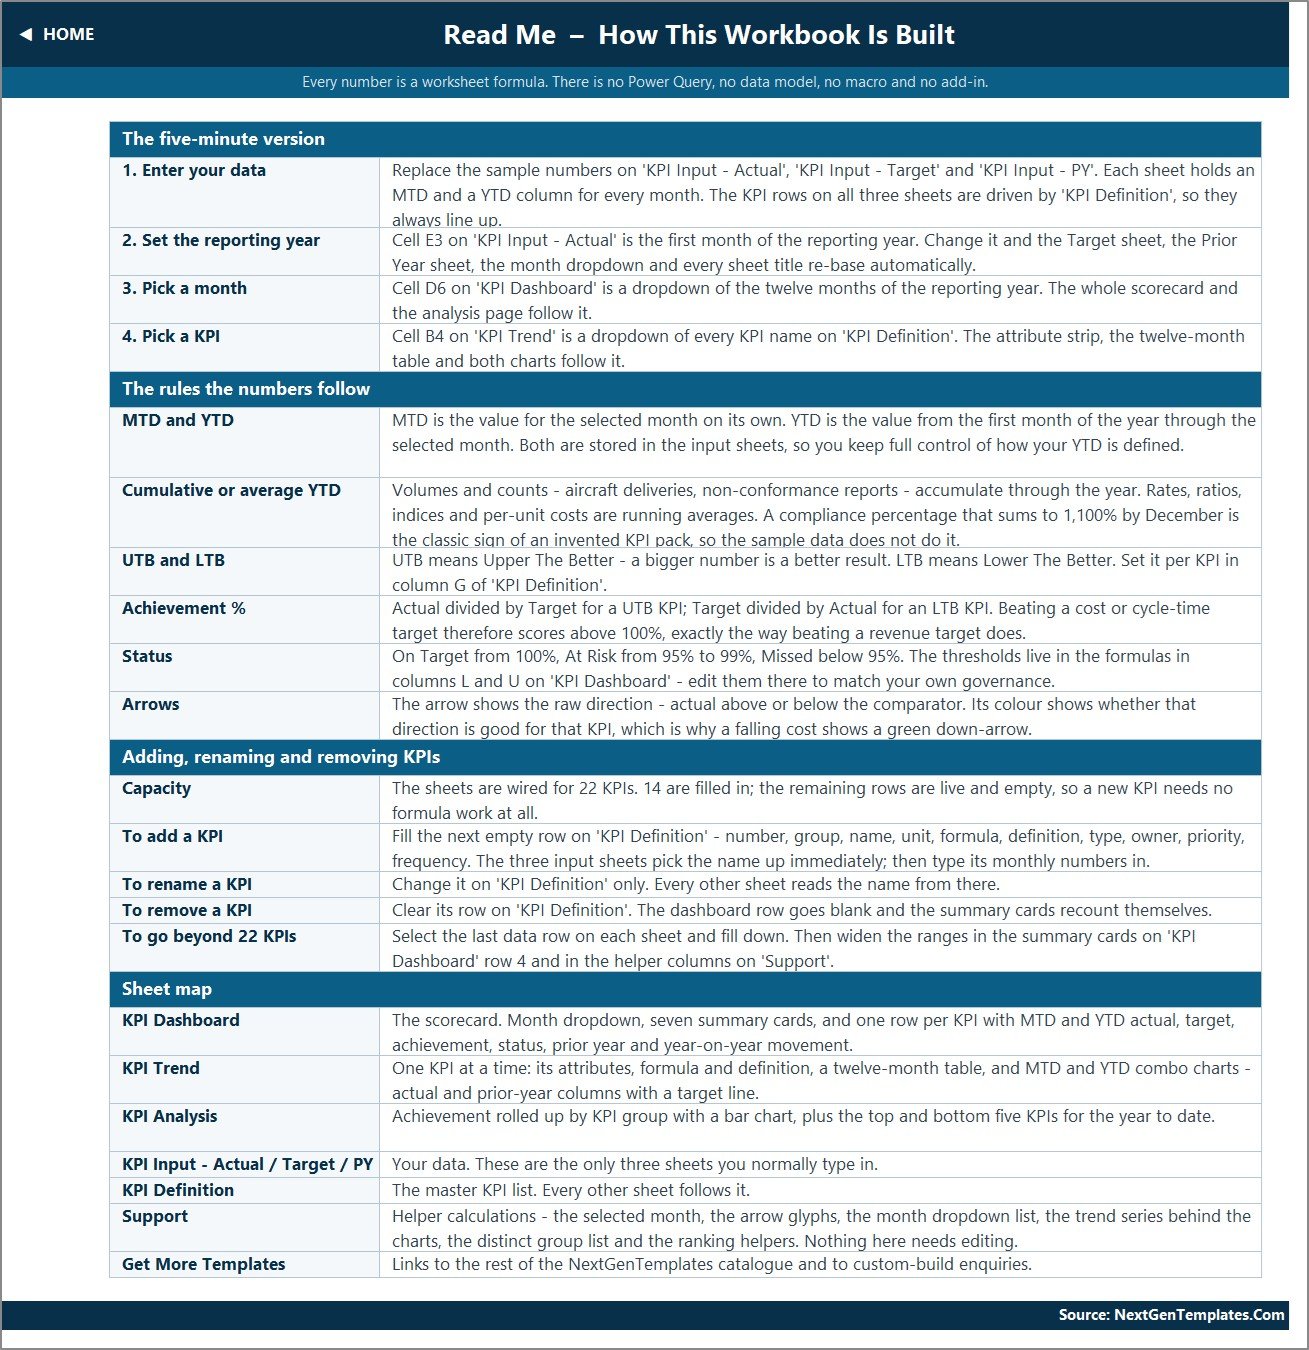
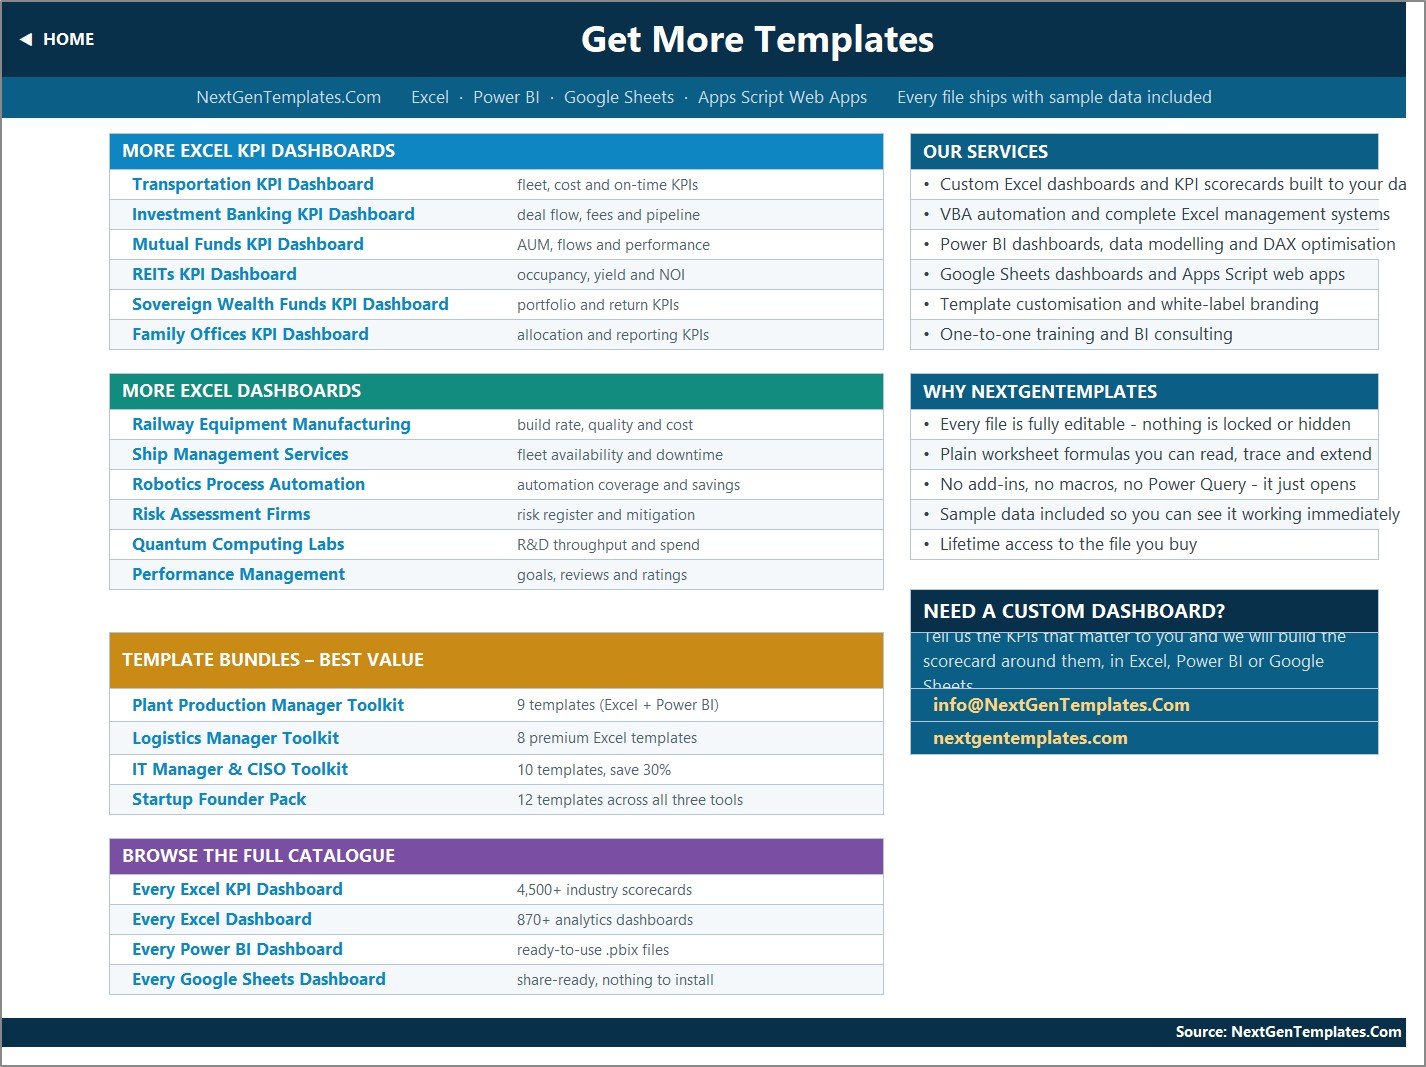
Read Me covers the five-minute setup, the MTD/YTD rules, UTB and LTB, achievement, status, arrows, and how to add, rename or remove KPIs. Get More Templates links to other NGT products.
Excel KPI Dashboard vs. Google Sheets Template vs. Field Service Software: Feature Comparison
| Feature | Pressure Washing KPI Dashboard (Excel) | Google Sheets KPI template | Field service software (Jobber / Housecall Pro) |
|---|---|---|---|
| Cost | One-time purchase | One-time template price | Recurring monthly subscription |
| Platform | Excel 2013+, Excel for the web | Google Sheets | Vendor web and mobile app |
| Setup time | Type monthly figures on three sheets | Similar | Account setup and onboarding |
| Real-time team collaboration | Co-authoring via OneDrive or SharePoint | Native | Native |
| Mobile access | Excel mobile app | Google Sheets app | Vendor app |
| Customisable KPIs | Up to 22, no formula edits | Depends on template | Limited to vendor reports |
| MTD / YTD traffic lights with UTB and LTB | Built in | Depends on template | Rarely |
| Scheduling, quoting, invoicing | No | No | Yes |
| Year-1 cost at 5 users | No per-user fee | No per-user fee | Plan and seat pricing |
For pressure washing owners who want a disciplined monthly KPI review without another subscription, this workbook sits in the sweet spot.
Who Should Use This Template
Perfect for:
- Owners of residential and commercial pressure washing, power washing and soft washing companies
- Operations managers and crew supervisors reporting jobs, square footage, arrival times and crew productivity
- Office managers and sales leads watching quote conversion, rebooking and online review ratings
- Fleet or equipment leads tracking washer and rig utilisation and downtime
Not a fit if:
- You need scheduling, dispatch, route planning, quoting or invoicing
- You need per-job, per-crew or per-site breakdowns rather than company-wide monthly KPIs
- You want a chemical-use log, a stormwater or runoff record, or any compliance evidence
Real-World Use Cases
An owner running three rigs fills in the input sheets on the first Monday of the month. The scorecard shows Jobs Completed On Target but Revenue per Job At Risk at 97.6%, which points to discounting or too many small jobs rather than a shortage of work.
An operations manager selects Callback / Redo Rate on the KPI Trend page. It is the lowest YTD performer at 91.9%, and the twelve-month table shows whether redos are a seasonal spike or a steady problem before crews are retrained.
A sales lead compares Quote-to-Booking Conversion (95.5% YTD, At Risk) with Customer Rebooking Rate (103.9%, On Target) to decide whether the next marketing dollar should chase new leads or past customers.
Advantages of This Pressure Washing KPI Dashboard
- One review, one file. Operations, revenue, quality, customer, sales, equipment, water and safety KPIs share the same month, thresholds and layout.
- Fair scoring for lower-the-better KPIs. Callbacks, downtime, water per job and incident rate are inverted automatically, so a good month looks like a good month.
- Prior-year context everywhere. Every KPI carries last year’s value and a vs PY percentage, for both MTD and YTD, which matters in a seasonal trade.
- Easy to audit. Plain formulas you can trace, with no hidden model, query or macro.
- One-time cost. No subscription and no per-user fee.
Opportunities for Improvement
- Stale KPI count in the text. The Home page (“every one of the 14 KPIs”) and the Read Me (“14 are filled in”) still say 14, but the workbook ships with 15. The calculations are correct; only the wording is out of date.
- Leftover example in the Read Me. The Cumulative or average YTD note uses “aircraft deliveries, non-conformance reports” as examples, carried over from another industry’s template. Edit that cell to pressure washing examples such as jobs completed and square feet cleaned.
- Two unit labels. Crew Productivity (square feet per labour hour) and Water Usage per Job (gallons) are labelled Count on KPI Definition. Relabel them if your team reads the Unit column.
- Manual data entry. MTD and YTD values are typed on the input sheets, and nothing connects to scheduling, accounting or review platforms.
- YTD is not derived. You store YTD yourself, which gives control over sums versus averages but means both columns need filling.
- No compliance function. Water Usage per Job and Safety Incident Rate are numbers you enter. The workbook does not record chemicals, runoff, permits or injuries, and it is not evidence of EPA, stormwater, OSHA or any other compliance.
Best Practices
- Agree each KPI’s formula and owner on KPI Definition before entering data, so the monthly numbers mean the same thing every time.
- Decide per KPI whether YTD is a running sum (jobs, square feet, downtime hours) or a running average (rates, ratings, revenue per job), and keep it consistent.
- Set seasonal targets month by month. Exterior cleaning is busy in spring and summer, so one flat target turns the winter months red.
- Enter prior-year data for all twelve months so the vs PY arrows stay meaningful.
- Review the Bottom 5 table first each month, then use KPI Trend to check whether a miss is a one-off or a trend.
- Learn how the month list is built with Microsoft’s guide to the EDATE function and to creating a drop-down list.
Explore Relevant Templates
- Cleaning Services KPI Dashboard in Excel: the same month-picker scorecard for general cleaning companies.
- Swimming Pool Service KPI Dashboard in Excel: KPIs for another route-based home service.
- Pest Control Business KPI Dashboard in Excel: technician, callback and customer KPIs.
- Cleaning Services Dashboard in Excel: an analytical dashboard for cleaning revenue and jobs.
- Office Cleaning Request Tracker in Excel: log and follow up cleaning requests.
More from this blog: the Swimming Pool Service KPI Dashboard in Excel, the Pest Control Business KPI Dashboard in Excel, the Septic Tank Service KPI Dashboard in Excel, the Window and Door Installation KPI Dashboard in Excel and the Locksmith Business KPI Dashboard in Excel.
Frequently Asked Questions
What KPIs are in this pressure washing KPI dashboard?
It ships with 15 KPIs in eight groups: Operations (3), Financial (1), Service Quality (3), Customer (3), Sales (1), Assets (2), Sustainability (1) and Safety (1). They include Jobs Completed, Revenue per Job, First-Time-Fix Rate, Customer Rebooking Rate, Equipment Downtime and Water Usage per Job. You can edit them or add more, up to 22.
How do I track pressure washing KPIs in Excel with this template?
Type monthly MTD and YTD actuals, targets and prior-year values on the three input sheets, then pick a month in cell D6 on the KPI Dashboard. The scorecard, traffic lights, summary cards and group analysis all recalculate from that one choice.
Is this the KPI Dashboard or the KPI Scorecard edition?
This is the KPI Dashboard edition: a month-picker scorecard for 15 KPIs with KPI Trend and KPI Analysis pages. NextGenTemplates also offers a separate Pressure Washing Services KPI Scorecard, which is a different workbook with its own layout.
Does it need macros or Power Query?
No. It is a plain .xlsx built from worksheet formulas such as VLOOKUP, INDEX, MATCH and COUNTIF. There are no macros, Power Query, Power Pivot or add-ins, and it opens in Excel 2013 and later and in Excel for the web.
How long does setup take?
If your monthly figures already exist, setup is mostly typing them into the Actual, Target and PY sheets and setting the first month in cell E3. The dashboard pages need no configuration, because they read the KPI list and month headers automatically.
Does it track EPA, stormwater or chemical-safety compliance?
No. Water Usage per Job and Safety Incident Rate are values you type in. The workbook does not log detergents, runoff capture, permits or injuries, and it is not evidence of environmental, OSHA or any other regulatory compliance.
How does it compare with field service software?
Platforms such as Jobber or Housecall Pro run scheduling, quotes and invoices on a subscription. This Excel KPI dashboard does one job, the monthly KPI review with targets, prior year and traffic lights, for a one-time price with no per-user fees.
About the Author
Built by PK, a Microsoft Certified Professional with 15+ years of Excel, Google Sheets and Power BI experience and the founder of NextGenTemplates, whose YouTube channels reach 300K+ subscribers. Every template is hand-built and tested before release.
Conclusion
This workbook gives a pressure washing business one monthly view of jobs, revenue per job, arrival times, redos, reviews, conversion, equipment, water use and safety. MTD, YTD and prior-year comparisons, plus trend and group analysis, all run from a single month dropdown. It is honest about its limits: data is typed in, KPIs are company-wide, and it is not a compliance record.
Click here to Purchase the Pressure Washing Services KPI Dashboard in Excel
Instant download · One-time payment · No subscription
Last updated: September 2026
Watch step-by-step tutorials on Youtube.com/@PKAnExcelExpert