Ask the owner of an excavation company how last month went and you usually get a story. Two big site-prep jobs finished early, the long-reach excavator spent a week in the workshop, a general contractor still has not paid, and there was another damaged line on a residential dig. All of it is true, and none of it tells you whether the month was better or worse than the one before.
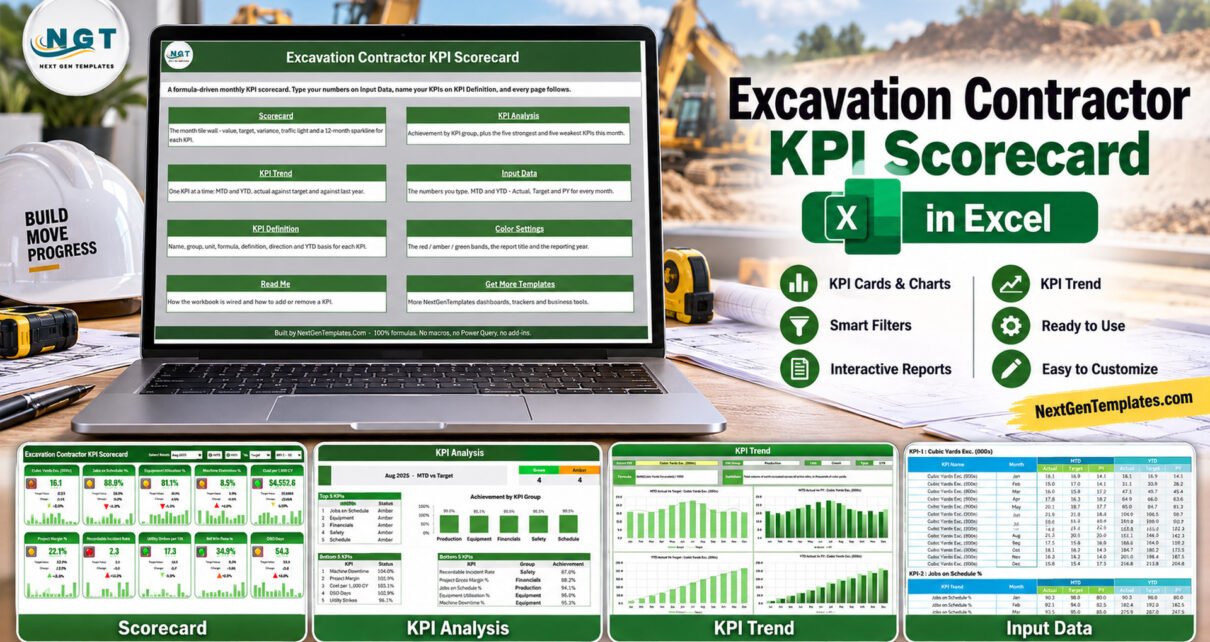
The Excavation Contractor KPI Scorecard in Excel turns those stories into numbers you can compare: 10 excavation KPIs in 5 groups, laid out as tiles with traffic lights and a 12-month sparkline, across 9 visible sheets. It arrives loaded with a full 2025 sample year, and on Aug-2025 it reads 4 Green, 4 Amber and 2 Red. This article walks through what is on each sheet, how the lights decide, and how to load your own figures.
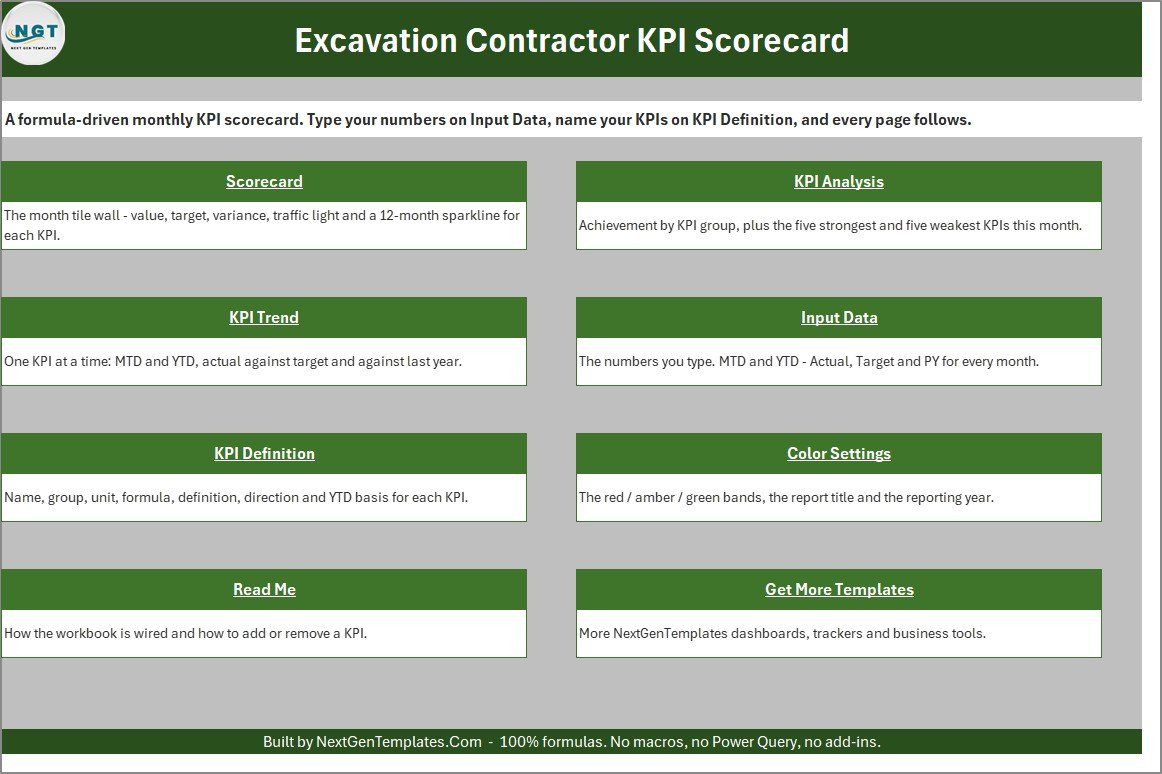
A quick word on naming, because NextGenTemplates sells several products with similar titles. This is the KPI Scorecard family – a tile-based monthly management report driven by numbers you type. The separate Excavation Contractor KPI Dashboard in Excel belongs to the KPI Dashboard family, with a larger 15-KPI set, a table-style dashboard page and ten sheets. If you run a neighbouring trade, the Concrete Contractor KPI Scorecard in Excel uses the same engine as this one.
Key Features of the Excavation Contractor KPI Scorecard in Excel
- Ten excavation-specific KPIs. Cubic Yards Excavated (000s), Jobs on Schedule %, Equipment Utilisation %, Machine Downtime %, Cost per 1,000 CY, Project Gross Margin %, Recordable Incident Rate, Utility Strikes per 10k, Bid Win Rate % and DSO Days.
- A header you drive from dropdowns. Select Month, an MTD / YTD switch, a Vs. selector (Target, PY or Prior Month) and a KPI set picker for KPI 1-10 or KPI 11-20.
- Traffic lights that respect direction. Five KPIs are upper-the-better and five are lower-the-better, so a falling cost per yard, downtime figure or collection period turns green.
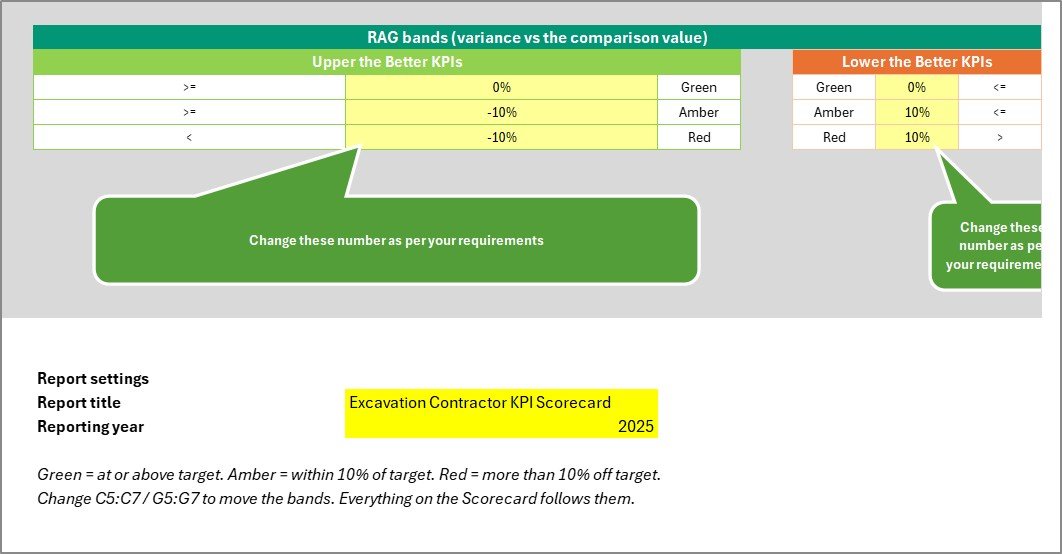
- Editable thresholds. The RAG bands live in ordinary cells on Color Settings. Amber defaults to within 10% of the comparison value.
- Analysis and trend pages. KPI Analysis ranks the Top 5 and Bottom 5 KPIs and rolls achievement up by group; KPI Trend charts one KPI by month against target and prior year.
- No macros at all. Formulas, conditional formatting, camera pictures and sparklines only, in a plain .xlsx that opens in Excel 2016 or later.
The Ten Excavation KPIs, and Why These Ten
The KPI set covers the five things that decide whether an earthmoving business makes money: how much dirt it moves and on time, how hard the fleet works, what each yard costs and earns, how cleanly crews dig, and whether the firm wins work and gets paid.
| Group | KPI | What it measures | Direction |
|---|---|---|---|
| Production | Cubic Yards Exc. (000s) | Total volume excavated across all active sites, in thousands of cubic yards | Higher is better |
| Production | Jobs on Schedule % | Share of active jobs hitting their contracted milestone dates | Higher is better |
| Equipment | Equipment Utilisation % | Billable machine hours as a share of available machine hours | Higher is better |
| Equipment | Machine Downtime % | Scheduled machine hours lost to unplanned breakdowns and repairs | Lower is better |
| Financials | Cost per 1,000 CY | All-in direct cost to excavate one thousand cubic yards | Lower is better |
| Financials | Project Gross Margin % | Gross margin earned on completed excavation projects | Higher is better |
| Safety | Recordable Incident Rate | Recordable incidents per 200,000 field hours worked | Lower is better |
| Safety | Utility Strikes per 10k | Damaged utility lines per ten thousand located crossings | Lower is better |
| Schedule | Bid Win Rate % | Submitted bids that converted to awarded jobs | Higher is better |
| Schedule | DSO Days | Average days to collect payment after a job is invoiced | Lower is better |
Cost per 1,000 CY and Project Gross Margin are the pair worth reading together. Cost per yard says how efficiently crews and machines are moving material; margin says whether the price on the bid covered it. None of the ten names is fixed – every page looks a KPI up by name, so you can rename any of them on the KPI Definition sheet.
About the two safety tiles. Recordable Incident Rate and Utility Strikes per 10k display figures you type from your own records. The workbook does not log incidents, manage utility locates, check trench or permit requirements, or report to any regulator, and it makes no safety or compliance claim.
How the Traffic Lights Decide Green, Amber and Red
Home-made scorecards often paint every increase green, which is wrong for half the measures an excavation firm cares about. Here each KPI carries a type:
- Upper-the-better (UTB): at or above the comparison value is green, up to 10% below is amber, more than 10% below is red.
- Lower-the-better (LTB): at or below the comparison value is green, up to 10% above is amber, more than 10% above is red.
A KPI with a blank or zero comparison value reads n/a rather than guessing. Change the percentages on Color Settings and every light, arrow and status label follows.
Workbook Sheets Explained
Scorecard
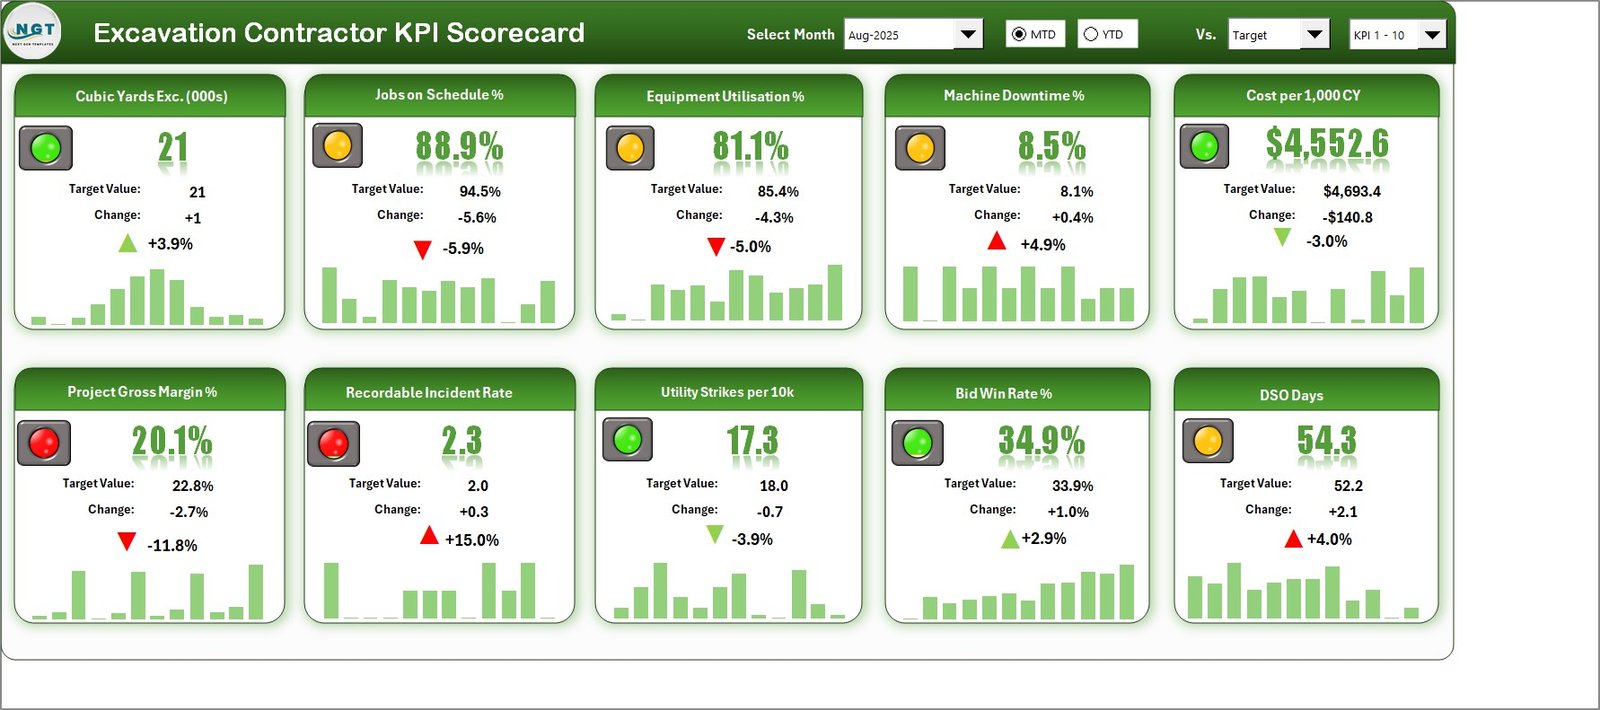
The tile wall. Each of the ten tiles shows the traffic light, the headline value, the target or comparison value, the change and a 12-month sparkline, with the month and comparison controls across the header.
KPI Analysis
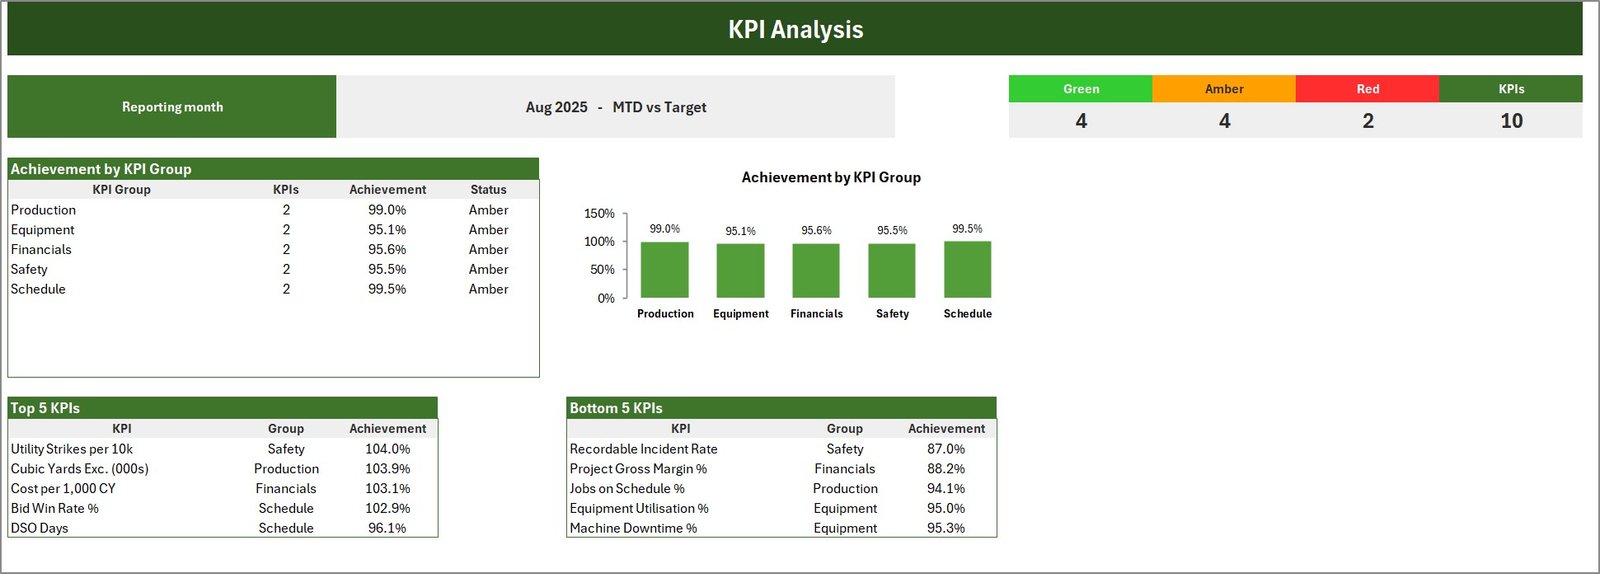
The reporting month and basis, a Green / Amber / Red / KPIs counter strip, Achievement by KPI Group as a table and a chart, and Top 5 and Bottom 5 KPI tables ranked by achievement.
KPI Trend
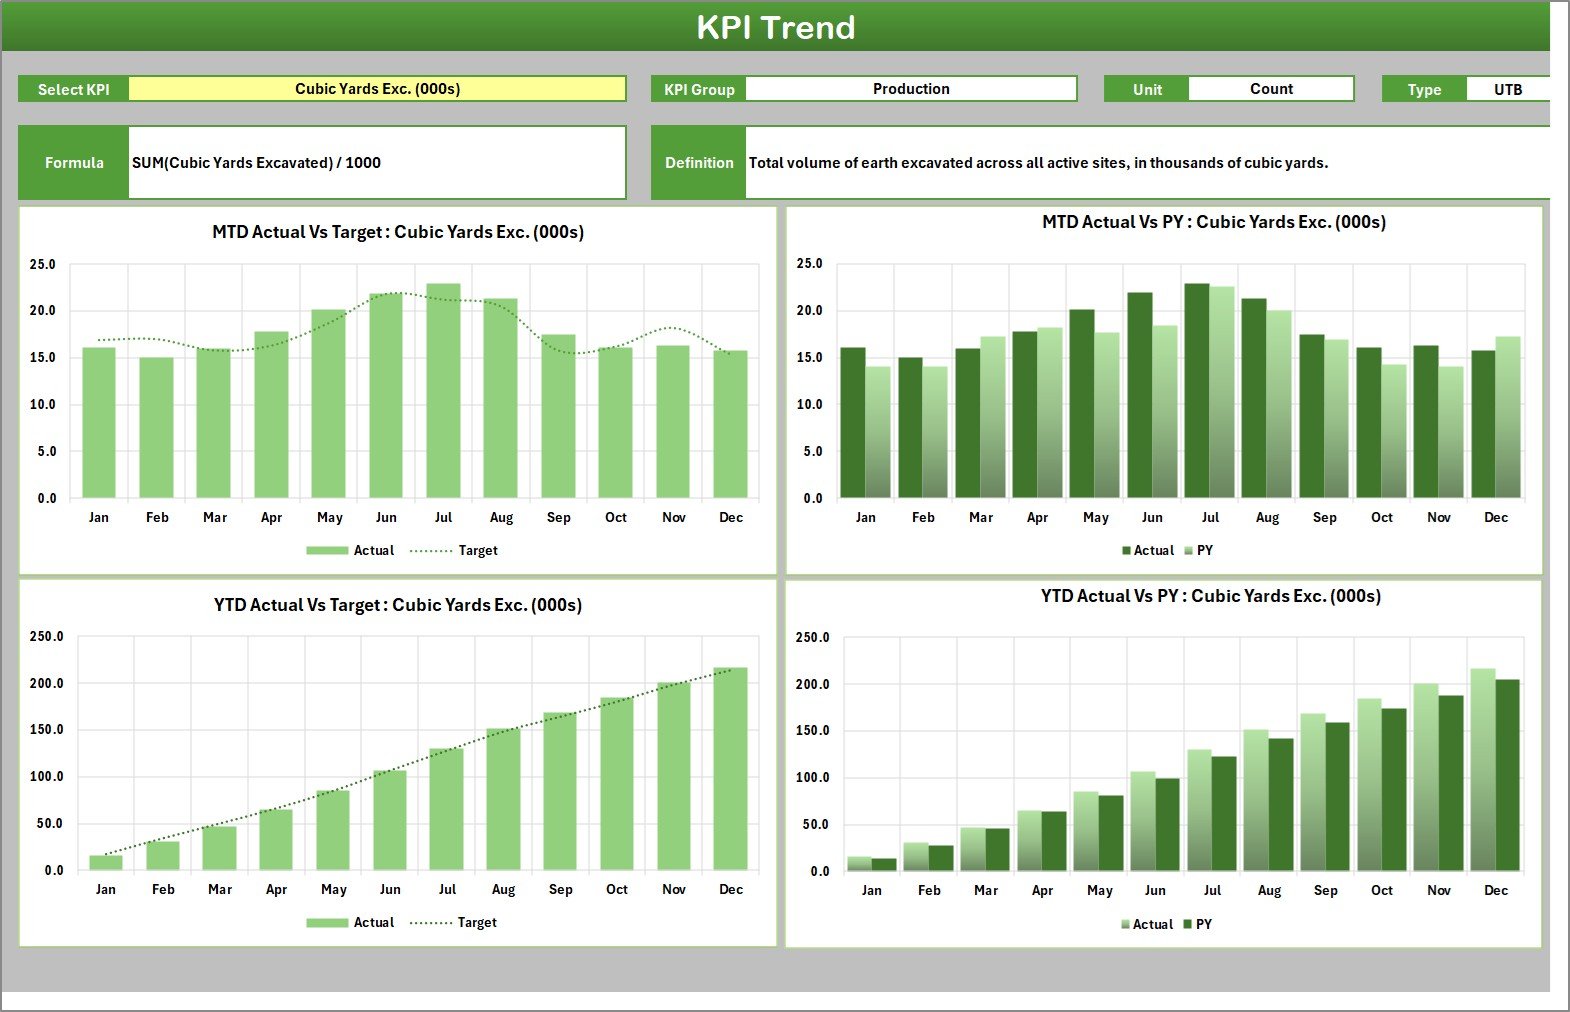
Select a KPI and the page prints its group, unit, type, formula and definition, then charts MTD Actual vs Target, MTD Actual vs PY, YTD Actual vs Target and YTD Actual vs PY month by month.
Input Data
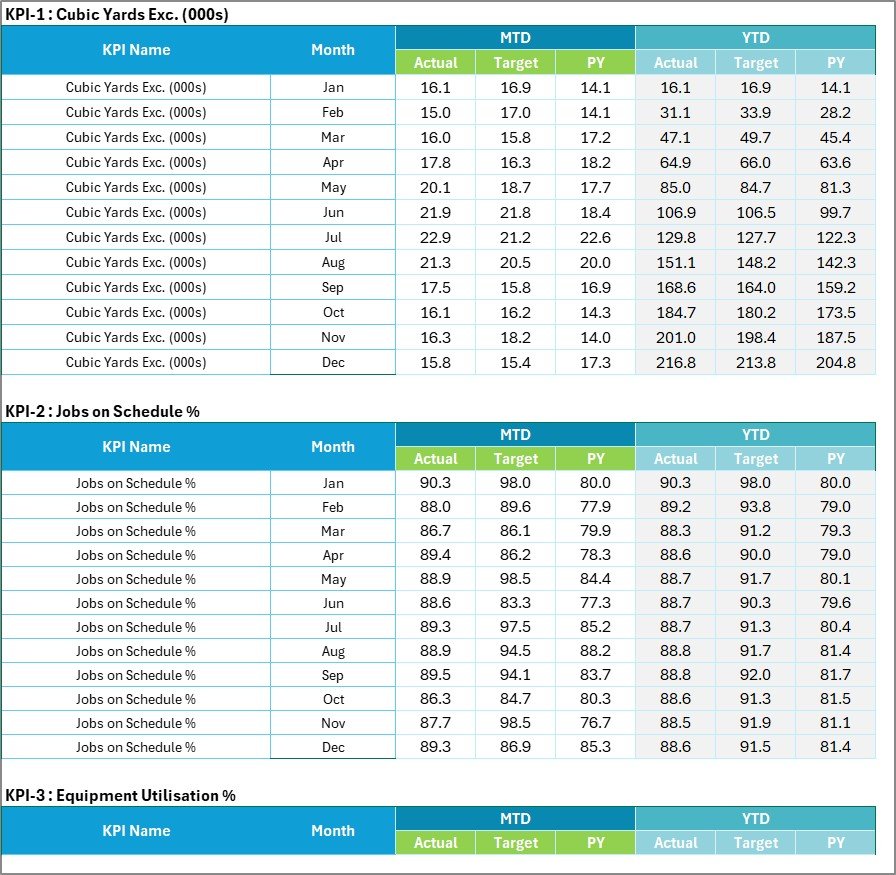
The only sheet with numbers. One block per KPI, twelve rows per block, six columns: MTD Actual, Target and PY, then YTD Actual, Target and PY.
KPI Definition
Group, name, unit, formula, definition, UTB / LTB type and YTD basis for each KPI, with a Check column that turns red on a duplicate name.

Color Settings
The upper-the-better and lower-the-better RAG bands, the report title and the reporting year.
Read Me
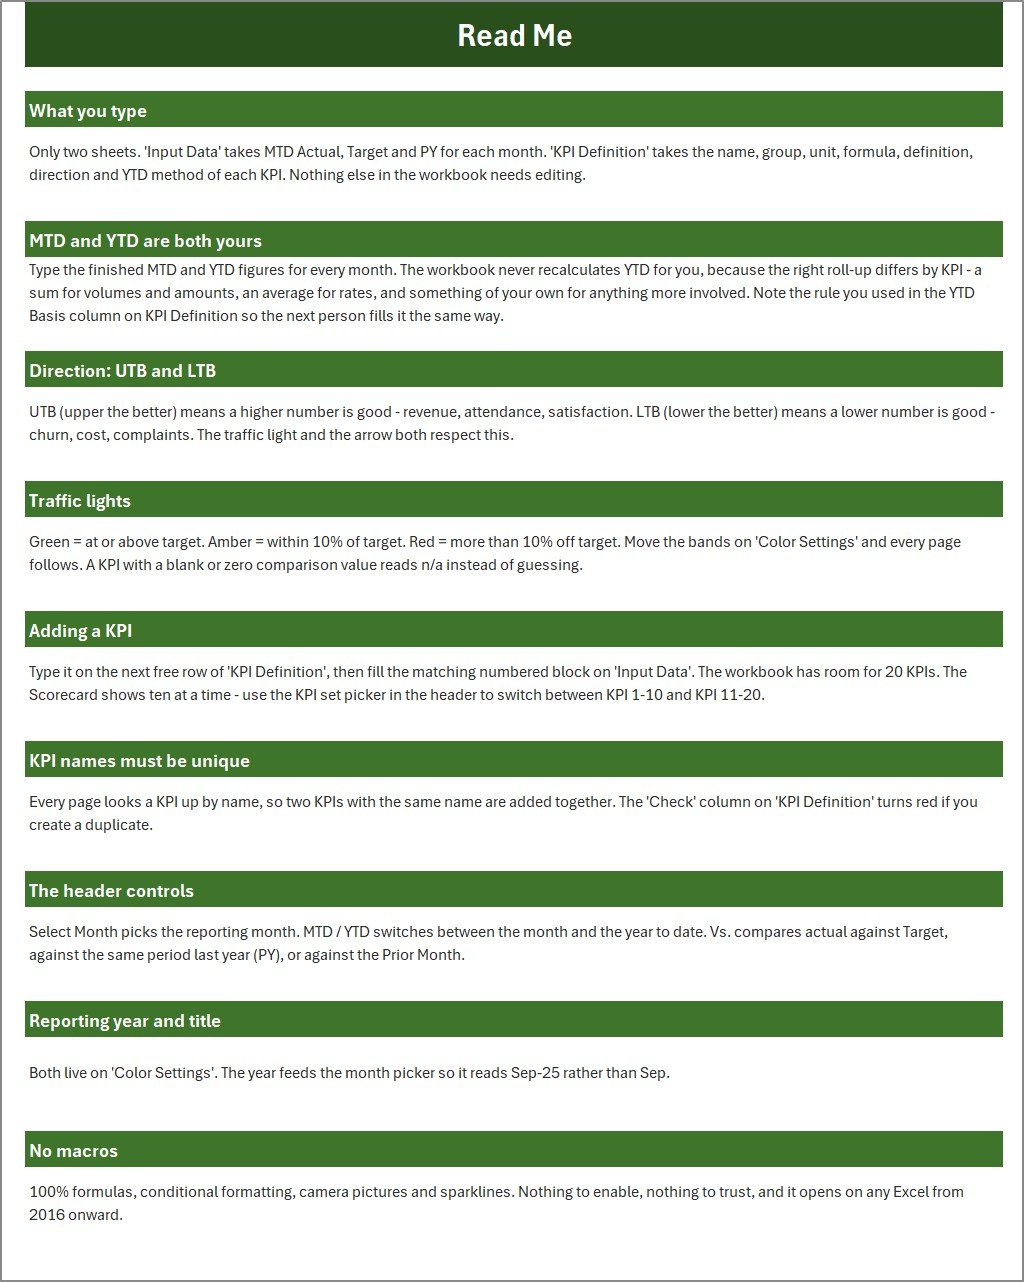
Nine short sections on what to type, how MTD and YTD work, direction, traffic lights, adding a KPI, unique names, the header controls, the reporting year and why there are no macros.
Get More Templates
A short directory of the other NextGenTemplates product lines, with a contact line for customisation.
Reading the Aug-2025 Sample Month
Open the Excavation Contractor KPI Scorecard in Excel on Aug-2025, MTD, Vs. Target, and the story of the month is visible in seconds.
Production is fine. Cubic Yards Excavated is green at 21.3 thousand against 20.5, and Cost per 1,000 CY is green at $4,552.6 against a $4,693.4 target – crews are moving more material for less than planned. Yet Project Gross Margin is red at 20.1% against 22.8%, down 11.8%. Cheap yards and thin margin together point at pricing on the bids rather than site efficiency, and a green Bid Win Rate of 34.9% against 33.9% fits that reading.
The second red is Recordable Incident Rate at 2.3 against 2.0, 15.0% worse on a lower-the-better KPI, while Utility Strikes per 10k is green at 17.3 against 18.0. The ambers are the fleet and the cash: Equipment Utilisation 81.1% against 85.4%, Machine Downtime 8.5% against an 8.1% ceiling, Jobs on Schedule 88.9% against 94.5%, and DSO at 54.3 days against 52.2.
KPI Analysis rolls that up: every group is amber, from Equipment at 95.1% to Schedule at 99.5%. Its Bottom 5 table – Recordable Incident Rate, Project Gross Margin, Jobs on Schedule, Equipment Utilisation and Machine Downtime – is effectively the agenda for the month-end meeting.
Excel KPI Scorecard vs. Google Sheets vs. Construction Software – Feature Comparison
| Feature | This Excel KPI scorecard | A Google Sheets scorecard | Construction management SaaS |
|---|---|---|---|
| Cost | $9.99 one-time (sale price) | One-time template price | Recurring monthly subscription |
| Platform | Excel 2016 or later, Microsoft 365 | Web browser | Vendor web app |
| Setup time | Minutes | Minutes | Onboarding and integration |
| Works offline | Yes | No | No |
| Real-time collaboration | No – share the file | Yes | Yes |
| Pulls numbers automatically | No | No | Yes, once connected |
| Change a KPI or threshold | Type over a cell | Type over a cell | Admin settings or vendor support |
| Year-1 cost at 5 users | One purchase | One purchase | Twelve months of fees |
| One-page monthly report | Ready on day one | Ready on day one | Often needs a custom report |
For excavation owners who want a board-ready monthly page without paying for a platform, an Excel KPI scorecard sits in the sweet spot.
Who Should Use This Template
Perfect for:
- Excavation, site preparation, trenching and earthmoving contractors.
- Operations managers and superintendents who present a monthly number to owners or lenders.
- Bookkeepers and consultants who produce a monthly pack for civil and site-works clients.
Not a fit if:
- You need job-level cost tracking, telematics or per-machine hours.
- You want estimating, dispatch, timesheets or invoicing managed – look at a job management system instead.
- You need an incident log, locate-ticket register or permit tracker – this is a performance report only.
Real-World Use Cases
A 30-machine site-works contractor. The operations manager prints the Scorecard and KPI Analysis for the monthly owners’ meeting. When Equipment Utilisation lags while Machine Downtime climbs, the discussion moves to the workshop and preventive maintenance before anyone talks about selling machines.
A residential excavation firm that prices its own bids. The owner switches Vs. to PY and watches Bid Win Rate and Project Gross Margin side by side. A rising win rate with a falling margin is a sign of jobs won on price.
A consultant with civil clients. One workbook per client, the same ten tiles every month, and the KPI Trend page to show whether a slow first quarter was frozen ground or lost bids.
Advantages of an Excel KPI Scorecard for Excavation Contractors
- One purchase, no subscription. The whole scorecard costs less than a single month of most construction software seats.
- Your data stays on your machine. Nothing is uploaded, and the file works on a site-office laptop with no connection.
- Consistent month-to-month shape. The same ten tiles in the same order make a bad month stand out.
- Nothing to maintain. No macros, no queries and no add-ins means nothing to break after an Office update.
Opportunities for Improvement
- YTD is typed, not calculated. The Read Me explains why – the right roll-up differs by KPI – but it is still one more column to fill each month.
- No data connection. Figures come from your job costing, fleet and accounts reports by hand.
- One business per workbook. There is no job, crew or region filter; multi-branch contractors need a copy per branch.
- Some sample labels are loose. Cubic Yards Exc. (000s) carries the unit “Count”, its tile rounds to a whole number (21 against 21 while Input Data holds 21.3 against 20.5), and Bid Win Rate and DSO Days sit in a group called Schedule. All three are plain cells on KPI Definition, so relabel them to suit.
- Ten tiles at a time. KPIs 11-20 sit behind the set picker rather than on the same screen.
Best Practices
- Agree the definition of each KPI before the first month, and write it on KPI Definition so everyone fills it the same way.
- Set realistic targets from last year’s actuals rather than wishful ones, or every light goes red.
- Record the YTD method in the YTD Basis column – sum for cubic yards, average for rates and percentages.
- Update on a fixed day each month so the sparklines compare like with like.
- Read Cost per 1,000 CY and Project Gross Margin together before changing your bid rates.
Microsoft’s Excel help and learning site is a good reference if you want to extend the workbook’s formulas.
Explore Relevant Templates
- Masonry Contractor KPI Scorecard in Excel and Paving Contractor KPI Scorecard in Excel – the same scorecard engine for other trades.
- Construction Safety KPI Scorecard in Excel – a scorecard centred on safety performance measures.
- Tunnel Engineering KPI Dashboard in Excel – KPI reporting for underground civil works.
- Civil Contractor Job Management System Web App and the Heavy Machinery Dashboard in Google Sheets on NextGenTemplates.
Frequently Asked Questions
Does it connect to my job costing or fleet system?
No. You type the monthly figures on Input Data. That keeps the file portable and offline, and a month’s update for ten KPIs takes a few minutes once your reports are open.
Do I need to enable macros?
No. The workbook is a plain .xlsx with no VBA. It uses formulas, conditional formatting, camera pictures and sparklines, and opens in Excel 2016 or later and Microsoft 365.
How long does setup take?
Usually under half an hour: set the year and title on Color Settings, keep or rename the ten KPIs, then paste twelve months of MTD and YTD figures into Input Data.
How many KPIs can it hold?
Twenty. The Scorecard displays ten at a time, and the set picker in the header switches between KPI 1-10 and KPI 11-20.
Is it a safety or compliance tool?
No. The safety tiles show numbers you enter from your own records. It does not replace an incident log, a locate process, trench inspections or permit tracking.
What is in the download?
A ZIP holding the Excavation Contractor KPI Scorecard in Excel workbook (.xlsx) and a PDF user manual for the Excel KPI Scorecard line.
About the Author
Built by PK – Microsoft Certified Professional with 15+ years of Excel, Google Sheets and Power BI experience. Founder of NextGenTemplates, reaching 300K+ subscribers across YouTube channels. Every template is hand-built and tested before release.
Conclusion
An excavation business does not need another platform to know how its month went. It needs ten numbers in the same place every month, coloured by whether they are good. That is exactly what the Excavation Contractor KPI Scorecard in Excel delivers, with a full sample year to show you the layout before you type a single figure.
Click here to purchase the Excavation Contractor KPI Scorecard in Excel
Instant download – One-time payment – No subscription
Last updated: September 2026
For video tutorials visit Youtube.com/@PKAnExcelExpert