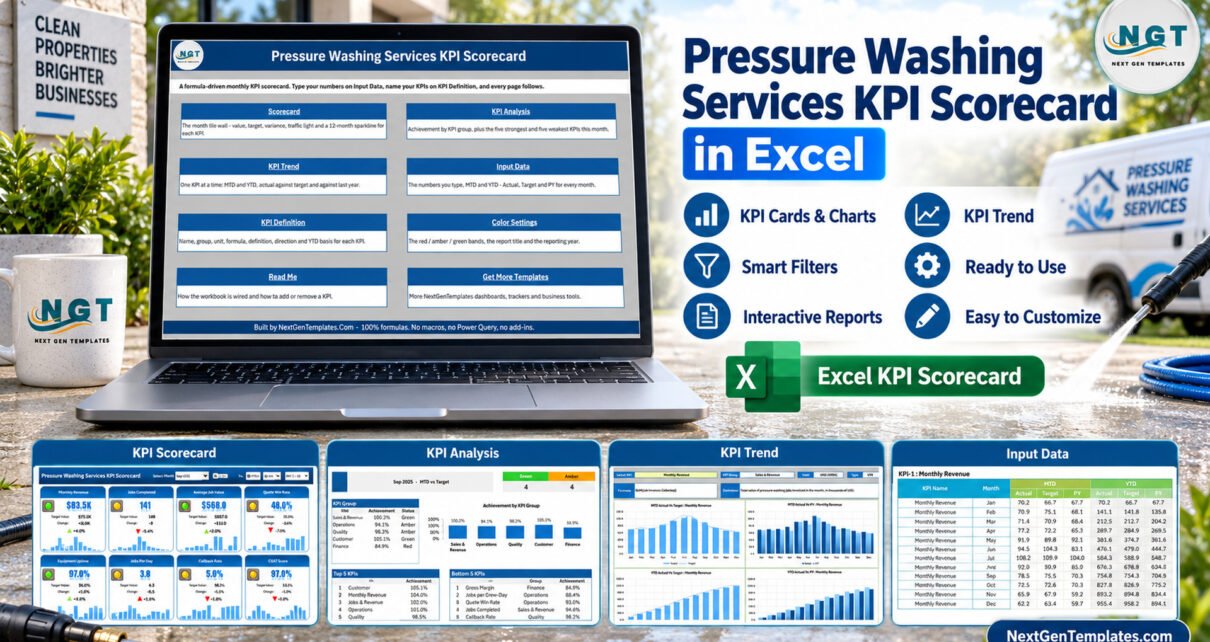
The Pressure Washing Services KPI Scorecard in Excel puts 10 pressure washing KPIs on a single tile-wall page, grouped into Sales & Revenue, Operations, Quality, Customer and Finance. It comes with 9 visible sheets, room for 20 KPI slots, four header controls and a full 2025 sample year. In the September sample, 4 KPIs read green, 4 amber and 2 red, and every number comes from formulas with no macros.
Pressure washing and exterior cleaning businesses often collect performance numbers in several places: invoices, completed jobs, quotes sent and won, rig uptime, callbacks, survey scores and costs. This Excel scorecard gives those figures one monthly review view so an owner or manager can see what improved, what slipped and which KPI deserves attention next.
Key Features of Pressure Washing Services KPI Scorecard in Excel
- Industry-specific KPI list: Monthly Revenue, Jobs Completed, Average Job Value, Quote Win Rate, Equipment Uptime, Jobs per Crew-Day, Callback Rate, CSAT Score, Repeat Customer Rate and Gross Margin.
- Direction-aware traffic lights: most KPIs are Upper-the-Better, while Callback Rate is Lower-the-Better, so the workbook does not reward the wrong movement.
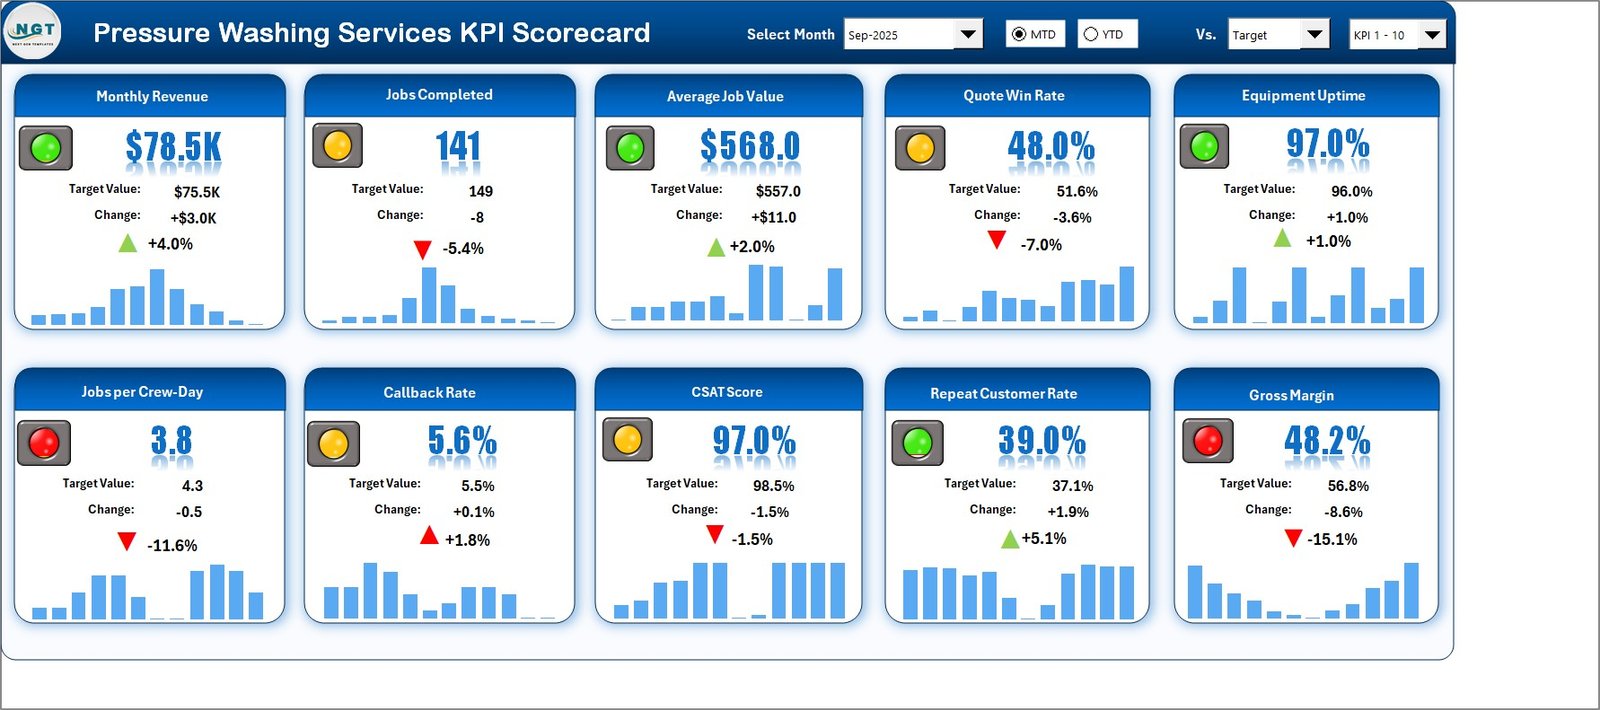
- Scorecard tile wall: each card shows actual value, target or comparison value, absolute change, percentage change, arrow, traffic light and a 12-month sparkline.
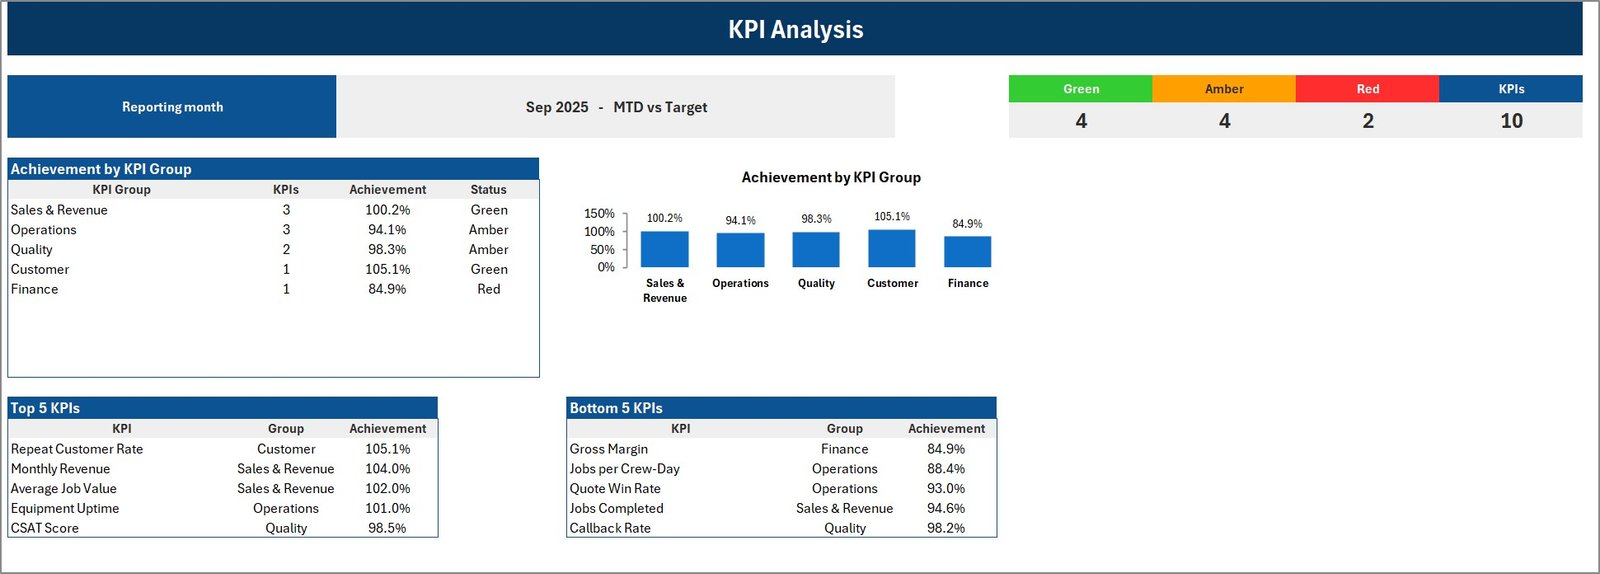
- KPI Analysis page: review achievement by KPI group, RAG counts, top 5 KPIs and bottom 5 KPIs for the selected month.
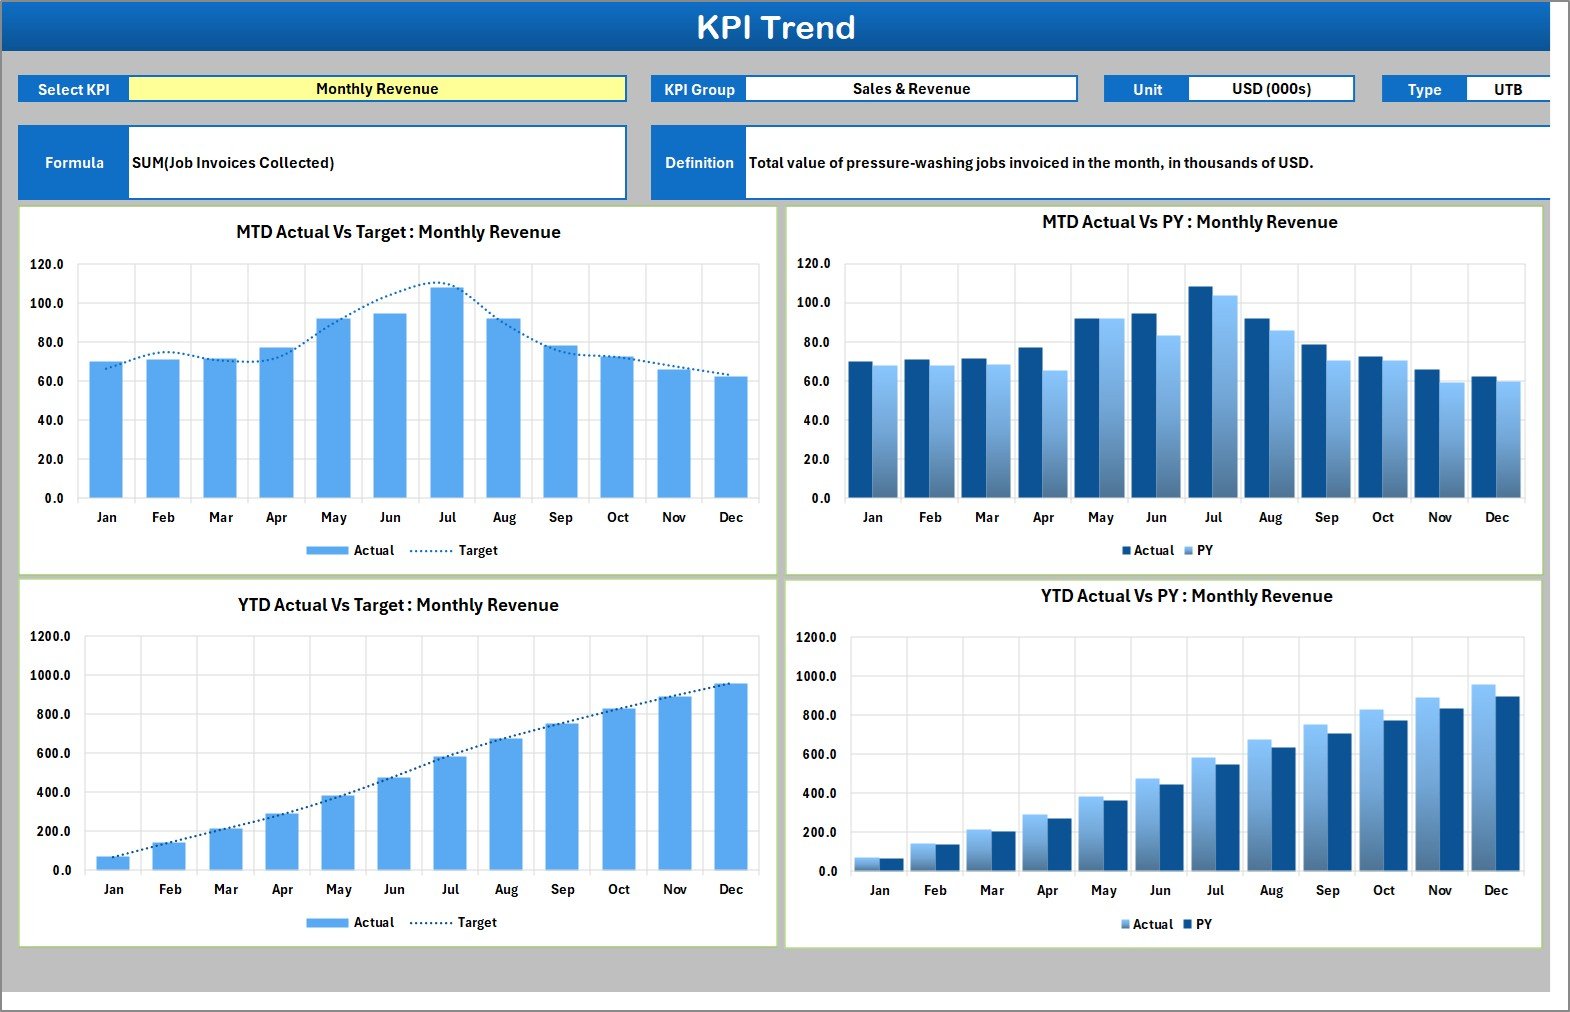
- KPI Trend page: select one KPI and compare MTD and YTD actuals against target and previous year.
- Editable input and definition sheets: type monthly values and document KPI formulas, units, groups, direction and YTD basis.
- No macros: the file is built with formulas, conditional formatting, linked pictures, form controls and sparklines.
Dashboard Pages Explanation
Home
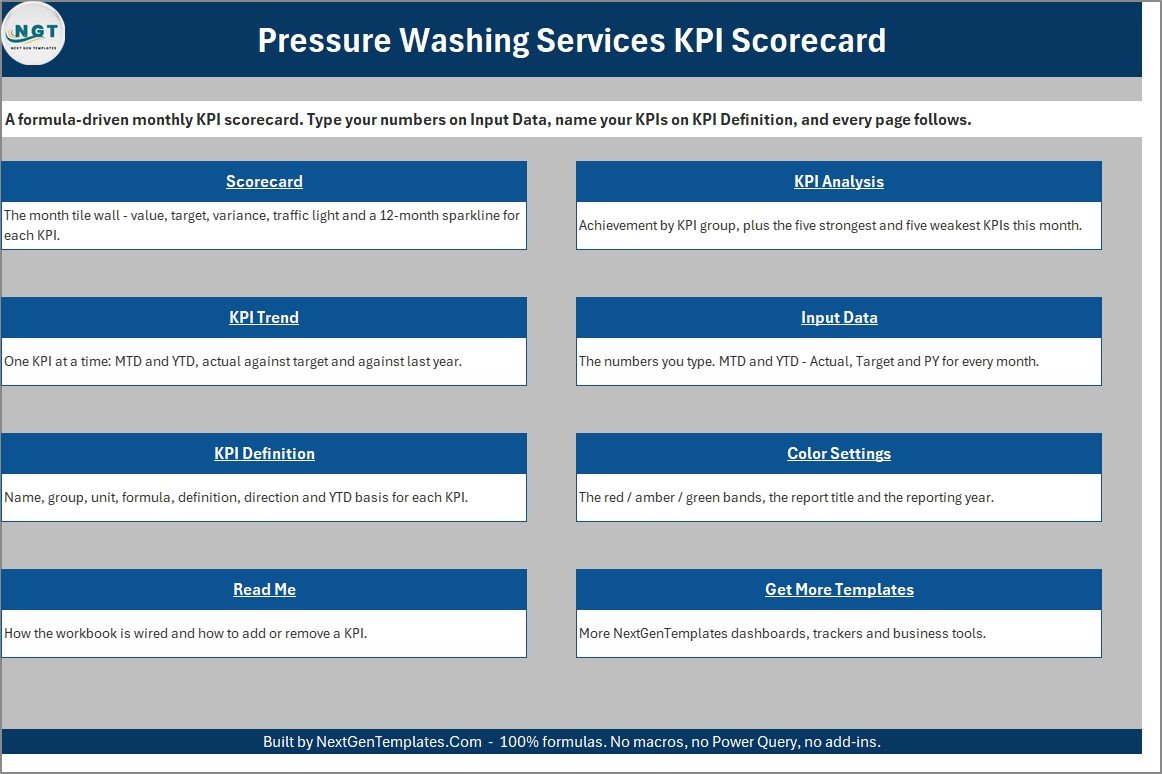
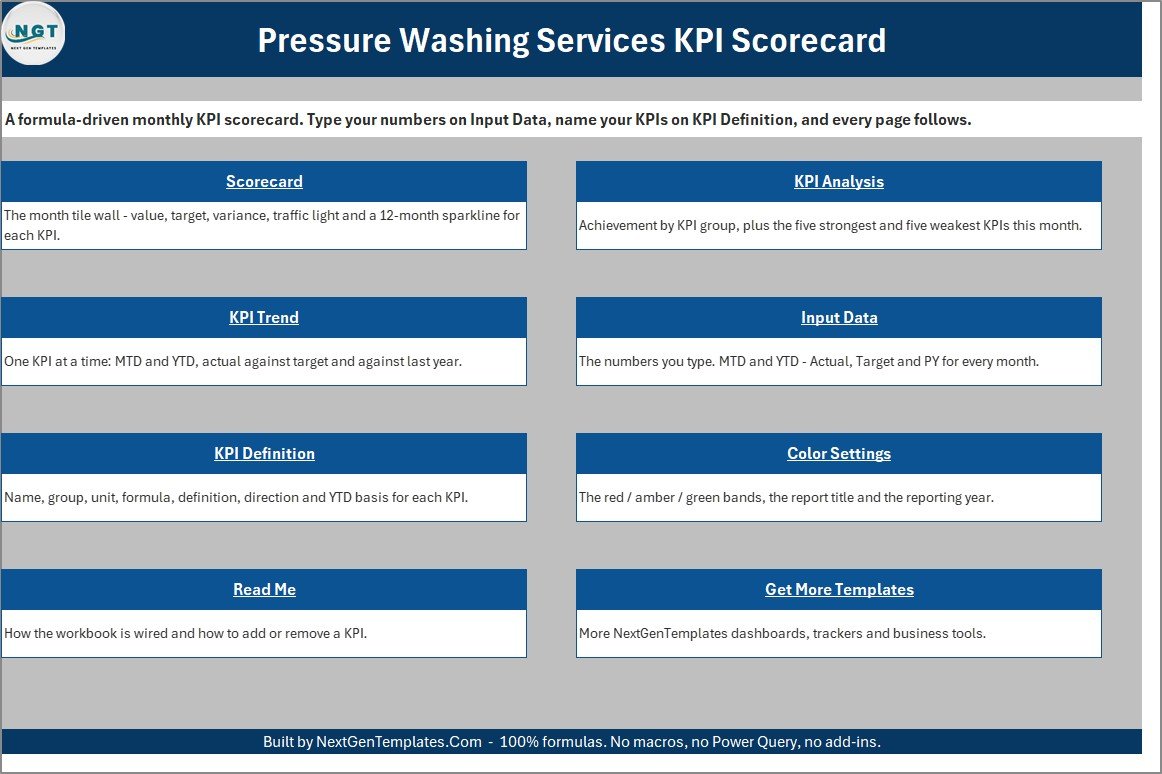
The Home sheet is the navigation page. It explains the workbook flow and links to Scorecard, KPI Analysis, KPI Trend, Input Data, KPI Definition, Color Settings, Read Me and Get More Templates. The footer confirms the workbook uses formulas only, with no macros, Power Query or add-ins.
Scorecard
The Scorecard sheet shows 10 cards in two rows. In the sample month, Monthly Revenue is $78.5K against a $75.5K target, Equipment Uptime is 97.0% against 96.0%, Quote Win Rate is 48.0% against 51.6%, Callback Rate is 5.6% against 5.5%, and Gross Margin is 48.2% against 56.8%. The header includes month, MTD/YTD, comparison and KPI set controls.
KPI Analysis
KPI Analysis summarizes the selected month with four green KPIs, four amber KPIs and two red KPIs. It also shows achievement by group, a simple bar chart and Top 5 and Bottom 5 KPI tables. Customer leads the sample at 105.1% achievement, while Finance trails at 84.9%.
KPI Trend
KPI Trend lets you inspect one KPI at a time. The selected KPI displays its group, unit, formula, definition and type above four charts: MTD Actual vs Target, MTD Actual vs PY, YTD Actual vs Target and YTD Actual vs PY. The sample opens on Monthly Revenue, defined as the total value of pressure washing jobs invoiced in the month.
Input Data
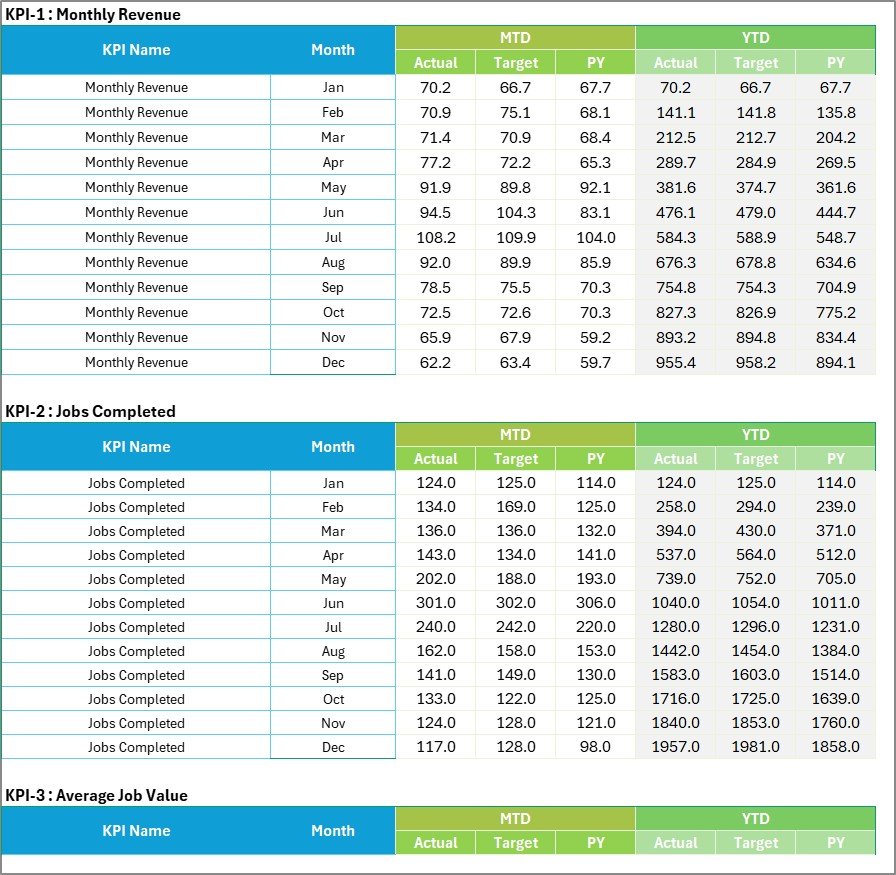
Input Data contains monthly rows for each KPI. You enter MTD Actual, Target and PY, plus YTD Actual, Target and PY. The workbook deliberately lets you type YTD values because some KPIs should roll up as sums while rates and averages may need a different basis.
KPI Definition
KPI Definition stores the master KPI list: group, name, unit, formula, definition, type, YTD basis and a Check column. The sheet shows ten prefilled pressure washing KPIs and supports additional KPI slots if you want to adapt the workbook to your own management pack.

Color Settings and Read Me
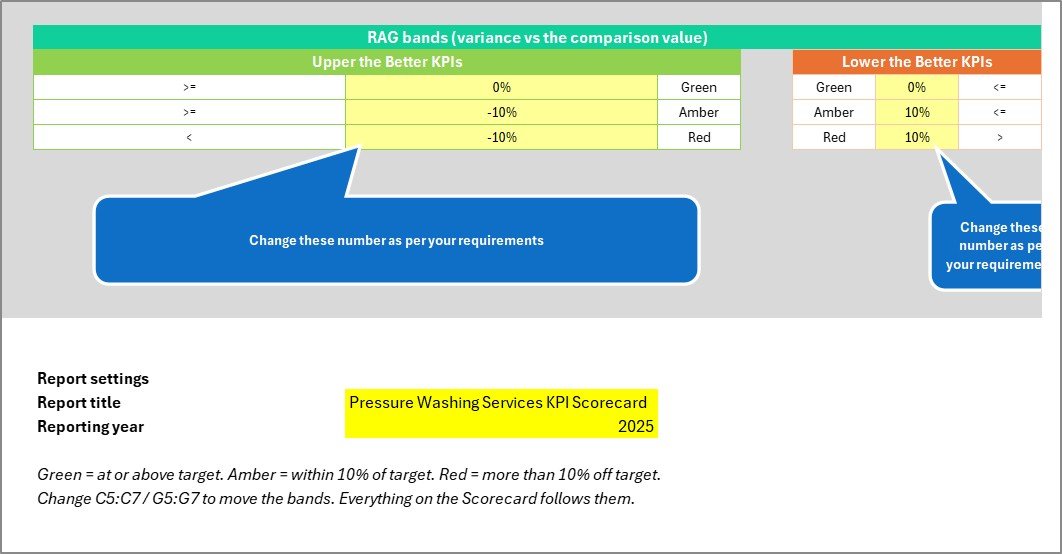
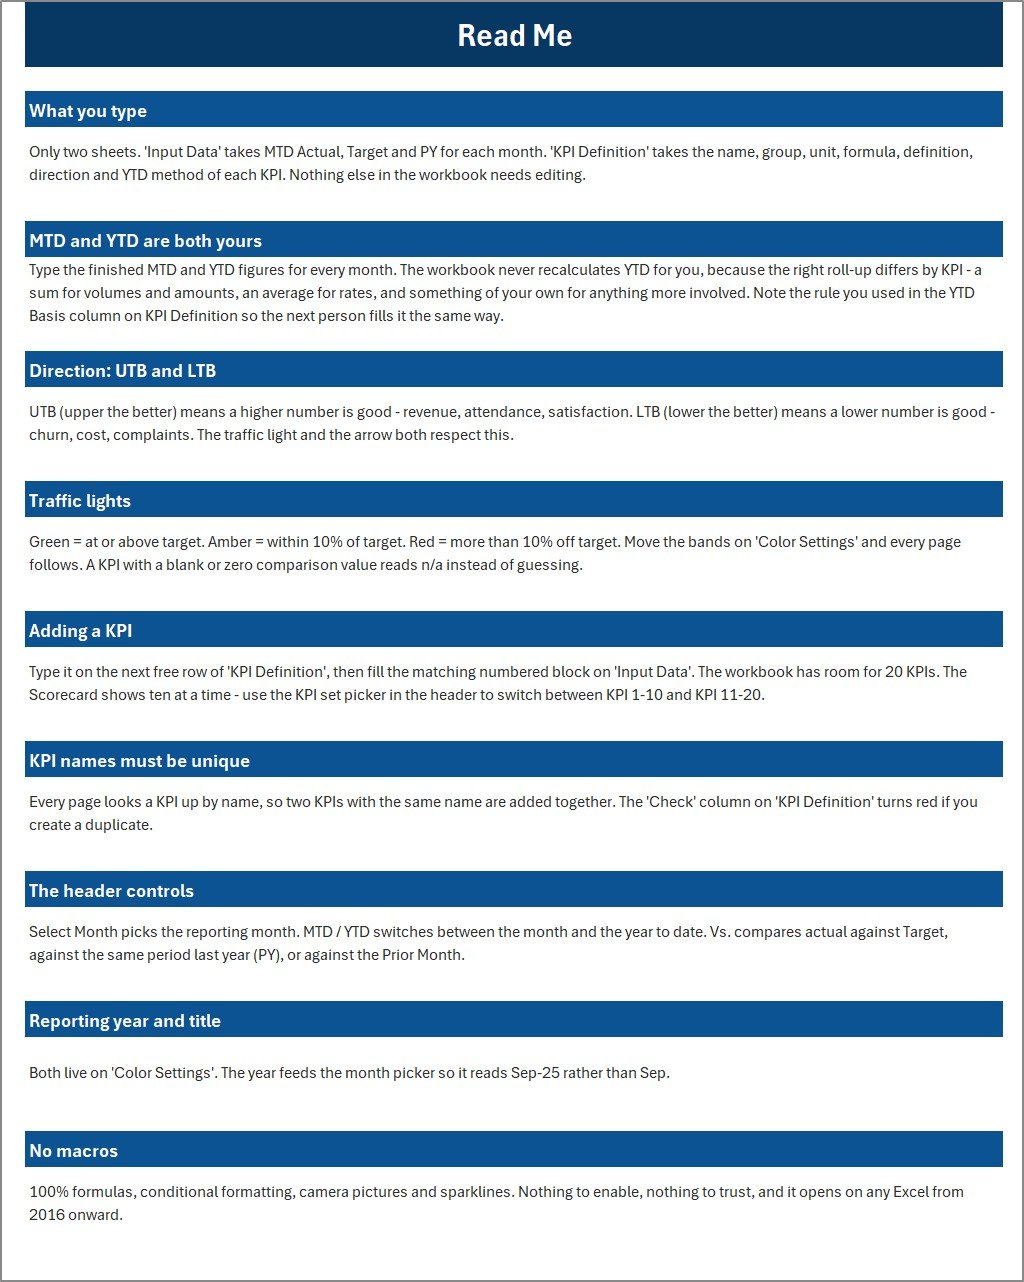
Color Settings controls the green, amber and red bands for Upper-the-Better and Lower-the-Better KPIs, plus the report title and reporting year. Read Me explains what to type, how MTD and YTD work, what UTB and LTB mean, how traffic lights behave and how to add a KPI.
Excel Scorecard vs. Google Sheets vs. Paid CRM/SaaS – Feature Comparison
| Feature | This Excel pressure washing scorecard | Google Sheets alternative | Field service SaaS |
|---|---|---|---|
| Cost | One-time template price | Free app, build time required | Monthly subscription |
| Platform | Desktop Microsoft Excel | Browser-based spreadsheet | Web and mobile software |
| Setup time | Ready to use after download | Build formulas and charts yourself | Account setup and data import |
| Real-time collaboration | Share the file, not live co-editing | Live co-editing | Multi-user roles |
| Traffic lights and sparklines | Already built | Manual setup | Plan-dependent |
| Custom KPIs | 20 KPI slots | Custom if you build it | Limited by vendor reports |
| Scheduling and invoices | Not included | Not included unless built | Usually included |
| Best fit | Monthly KPI review | Collaborative custom sheet | Daily field-service operations |
Who Should Use This Template
This template is useful for small and mid-sized pressure washing, soft washing and exterior cleaning companies that want a repeatable monthly KPI meeting. Owners can review revenue and margin, office managers can follow quote win rate and repeat customers, operations leads can monitor jobs per crew-day and equipment uptime, and quality managers can watch callback rate and CSAT.
It is not meant for customer records, quoting, invoices, scheduling, route planning, chemical mix logging, wastewater tracking or environmental compliance. Those activities should remain in the tools and processes your business already uses.
Real-World Use Cases
Owner meeting: a three-rig company sees Jobs per Crew-Day in red and uses KPI Trend to check whether the issue is seasonal, operational or a one-month dip.
Sales follow-up: the office team notices Quote Win Rate in amber while Repeat Customer Rate is green, so they focus the next campaign on open quotes.
Margin review: the bookkeeper flags Gross Margin in the Bottom 5 and prepares labor, fuel and chemical cost notes before the monthly review.
Advantages of This Pressure Washing KPI Scorecard
- It keeps the owner-level KPI discussion on one workbook instead of scattered notes.
- It scores Lower-the-Better and Upper-the-Better KPIs correctly.
- It separates input, definitions, trend review and summary scorecard views.
- It avoids macros, so buyers do not need to enable VBA.
- It documents KPI definitions, making handover easier when an office assistant or manager takes over reporting.
Opportunities for Improvement
- YTD values are typed, not automatically rolled up, because different KPIs may need sum, average or a custom basis.
- The month picker covers one reporting year per workbook, so keep a copy for each year.
- The workbook reports monthly totals and does not drill into individual jobs, crews, routes or service types.
- Traffic-light bands are global for KPI direction rather than customized per KPI.
- The dropdown controls are desktop Excel controls and are not designed for Excel for the web.
Best Practices
- Agree the definition of each KPI before entering the first month.
- Use seasonal targets, because pressure washing demand can change by month.
- Record the source system for each KPI on your internal checklist.
- Review the Bottom 5 KPIs first, then use KPI Trend to understand whether the issue is temporary or persistent.
- Use the same callback definition every month, such as return visits to redo missed areas.
- For formula basics, see Microsoft’s overview of formulas in Excel.
Explore Relevant Templates
For more Excel dashboard and scorecard ideas, see the PK-AnExcelExpert dashboard articles.
- Plumbing Business KPI Scorecard in Excel
- Cleaning Services KPI Dashboard in Excel
- Office Cleaning Request Tracker in Excel
- Cleaning Staff Performance Dashboard in Google Sheets
- KPI Dashboard Library (Excel)
Frequently Asked Questions
What does this workbook include?
The download includes one Excel workbook and a PDF user manual inside the ZIP. The workbook has 9 visible sheets and 10 prefilled pressure washing KPIs.
Which KPI is Lower-the-Better?
Callback Rate is Lower-the-Better. The other prefilled KPIs are Upper-the-Better, and the direction can be changed on KPI Definition.
Does this template need macros?
No. It uses formulas, conditional formatting, camera pictures, form controls and sparklines only.
Can I change the KPIs?
Yes. You can rename KPIs, change formulas and definitions, adjust units, change KPI groups and use up to 20 KPI slots.
Can it replace Jobber or Housecall Pro?
No. Jobber and Housecall Pro manage day-to-day field service operations. This workbook is for monthly KPI review after your numbers are collected.
Does it track environmental compliance?
No. It does not track runoff, wastewater, chemicals, licensing or safety compliance. It only reports the values entered into the workbook.
About the Author
Built by PK – Microsoft Certified Professional with 15+ years of Excel, Google Sheets, and Power BI experience. Founder of NextGenTemplates, reaching 300K+ subscribers across YouTube channels. Every template is hand-built and tested before release.
Conclusion
A pressure washing business depends on winning quotes, completing jobs efficiently, keeping rigs available, protecting customer satisfaction and maintaining margin. This scorecard gives those monthly numbers a clear Excel review pack without turning the workbook into a full operations system.
Click here to purchase this Excel KPI scorecard
Instant download. One-time payment. No subscription.
Watch more tutorials at Youtube.com/@PKAnExcelExpert.
Last updated: September 2026
📚 Related guides: CCTV Installation KPI Scorecard in Excel · Security System Installation KPI Scorecard in Excel