Are you ready to unlock the full potential of Excel 365? In this engaging exploration, we delve into the powerful GROUPBY and PIVOTBY functions. These tools are game-changers for anyone looking to master data organization and analysis.
GROUPBY Function
Imagine effortlessly summarizing complex data with just a few clicks. That’s what GROUPBY does! It’s a very useful function that enables you to compile and analyze data along one dimension. Picture this: You have a massive sales dataset. With GROUPBY, you can swiftly summarize sales figures by year, unveiling trends and insights.
GROUPBY’s Syntax and Components
GROUPBY’s syntax is a pathway to data transformation. It’s like a magic formula:
GROUPBY(row_fields, values, function, [field_headers], [total_depth], [sort_order], [filter_array])
Each element plays a crucial role:
- row_fields (essential): Think of this as the backbone of your grouping. It’s the column or range that dictates how your rows will be organized.
- values (essential): This is where your data lives. It’s the column or range you’re looking to summarize.
- function (essential): Here’s where the magic happens. This is the aggregation function – SUM, AVERAGE, COUNT, and so on – that processes your data.
- field_headers: It’s all about visibility. This parameter determines if your row_fields and values will display headers.
- total_depth: This controls the depth of your summaries. It can show the grand totals and subtotals.
- sort_order: This is where order meets data. It dictates the sequence in which your rows appear.
- filter_array: It’s the gatekeeper. This array decides which rows make it into your final summary.
PIVOTBY Function
Now, let’s elevate your data analysis with PIVOTBY. This function is a powerhouse, allowing you to group and analyze data along two axes. Imagine breaking down sales data by both state and year – PIVOTBY makes it possible!
PIVOTBY’s Syntax and Elements
The structure of PIVOTBY is akin to a roadmap for data exploration:
PIVOTBY(row_fields, col_fields, values, function, [field_headers], [row_total_depth], [row_sort_order], [col_total_depth], [col_sort_order], [filter_array])
Each component serves a distinct purpose:
- row_fields and col_fields (essential): These are the coordinates of your data map. They dictate how your rows and columns will be organized.
- values (essential): The heart of your data, this is what you’re summarizing.
- function (essential): This is your analytical tool, the function that aggregates your data.
- field_headers: This determines whether your fields will be crowned with headers.
- row_total_depth and col_total_depth: These twins control the depth of summaries in your rows and columns.
- row_sort_order and col_sort_order: They bring order to your data, dictating how rows and columns are sequenced.
- filter_array: The ultimate selector, this decides which data makes the cut.
In summary, Excel 365’s GROUPBY and PIVOTBY functions are your allies in the quest for data mastery. Whether you’re summarizing sales figures or dissecting complex datasets, these functions transform data analysis into an exciting journey of discovery.
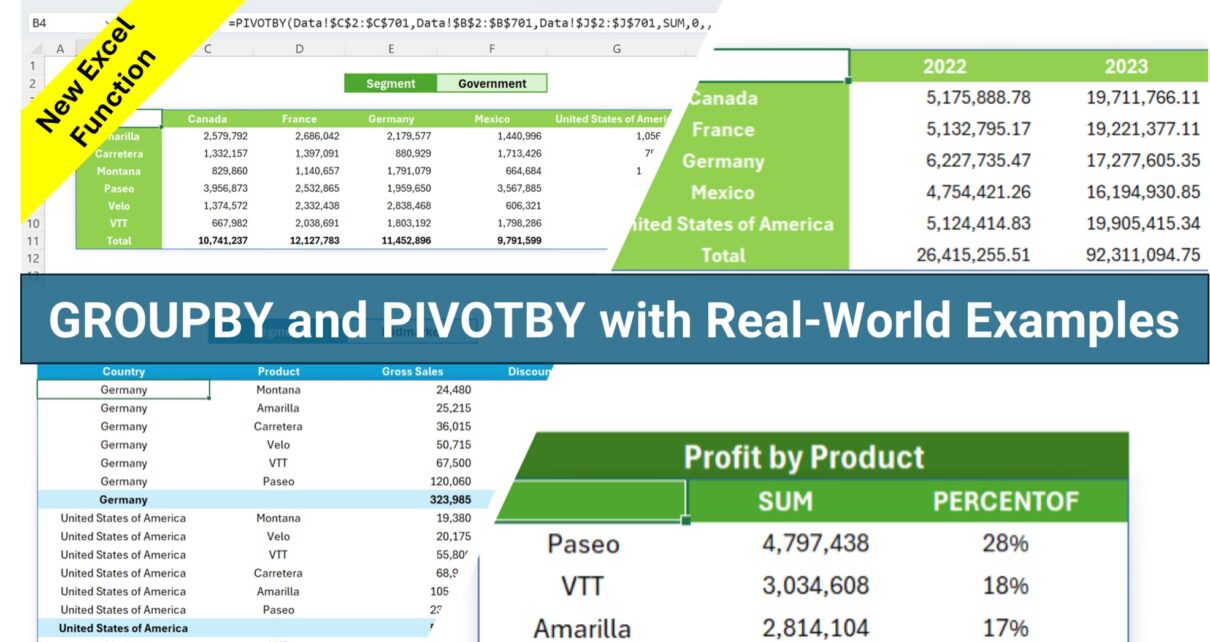
GROUPBY and PIVOTBY with Real-World Examples
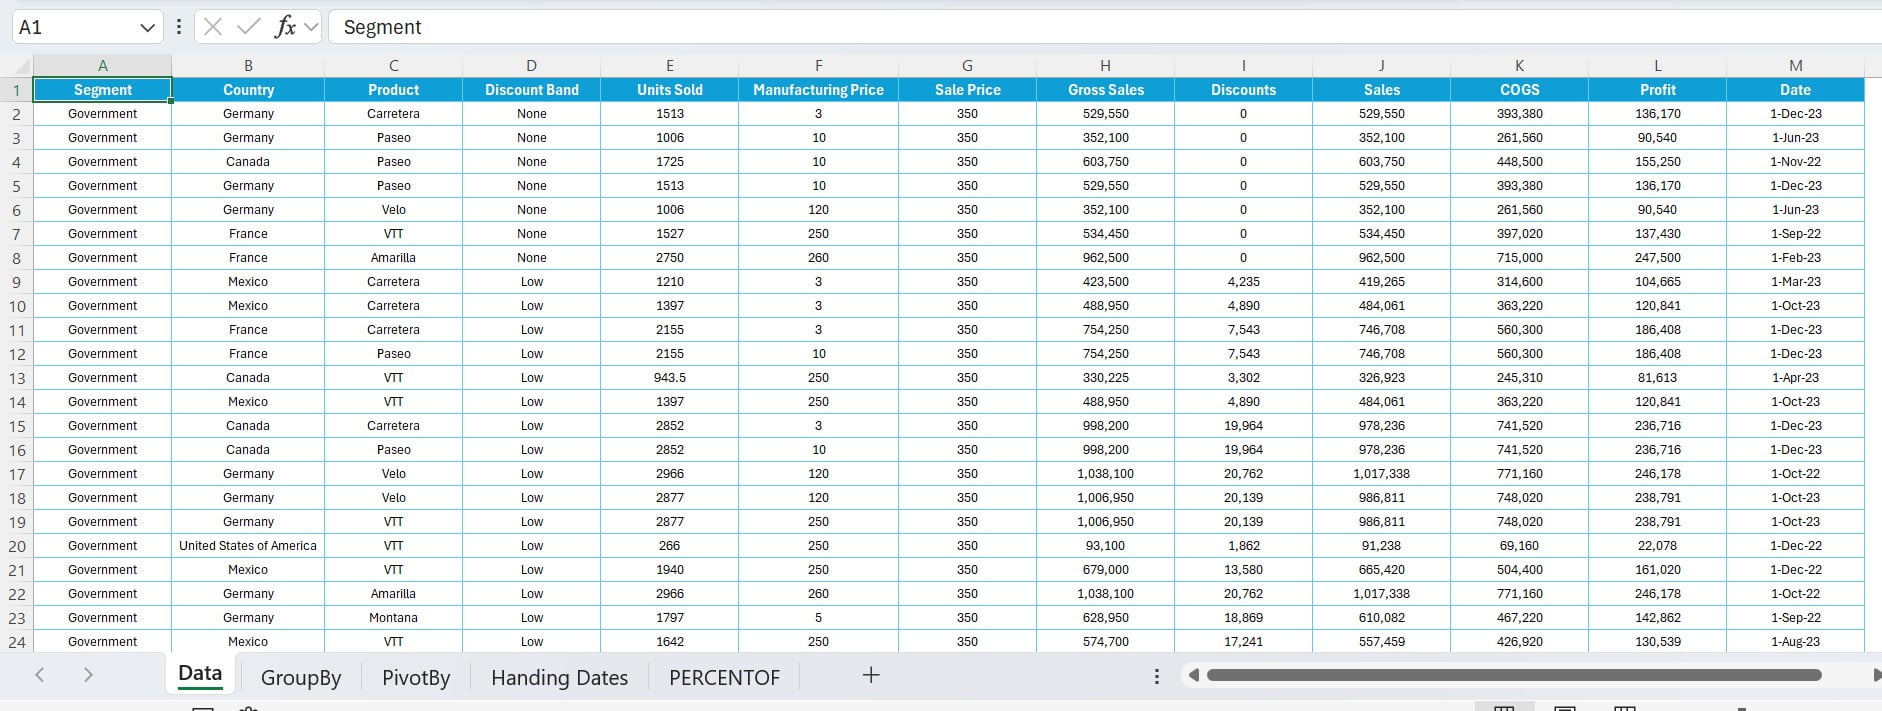
Get ready to embark on an Excel adventure as we dive into real-world applications of the GROUPBY and PIVOTBY functions. These functions are not just functions; they’re your secret weapons in the world of data analysis. We will use the below given Sales data in following examples:
1) Summing Profit by Country with GROUPBY
Imagine you have sales data, and you need to find the total profit for each country. This is where GROUPBY becomes your best friend. By using the formula
=GROUPBY(Data!B2:B701,Data!L2:L701,SUM)
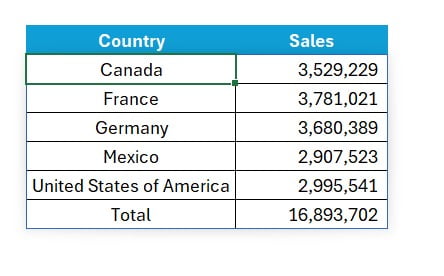
You swiftly calculate the country-wise sum of profits.
2) Analyzing Gross Sales and Discounts by Country and Product
Next, let’s spice things up. You need to understand how gross sales and discounts vary by country and product. Using GROUPBY again, you craft a formula that not only sorts your data but also brings in subtotals and grand totals. By linking this to a Segment dropdown list (located at I2), you get targeted results with
=GROUPBY(Data!$C$2:$C$701:Data!$B$2:$B$701,HSTACK(Data!$H$2:$H$701,Data!$I$2:$I$701),SUM,,2,3,Data!$A$2:$A$701=GroupBy!I2)
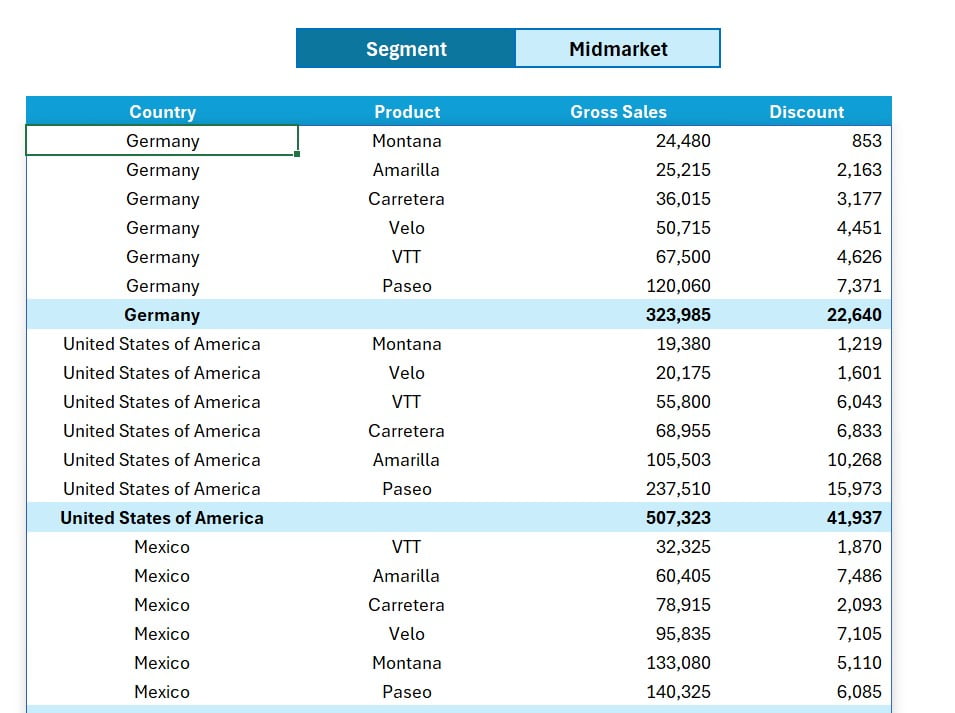
It’s like having a magnifying glass over your data!
3) Mapping Sales by Product and Country Using PIVOTBY
For a more complex scenario, imagine needing to compare sales by product and country. PIVOTBY steps in to transform your data, showing countries in columns and products in rows. Filtered by a Segment dropdown at F2, the formula-
=PIVOTBY(Data!$C$2:$C$701,Data!$B$2:$B$701,Data!$J$2:$J$701,SUM,0,,,,,Data!$A$2:$A$701=PivotBy!F2)
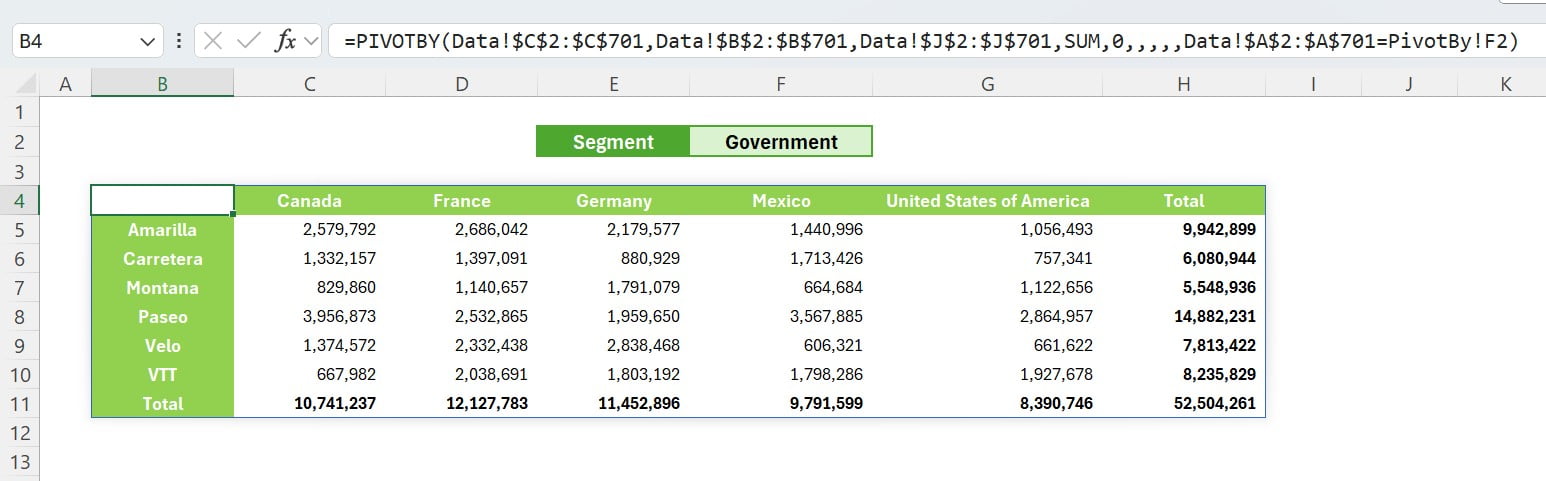
Turning complex data into an easy-to-read matrix.
4) Unveiling Year and Month-Wise Profit Summaries
Now, let’s tackle a time-based challenge. You only have a date column, but you need to calculate profit sums by year and month, with subtotals and grand totals. The GROUPBY function comes to the rescue again with
=GROUPBY(HSTACK(YEAR(Date),TEXT(Date,"MMM")),Profit,SUM,,2)
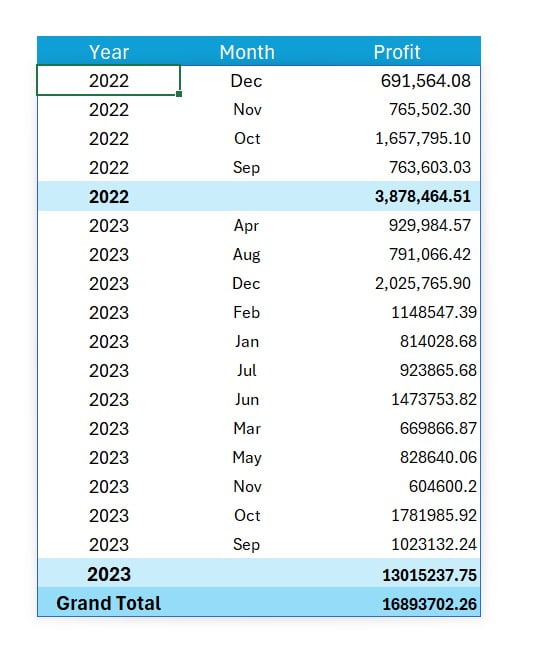
It’s like having a time machine for your data!
5) Visualizing Sales by Year and Country
In another scenario, you want to visualize sales by year (in columns) and country (in rows). Using PIVOTBY, you apply below formula-
=PIVOTBY(Country,YEAR(Date),Sales,SUM)
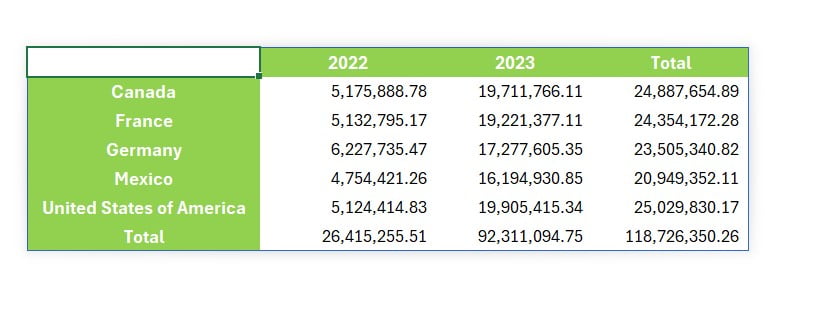
It’s like creating a time-lapse of your sales data!
7) Product-Specific Sales Analysis
For a deeper dive, let’s say you want to analyze sales and their percentage for each product. Below is the formula:
=GROUPBY(Product,HSTACK(Profit,Profit),HSTACK(SUM,PERCENTOF),,,-3)
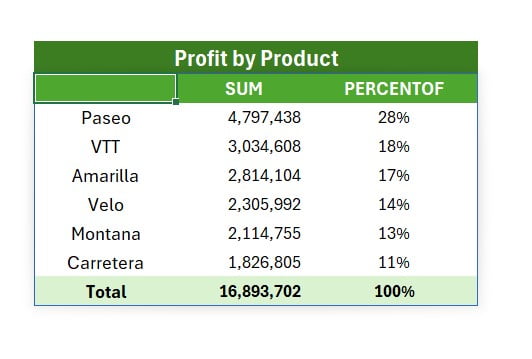
With above formula, we are calculating the sum of sales and their percentage, and even sorting the results in descending order. It’s like having X-ray vision for your product performance!
8) Country and Year-Wise Sales Percentage with PIVOTBY
Finally, imagine needing a country-wise breakdown of sales percentages over the years. PIVOTBY comes to your aid, displaying years in columns with below formula:
=PIVOTBY(Country,YEAR(Date),Sales,PERCENTOF)
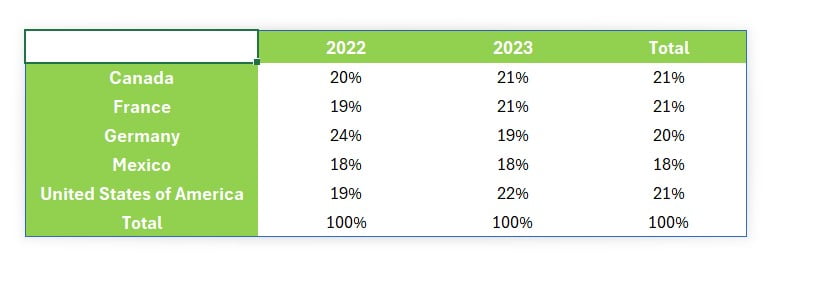
It’s like painting a picture of your sales landscape across time!
In addition to these powerful examples, remember that you can streamline your data even further. Convert ranges into tables or create dynamic names for all fields. A fantastic tool for this is PK’s Utility Tool V3.0, a free resource that makes name creation a breeze. Click here to download it.
There you have it – Excel’s GROUPBY and PIVOTBY functions transforming data into insights. With these examples, you’re not just crunching numbers; you’re embarking on a journey of discovery, unlocking the stories hidden within your data. Happy analyzing!
Visit our YouTube channel to learn step-by-step video tutorials
Watch the step-by-step video tutorial:
Click here to download the practice file