Freelance developers routinely leave money on the table because they cannot see their own business clearly. Revenue is scattered across platforms, hours live in a time-tracking app, expenses hide in a bank statement, and client satisfaction exists only as a gut feeling. The Freelance Developer Dashboard in Power BI pulls all of it into one Power BI Desktop report with 5 KPI cards and 13 interactive visuals across 5 dedicated pages. Setup takes under 10 minutes, and the entire report refreshes when you repoint the data source to your own project log.
🌍 Join 8,400+ teams in 40+ countries using NextGenTemplates to replace paid SaaS tools with one-time-purchase Excel, Google Sheets, Power BI, and HTML templates.
✅ Instant download · One-time payment · No subscription · No per-user fees
Freelance Developer Dashboard in Power BI
Why a Power BI dashboard beats spreadsheets for freelance developers
Most freelance developers start in Excel — and Excel is fine for a while. But once you have more than one revenue source, more than one technology stack, and more than a handful of clients, cross-filtering becomes painful. Power BI is purpose-built for the “show me everything filtered by this one thing” workflow that freelancers actually need. Microsoft distributes Power BI Desktop free for Windows, which means this dashboard runs on your laptop with zero licensing cost.
Key Features of the Freelance Developer Dashboard in Power BI
The Freelance Developer Dashboard in Power BI is engineered around five headline KPIs that freelance developers care about: Total Revenue, Total Projects, Net Income, Total Expenses, and Total Hours Worked. Every visual on every page honours the slicers — filter by one client, and the entire page redraws. Specific features include:
- Reusable DAX measures for Total Revenue, Total Expenses, Net Income, Profit Margin, and Total Hours Worked — written once, sliced infinitely.
- Slicers on every page — client, source, project type, payment status, platform, technology stack, industry, priority, status, and month.
- 5 report pages, 13 visuals — each page is built around one decision, not a wall of charts.
- Clean Power BI data model — named tables, typed columns, and documented relationships, ready for you to extend.
- Free Power BI Desktop compatible — no Power BI Pro licence needed for solo use.
Dashboard Pages Explanation
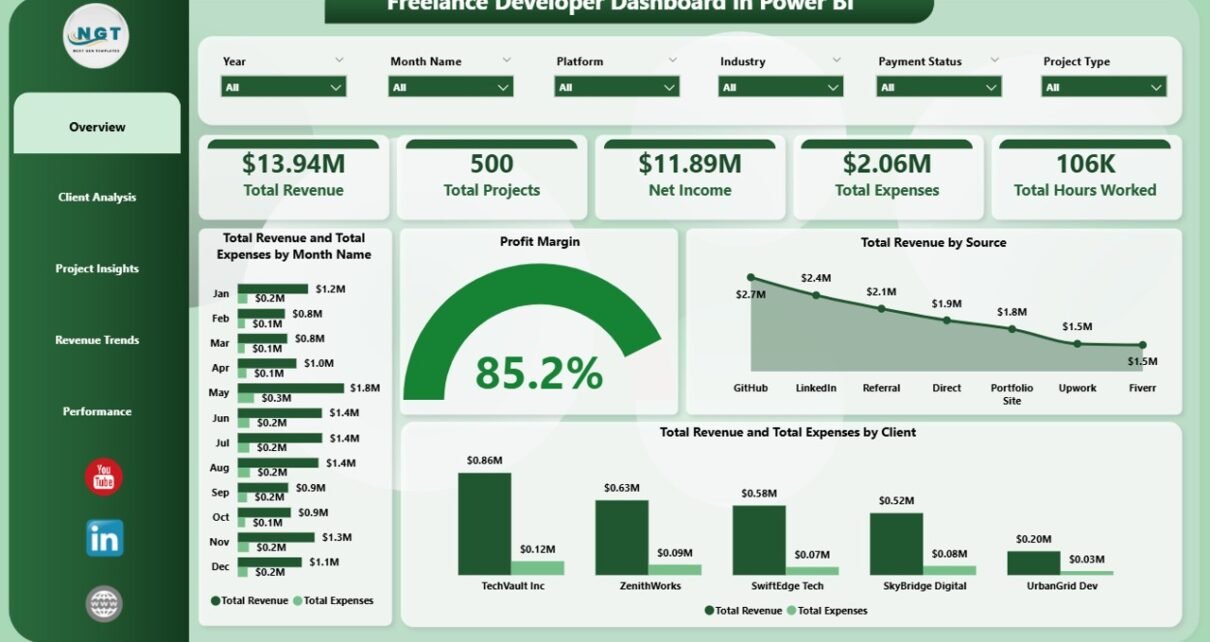
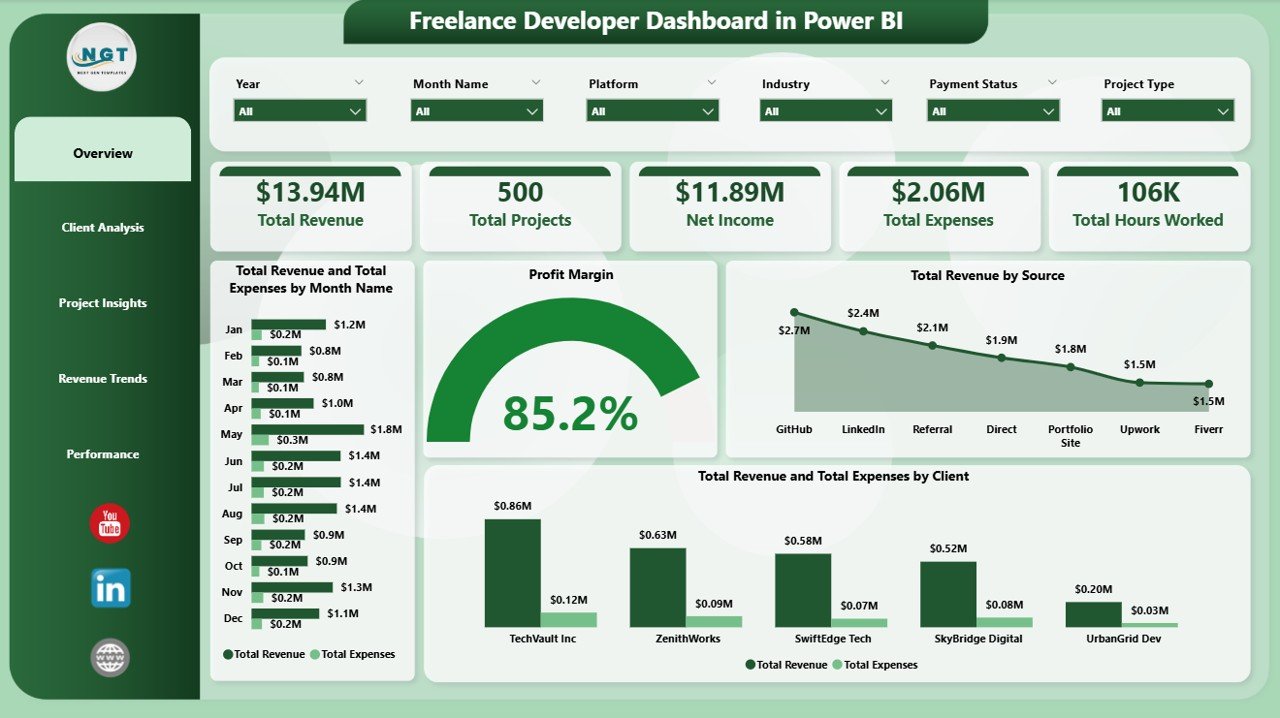
1. Overview Page
The Overview page is the command centre of the report. Five KPI cards summarise the entire dataset — Total Revenue, Total Projects, Net Income, Total Expenses, and Total Hours Worked. Slicers across the page filter everything on the Overview in one click. Below the cards sit four visuals:
- Total Revenue and Total Expenses by Month Name — compares monthly income against monthly expenses so you can spot cash-flow gaps and watch margins tighten or widen over the year.
- Profit Margin — a single KPI visual showing overall profit margin as a percentage, always visible at a glance.
- Total Revenue by Source — breaks revenue down by acquisition channel (Upwork, LinkedIn, Referral, Direct, Fiverr), so you can double down on the channels that actually pay.
- Total Revenue and Total Expenses by Client — side-by-side view of revenue earned versus expenses incurred, ranked by client, so you see which relationships are profitable and which are bleeding hours.
2. Client Analysis
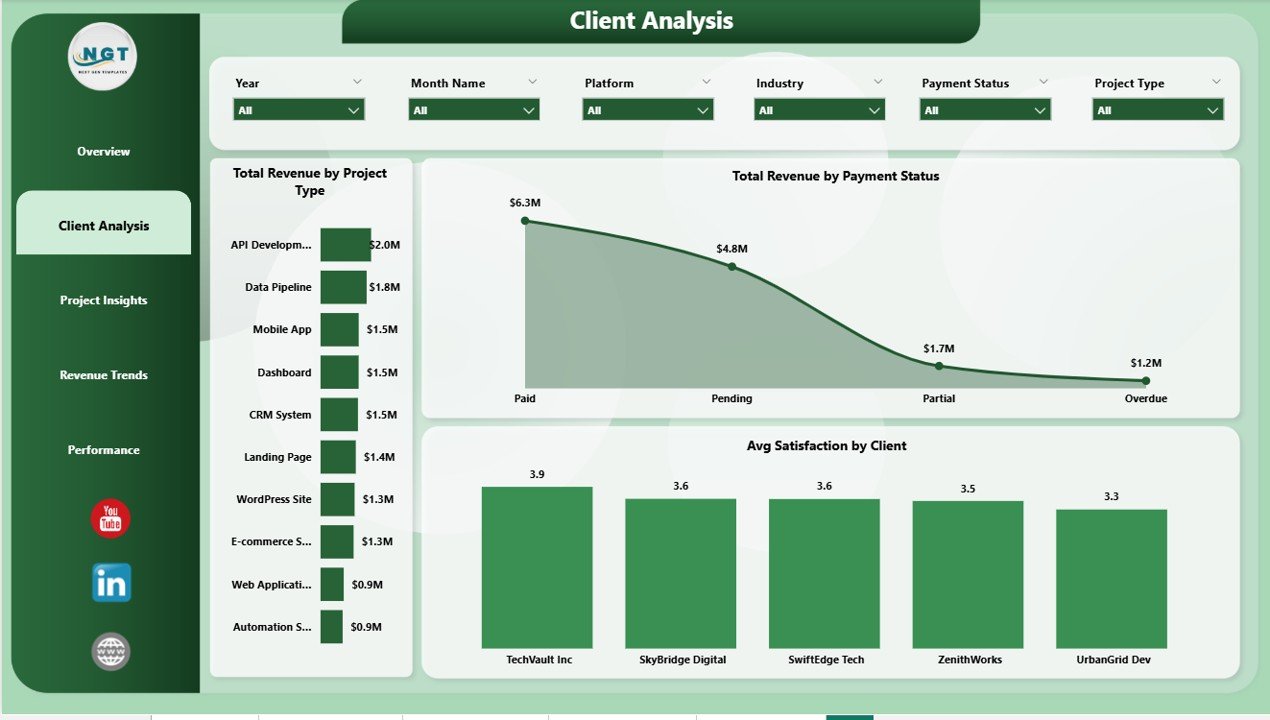
Client Analysis
Client Analysis drills into client-level performance so you know who pays on time, who delays, and who deserves a higher rate next quarter. Three visuals anchor the page:
- Total Revenue by Project Type — compares revenue across Web App, Mobile App, API, Landing Page, and other project types to identify the most lucrative engagements.
- Total Revenue by Payment Status — splits revenue into Paid, Pending, and Overdue buckets so no invoice slips through the cracks.
- Avg Satisfaction by Client — ranks every client by their average satisfaction score, exposing happy repeat-buyers and clients at risk of churn.
3. Project Insights
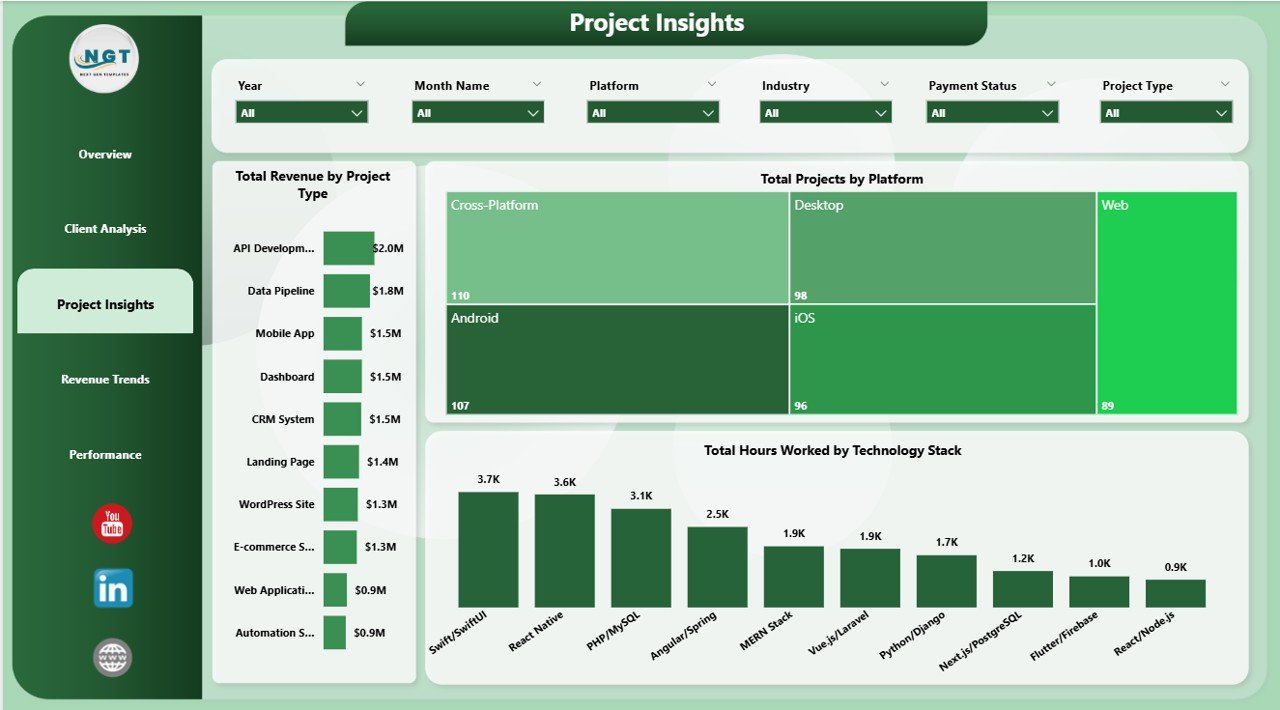
Project Insights
Project Insights looks at the work itself — what you built, which stack you used, and where those hours went. Three visuals:
- Total Revenue by Project Type — same core metric as the Client Analysis page but sliced alongside project-level context, so you can cross-reference which types drive the biggest revenue line.
- Total Projects by Platform — counts projects sourced from Upwork, Fiverr, Toptal, Direct, LinkedIn, and other platforms, so you can benchmark where your pipeline actually comes from.
- Total Hours Worked by Technology Stack — shows exactly where your hours went across React, Python, Node.js, .NET, Flutter, and other stacks — essential data for rate-setting.
4. Revenue Trends
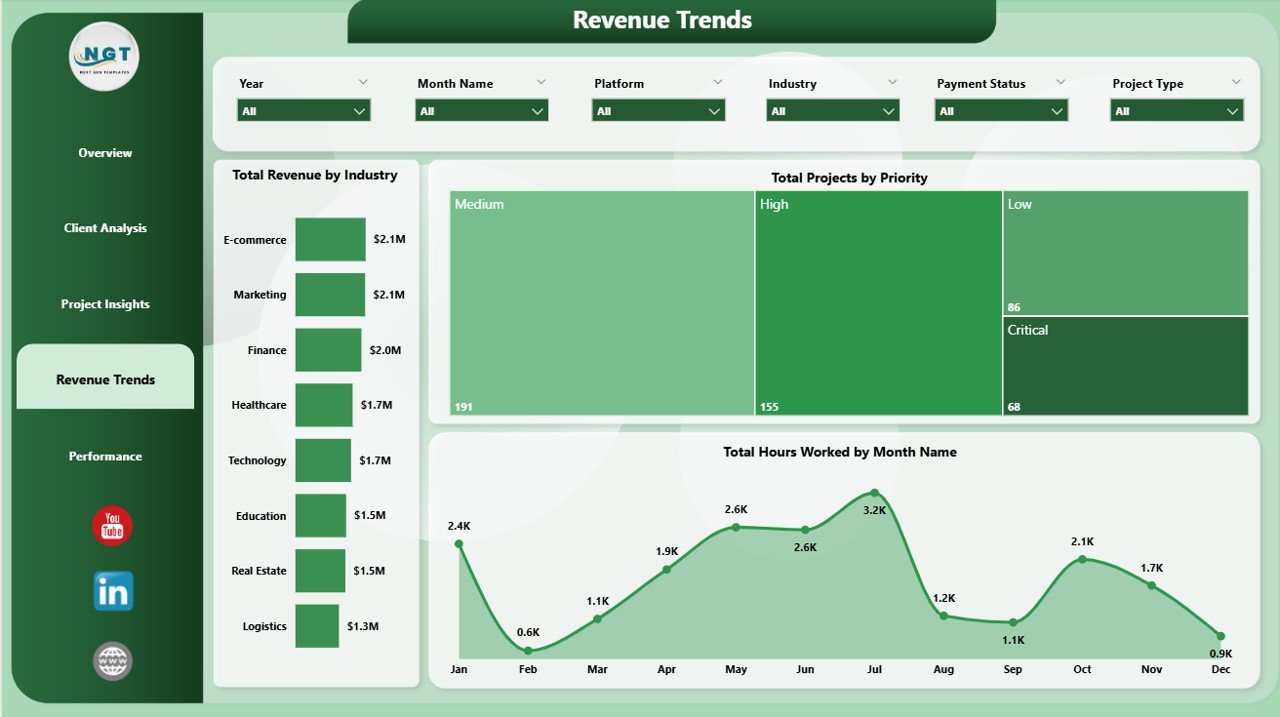
Revenue Trends
Revenue Trends surfaces time-based patterns and hidden opportunities in your pipeline so you can plan ahead instead of reacting. Three visuals:
- Total Revenue by Industry — identifies which verticals (SaaS, E-commerce, Fintech, Healthcare, EdTech) pay the highest revenue so you can focus positioning and outreach.
- Total Projects by Priority — counts how many High, Medium, and Low priority projects you juggle, so you can rebalance workload before burnout.
- Total Hours Worked by Month Name — month-by-month workload view so you can spot seasonal crunches and plan capacity in advance.
5. Performance
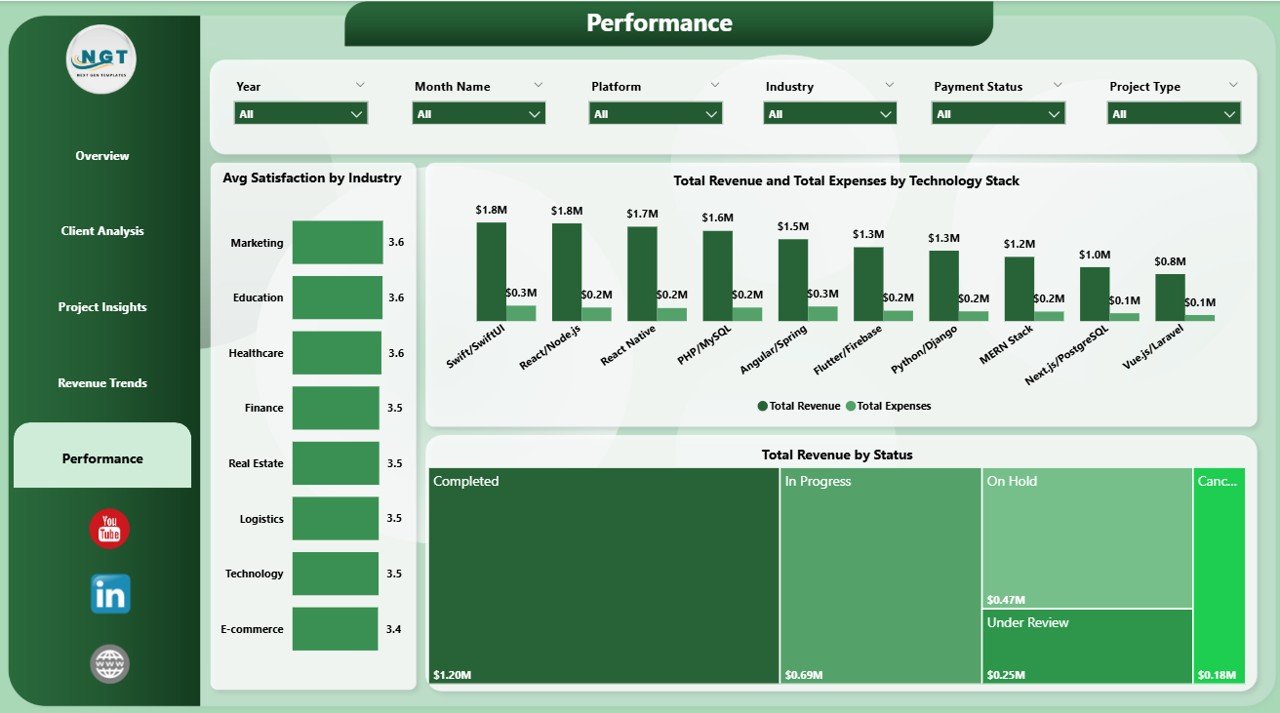
Performance
The Performance page ties everything back to outcomes — were you paid, were clients happy, and which technology stack actually profits after costs? Three visuals:
- Avg Satisfaction by Industry — shows which verticals rate your work highest, useful for case-study selection and positioning.
- Total Revenue and Total Expenses by Technology Stack — reveals the real profitability of each stack after infrastructure, tooling, and subcontractor costs are deducted.
- Total Revenue by Status — segments revenue across Completed, In Progress, Cancelled, and On Hold projects to highlight locked-in versus at-risk income.
Freelance Developer Dashboard in Power BI vs. Tableau / Qlik vs. HoneyBook / Bonsai — Feature Comparison
| Feature | Freelance Developer Dashboard in Power BI | Tableau / Qlik Template | HoneyBook / Bonsai / FreshBooks |
|---|---|---|---|
| Cost | $17.99 one-time | $70-90 / user / month (Tableau Creator) | $20-40 / user / month |
| Platform | Power BI Desktop (free) | Tableau Desktop / Qlik Sense | Proprietary cloud SaaS |
| Setup time | Under 10 minutes | 30-60 minutes | 1-2 hours + onboarding |
| Slicers & drill-through | ✅ Built-in | ✅ Yes | N/A |
| Customisable DAX measures | ✅ Full control | Calculated fields (LOD) | Limited to vendor schema |
| Works offline | ✅ Yes | Desktop only | No |
| Year-1 cost at 1 user | $17.99 | $840-1,080 | $240-480 |
| Client invoicing built-in | No | No | ✅ Yes |
For solo developers and small dev agencies who want a Power BI-native revenue, margin, and client-health view without a $70/month BI subscription or a $30/month SaaS lock-in, the Freelance Developer Dashboard in Power BI sits in the sweet spot.
Who Should Use This Template
Perfect for:
- Solo freelance web, mobile, and full-stack developers who already use Power BI or want to learn it
- Indie contractors running projects on Upwork, Fiverr, Toptal, LinkedIn, or direct clients
- Small dev agencies (1-5 people) that want one .pbix file summarising revenue, margin, hours, and client health
- Excel users ready to graduate to Power BI for richer interactivity
Not a fit if:
- You need row-level security, role-based access, or SSO at scale
- You cannot install Power BI Desktop (Mac-only users without a Windows VM)
- You need automatic invoice sending, payment gateways, or client portals
- You are not a developer — the industry and technology-stack fields are developer-focused
Real-World Use Cases
Aarav is a full-stack freelance developer in Bengaluru. He juggles 8-12 projects per quarter across Upwork and direct clients. Using the Freelance Developer Dashboard in Power BI, he opens the report every Monday, checks Total Revenue by Source, and decides whether to pitch more on Upwork or double down on LinkedIn outreach — without paying $29 per month for HoneyBook. The Total Revenue and Total Expenses by Client visual flagged a long-running client that was technically “big” but actually unprofitable after subcontractor costs. He raised their rate, they pushed back, and he replaced them within the quarter.
Priya runs a 3-person React agency in Pune. She uses the Power BI report to track which technology stack (React, Next.js, React Native) generates the highest revenue and the lowest expense ratio. The Total Revenue and Total Expenses by Technology Stack chart on the Performance page helped her raise her minimum project size from $2,000 to $5,000 in one quarter. She also uses Avg Satisfaction by Industry to pick which case studies to feature on her site.
Marcus is an indie mobile developer in Berlin. He used to track everything in Notion but found reporting painful. With the Freelance Developer Dashboard in Power BI, he connects his Clockify export file to the data model, clicks Refresh, and gets a client-by-client margin view in seconds — all in Power BI Desktop, offline.
Advantages of the Freelance Developer Dashboard in Power BI
- Zero recurring cost — a one-time $17.99 buy replaces $240-480/year SaaS subscriptions like HoneyBook or Bonsai.
- Full data control — your project log stays on your computer. No vendor cloud, no data export restrictions.
- Faster interactivity than Excel — cross-filtering and drill-through are native to Power BI, not bolted on.
- Extensible — every measure is written in DAX, so you can read it, copy it, and extend it.
- Publishable when you are ready — stays on Power BI Desktop for solo use, or publish to the Power BI Service later if you add teammates.
Opportunities for Improvement
Honest limitations so you can decide if this fits:
- The report is Windows-only, because Power BI Desktop is Windows-only. Mac users need a Windows VM or Parallels.
- There is no built-in invoice generator. Pair with a dedicated invoice template for that.
- Data entry still happens in Excel or CSV — Power BI is the reporting layer, not a form-based data entry tool.
- For real-time collaborative editing (multiple people editing the same report simultaneously), a Power BI Pro workspace is needed. The free Desktop app is single-user.
Best Practices
- Keep one row per project. Even if an engagement spans months, one row per project keeps the data model clean. Use a separate Time log table for hours.
- Use consistent category names. “Upwork” and “upwork” and “UpWork” look the same to a human but split into three rows in Power BI. Use Power Query’s Transform → Format → Capitalize Each Word to normalise.
- Refresh weekly, not daily. Weekly refreshes force you to actually look at the numbers — daily refreshes just become noise.
- Duplicate the .pbix quarterly. Save a snapshot at quarter-end so you can compare Q1 margins to Q2 margins without overwriting historical data.
- Learn one new DAX measure per quarter. The Microsoft DAX reference is the authoritative source. Start with CALCULATE and time-intelligence functions.
Explore Relevant Templates
- Freelance Developer Dashboard in Excel — same report structure in Excel for teams without Power BI
- Property Management Dashboard in Power BI — another Project Management Power BI report
- Pharmacy Dashboard in Power BI — vertical-specific Power BI report with stock, billing, and staff analysis
- Blog: Freelance Developer Dashboard in Excel — detailed walkthrough of the Excel counterpart
- Browse all Power BI Dashboards on NextGenTemplates
Frequently Asked Questions
What KPIs does the Freelance Developer Dashboard in Power BI track?
The Freelance Developer Dashboard in Power BI tracks 5 headline KPIs — Total Revenue, Total Projects, Net Income, Total Expenses, and Total Hours Worked — plus 13 supporting visuals across Overview, Client Analysis, Project Insights, Revenue Trends, and Performance pages. All metrics update automatically when you refresh the report with your own project data.
Do I need a paid Power BI licence?
No. The Freelance Developer Dashboard in Power BI works in the free Power BI Desktop app from Microsoft. A paid Power BI Pro or Premium licence is only required if you want to publish the report to the Power BI Service and share it with teammates. For solo use on your own machine, the free Desktop app is enough.
How long does setup take?
Setup takes under 10 minutes. Download the .pbix from your purchase email, open it in Power BI Desktop, repoint the data source to your own Excel or CSV project log, and click Refresh. Every KPI card and chart across all 5 report pages updates automatically — no DAX rewrites required.
How does this compare to HoneyBook, Bonsai, or Tableau?
HoneyBook and Bonsai cost $20-40 per user per month and lock your data in a vendor cloud. Tableau Creator runs $70-90 per month. The Freelance Developer Dashboard in Power BI is a one-time $17.99 purchase that runs offline on free Power BI Desktop, gives you full control over every DAX measure, and has no per-user fees. It does not send invoices — pair it with an invoice template for that.
Can I add my own columns and measures?
Yes. The Freelance Developer Dashboard in Power BI uses a standard Power BI data model with named tables and reusable DAX measures. Add columns to the source table, refresh the model, and drag new fields into existing visuals. New DAX measures can be written in minutes using the same pattern as Total Revenue, Net Income, and Profit Margin.
Does the dashboard work offline?
Yes. The Freelance Developer Dashboard in Power BI runs offline in Power BI Desktop on any Windows computer. No internet connection, cloud account, or publish step is required. You can optionally publish the .pbix to the Power BI Service if you want to view the report on mobile or share with a team.
Is this template suitable for small agencies?
Yes. The Freelance Developer Dashboard in Power BI works well for solo developers and small dev agencies up to 5 people. Use the Client column to tag which developer owns each project, or save a separate .pbix per team member and consolidate monthly. For 10+ person agencies, a Power BI Pro workspace with row-level security is usually a better fit.
About the Author
Built by PK — Microsoft Certified Professional with 15+ years of Excel, Google Sheets, and Power BI experience. Founder of NextGenTemplates, reaching 300K+ subscribers across YouTube channels. Every template is hand-built and tested before release.
Conclusion
The Freelance Developer Dashboard in Power BI gives solo developers and small dev agencies a single Power BI report that answers the questions that actually matter — which clients pay best, which stacks are profitable, which months are under pressure, and where every hour went. It replaces $240-1,080 per year of SaaS subscriptions with a one-time $17.99 purchase that runs offline in free Power BI Desktop.
👉 Click here to Purchase Freelance Developer Dashboard in Power BI
✅ Instant download · One-time payment · No subscription
🎥 For step-by-step video tutorials, visit Youtube.com/@PK-AnExcelExpert
📅 Last updated: April 2026