Tracking revenue, expenses, and profitability across 20-500 freelance projects a year is a problem almost every self-employed developer runs into. Most turn to Notion, Airtable, or $29/month SaaS tools — then struggle to get a clean P&L or see which client is actually paying the bills. The Freelance Developer Dashboard in Excel solves that with a single .xlsx file that monitors 5 headline KPIs and renders 18+ charts across 5 interactive analysis pages. Setup takes under 5 minutes. No subscriptions. No per-user fees.
This dashboard is built for solo freelance developers and small agencies (1-5 people) working on Upwork, Fiverr, Toptal, LinkedIn, or direct-client projects. It uses standard Excel pivot tables connected to a hidden Support Sheet, so every chart auto-refreshes when you update the Data Sheet. Below is a full walkthrough of every page, how it compares to paid alternatives like HoneyBook and Bonsai, and how to use it.
Key Features of the Freelance Developer Dashboard in Excel
The Freelance Developer Dashboard in Excel tracks 5 headline KPIs: Total Revenue, Net Income, Total Records, Total Hours Worked, and Avg. Satisfaction. All KPI cards recalculate when slicers are applied, so you can filter the entire dashboard to a single client, status, or technology stack in two clicks.
The dashboard ships with 18+ charts distributed across 5 analysis pages. Each page is focused on a specific business question — client profitability, project-level insights, revenue trends, or performance outcomes. This keeps every page readable instead of crowding 15 charts into one tab.
All charts are powered by standard Excel pivot tables stored on a hidden Support Sheet. When you paste new data into the Data Sheet and click Data → Refresh All, the entire dashboard rebuilds in under 2 seconds. No VBA, no formulas to edit.
Dashboard Pages Explanation
1. Overview Page
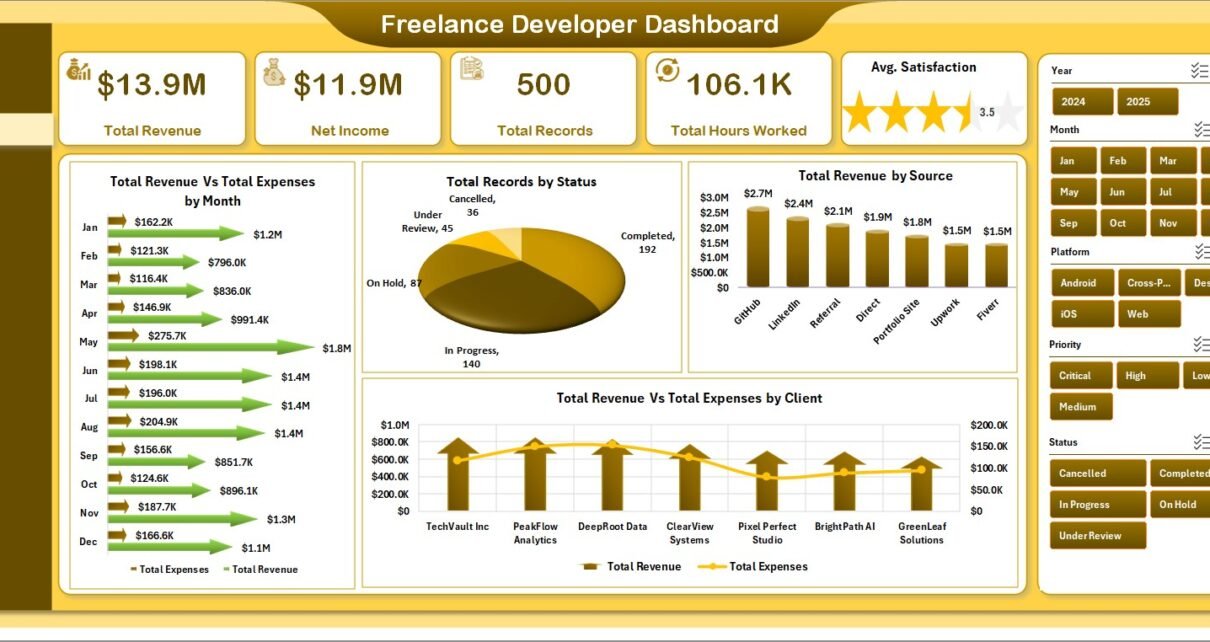
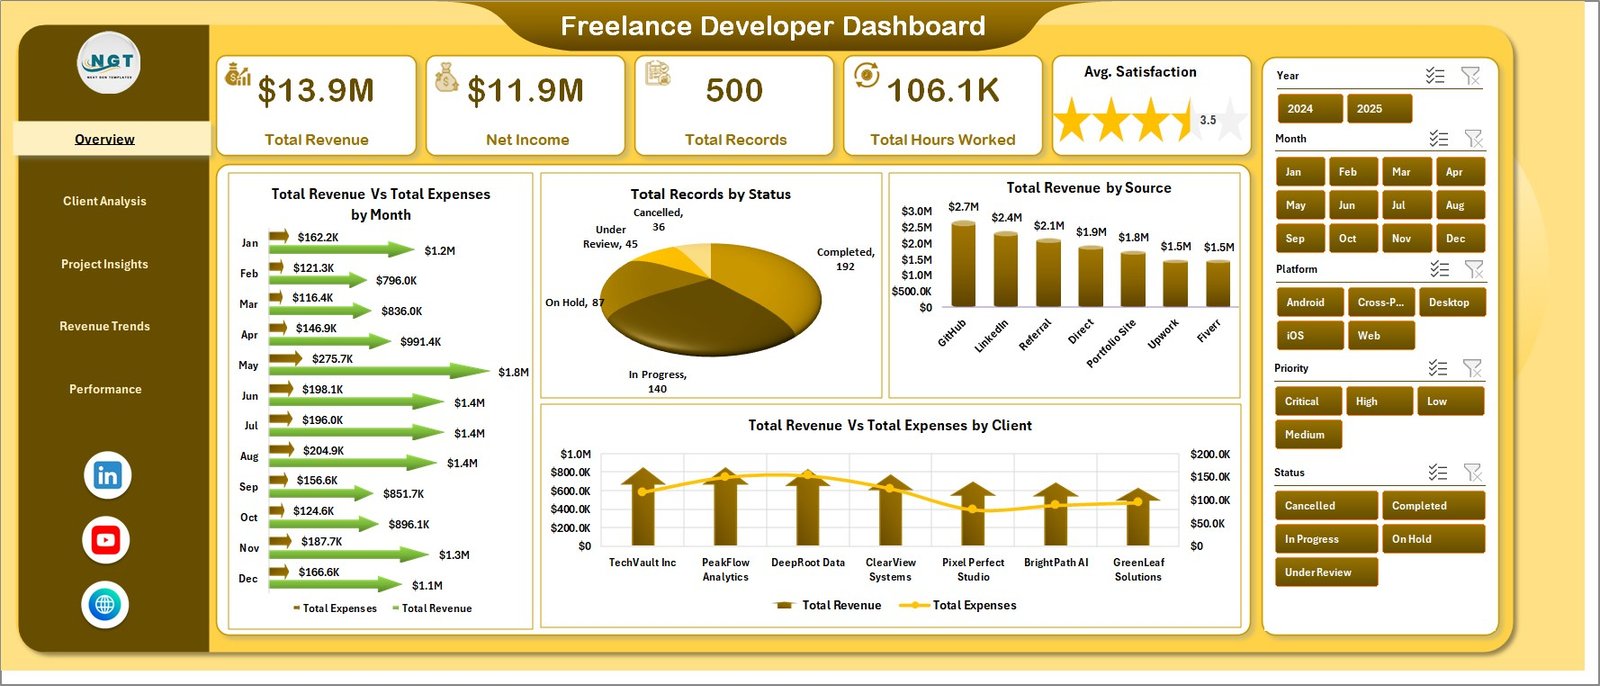
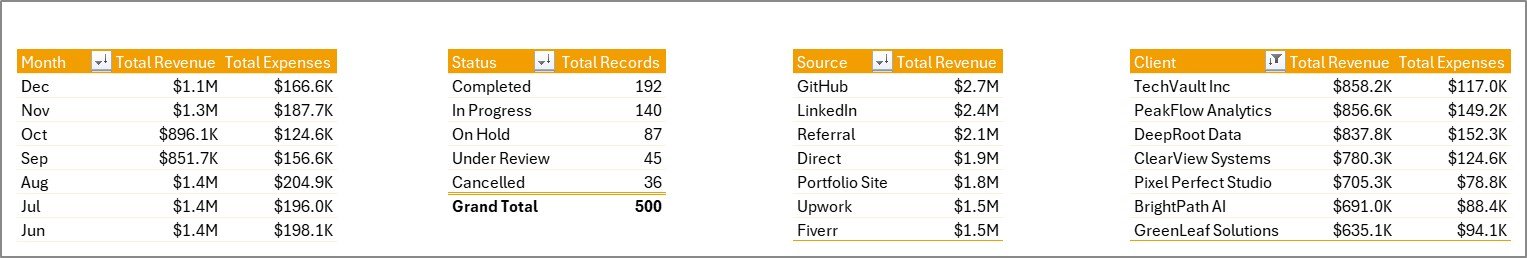
The Overview page is the command center. Five KPI cards at the top — Total Revenue, Net Income, Total Records, Total Hours Worked, and Avg. Satisfaction — summarize the entire dataset. Multiple slicers at the top of the page let you filter everything below with one click.
- Total Revenue Vs Total Expenses by Month — Monthly income vs. expenses trend to spot cash-flow gaps.
- Total Records by Status — Project counts by Completed, In Progress, Cancelled, and On Hold.
- Total Revenue by Source — Revenue breakdown by Upwork, Referral, LinkedIn, Direct, and other lead channels.
- Total Revenue Vs Total Expenses by Client — Profitability ranking per client so you see which relationships are worth keeping.
2. Client Analysis
This sheet drills into client-level performance so you know who pays, who delays, and who deserves a raise in rates.
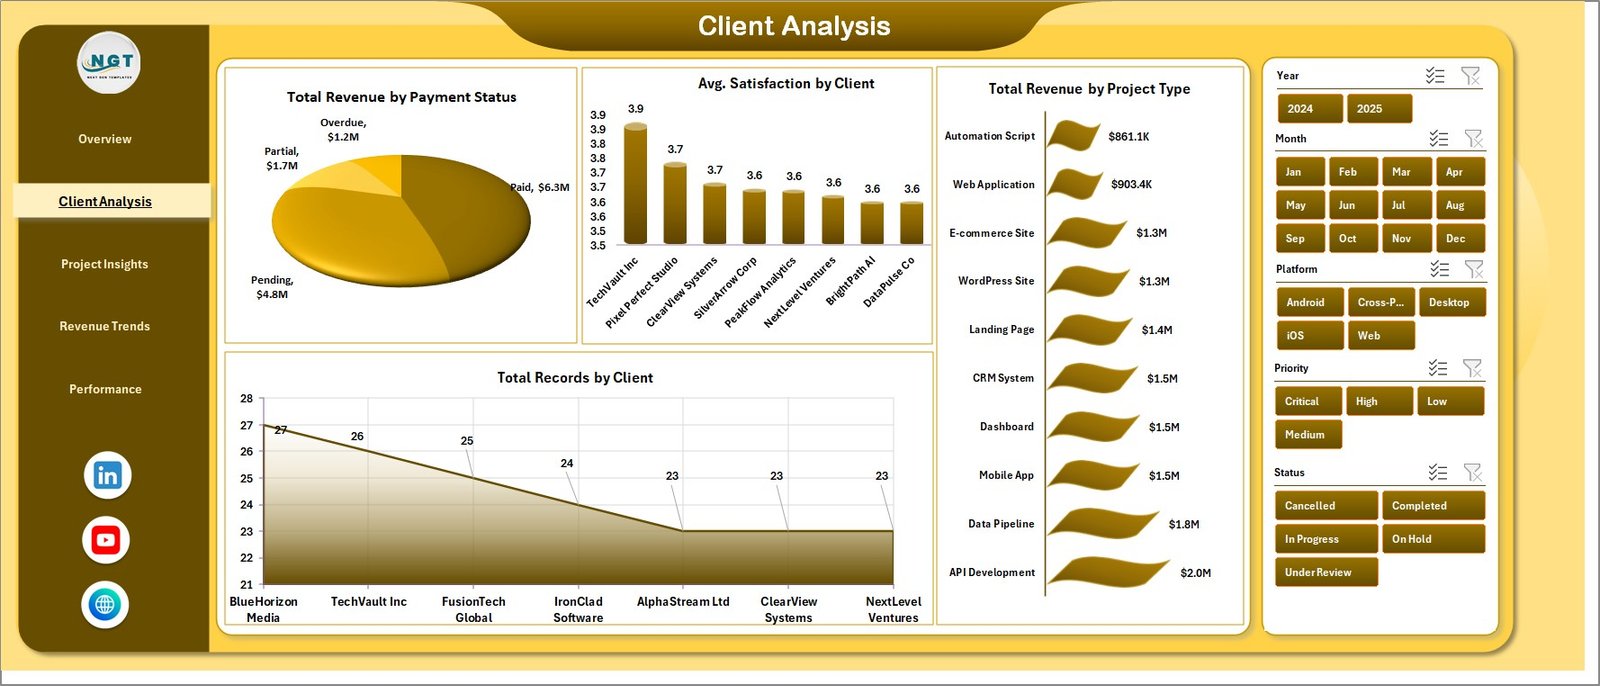
- Total Revenue by Payment Status — How much is Paid, Pending, and Overdue.
- Avg. Satisfaction by Client — Satisfaction score per client so you spot churn risk early.
- Total Revenue by Project Type — Revenue comparison across Web App, Mobile App, API, and Landing Page work.
- Total Records by Client — Project count per client, revealing your most loyal accounts.
3. Project Insights
Project Insights looks at the work itself — where it came from, what stack you used, and how efficient you were.
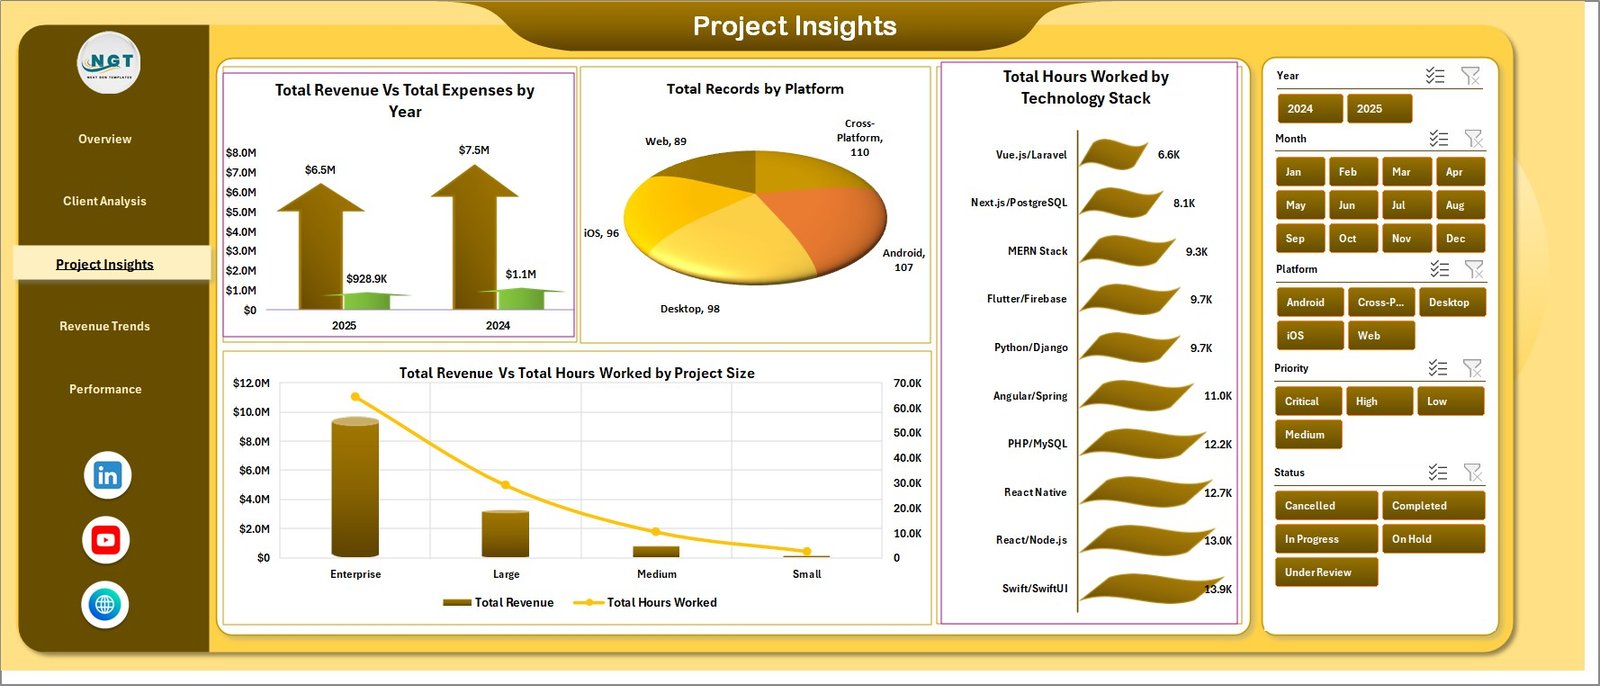
- Total Revenue Vs Total Expenses by Year — Year-over-year P&L view for scaling decisions.
- Total Records by Platform — Projects sourced from Upwork, Fiverr, Toptal, Direct, LinkedIn.
- Total Hours Worked by Technology Stack — Hours spent across React, Python, Node.js, .NET, Flutter.
- Total Revenue Vs Total Hours Worked by Project Size — Effective hourly rate across Small, Medium, and Large projects.
4. Revenue Trends
Revenue Trends surfaces time-based patterns and hidden opportunities in your pipeline.
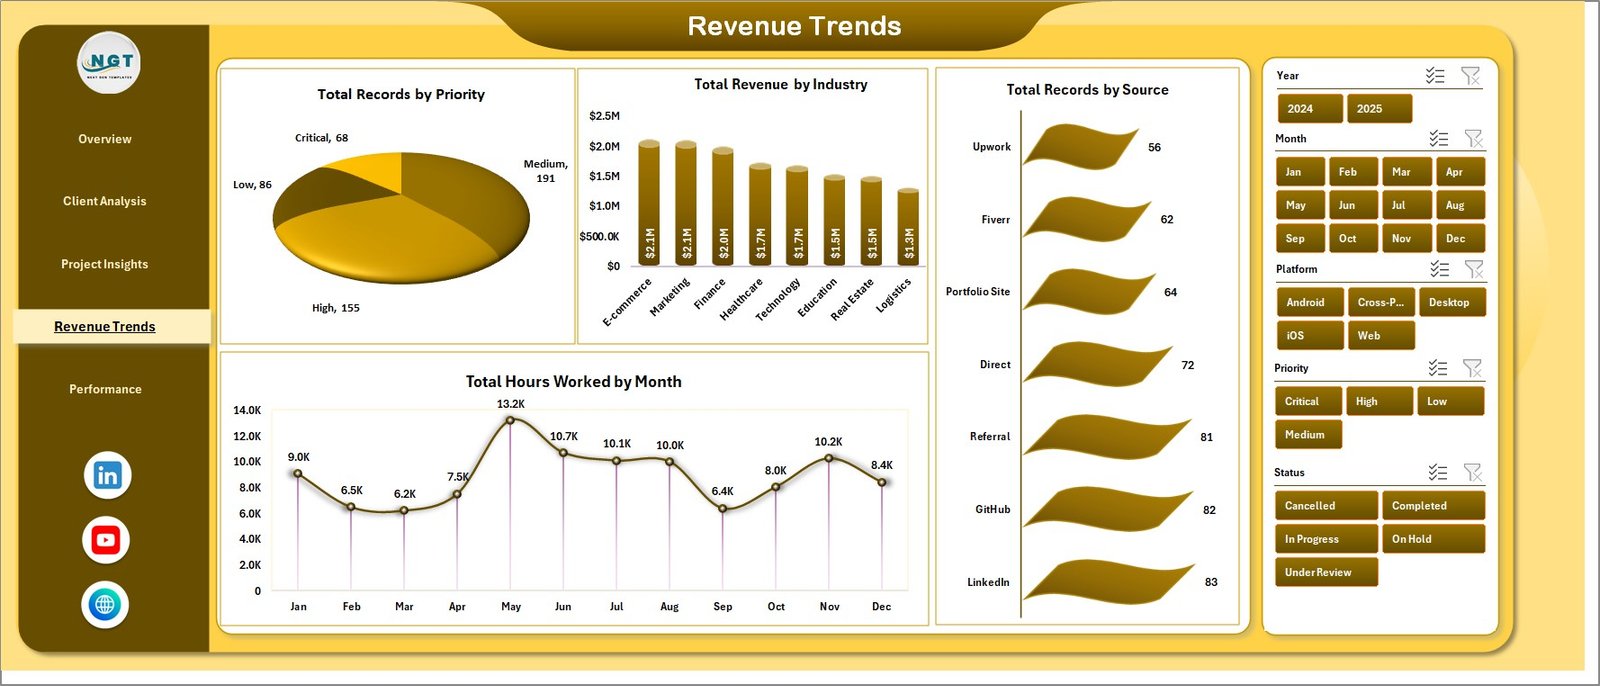
- Total Records by Priority — High, Medium, Low priority project counts.
- Total Revenue by Industry — SaaS, E-commerce, Fintech, Healthcare, EdTech revenue split.
- Total Records by Source — Project counts by acquisition channel.
- Total Hours Worked by Month — Monthly workload to plan capacity.
5. Performance
The Performance tab ties everything back to outcomes.
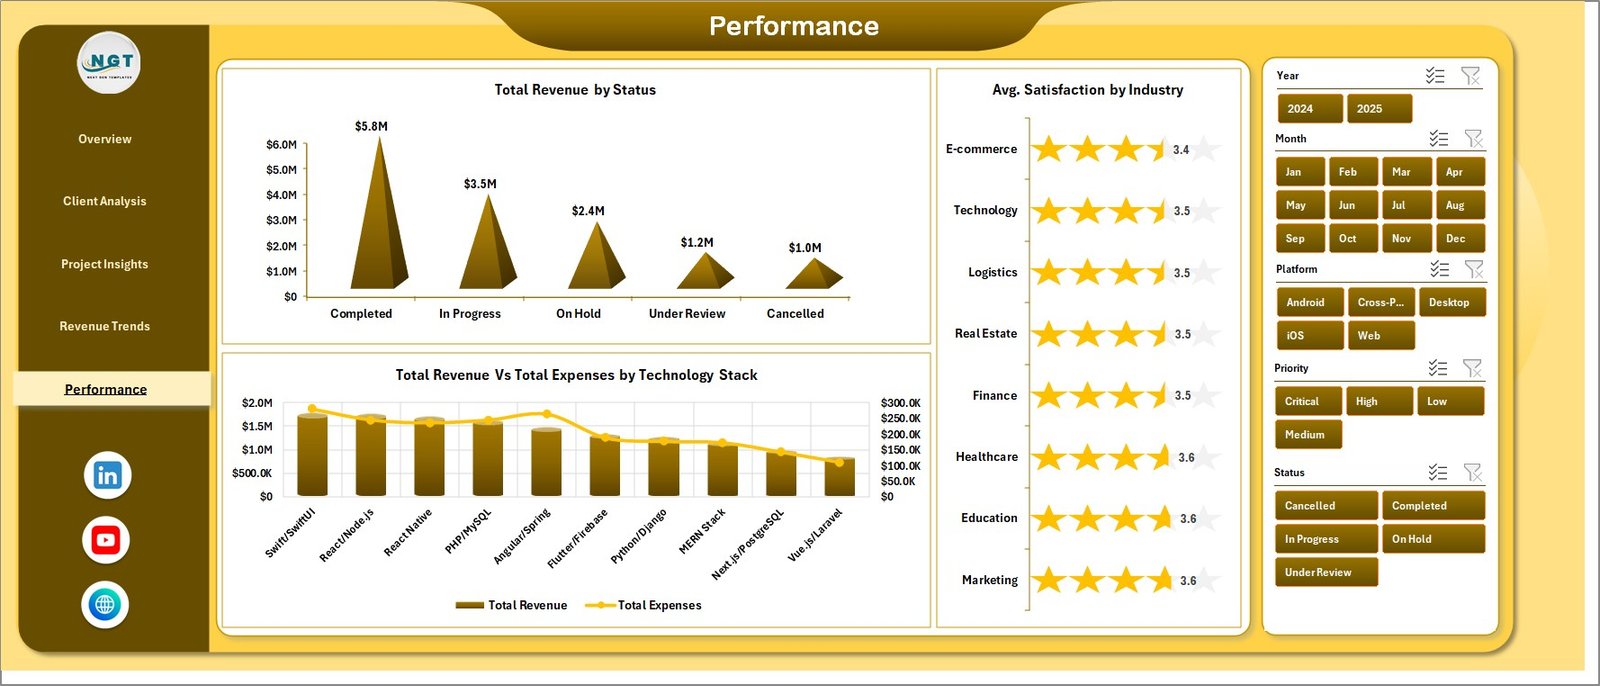
- Total Revenue by Status — Revenue split across Completed, In Progress, Cancelled, On Hold.
- Avg. Satisfaction by Industry — Which verticals rate your work highest.
- Total Revenue Vs Total Expenses by Technology Stack — Real profitability after infrastructure and tooling costs per stack.
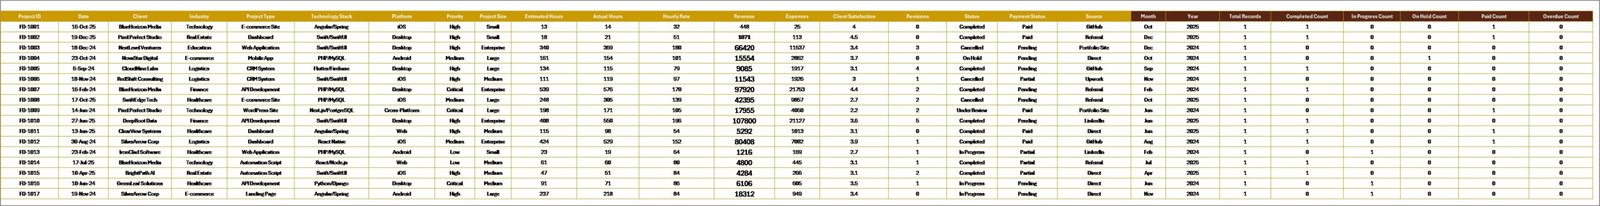
6. Data Sheet
The Data Sheet is where you paste or type your freelance records in the same column structure — Client, Status, Source, Project Type, Industry, Technology Stack, Hours Worked, Revenue, Expenses, Satisfaction, Payment Status, and more.
7. Support Sheet
A hidden sheet holding every pivot table that drives the dashboard. After adding new data, go to Data → Refresh All and every chart and KPI card updates automatically. Keep this sheet hidden during day-to-day use.
Freelance Developer Dashboard in Excel vs. Google Sheets Dashboard vs. HoneyBook / Bonsai — Feature Comparison
| Feature | Freelance Developer Dashboard in Excel | Google Sheets Equivalent | HoneyBook / Bonsai / FreshBooks |
|---|---|---|---|
| Cost | $17.99 one-time | $9.99 one-time | $20-40 / user / month |
| Platform | Microsoft Excel (offline) | Google Sheets (cloud) | Proprietary cloud SaaS |
| Setup time | Under 5 minutes | Under 5 minutes | 1-2 hours + onboarding |
| Slicers & pivot refresh | ✅ Built-in | Partial (filter views) | N/A (prebuilt views only) |
| Works offline | ✅ Yes | No (needs internet) | No (needs internet) |
| Customizable fields | ✅ Full control | ✅ Full control | Limited to vendor schema |
| Multi-user real-time | Via OneDrive/365 | ✅ Native | ✅ Native |
| Year-1 cost at 1 user | $17.99 | $9.99 | $240-480 |
| Client invoicing built-in | No (pair with invoice template) | No | ✅ Yes |
For solo developers who want a fast, private, Excel-native revenue + project view without a $30/month subscription, the Freelance Developer Dashboard in Excel sits in the sweet spot.
Who Should Use This Template
Perfect for:
- Solo freelance web, mobile, and full-stack developers tracking 20-500 projects per year
- Indie hackers and contractors on Upwork, Fiverr, Toptal, or direct clients
- Small agencies (1-5 people) who want one file summarizing revenue, hours, and client health
- Developers migrating off Notion or Airtable dashboards who want full Excel control
Not a fit if:
- You run a 10+ person agency needing role-based access and SSO
- You need automatic invoice sending, payment gateways, or client portals
- You don’t have Microsoft Excel 2016 or later
Real-World Use Cases
Aarav is a full-stack freelance developer in Bengaluru. He juggles 8-12 projects per quarter across Upwork and direct clients. Using the Freelance Developer Dashboard in Excel, he opens the file each Monday, checks Total Revenue by Source, and decides whether to pitch more on Upwork or double down on LinkedIn outreach — without paying $29/month for HoneyBook. In his first three months using the dashboard, he identified that LinkedIn outreach was generating 2.3x the revenue per hour of Upwork bids and rebalanced his business development time accordingly.
Priya runs a 3-person React agency in Pune. She uses the dashboard to track which technology stack (React, Next.js, React Native) generates the highest revenue per hour. The Total Revenue Vs Total Hours Worked by Project Size chart helped her increase her minimum project size from $2,000 to $5,000 within one quarter because she could see the effective hourly rate on small projects was dragging her margins down.
Marcus is an indie mobile developer in Berlin. He used to track everything in Notion but found reporting painful. With the Freelance Developer Dashboard in Excel, he pastes Clockify exports into the Data Sheet, clicks Refresh All, and gets a client-by-client P&L in seconds. His quarterly review with his accountant now takes 30 minutes instead of 3 hours.
Advantages of the Freelance Developer Dashboard in Excel
Cost efficiency. A one-time $17.99 payment replaces a $20-40/month SaaS subscription. Over 3 years, that’s $700-1,400 saved versus HoneyBook or Bonsai. No per-user fees if you add a collaborator.
Data ownership. Every project record sits on your computer in a standard .xlsx file. No vendor can deprecate your data, change pricing, or lock you into a yearly contract. Back up to OneDrive, Google Drive, or a USB stick — your call.
Instant customization. Unlike SaaS products with fixed schemas, you can add, rename, or remove columns in the Data Sheet and refresh the pivot cache to propagate changes across every chart and KPI.
Zero learning curve for developers. If you already know how to paste data into Excel and click Refresh, you’re done. The dashboard uses no VBA, no macros, and no Power Query — just standard pivots.
Opportunities for Improvement
Honest assessment — the Freelance Developer Dashboard in Excel is a reporting and analysis tool, not a full freelance business system. It does not handle:
- Invoicing and payment collection. Pair it with a dedicated Excel invoice template if you need automated invoice sending.
- Time tracking automation. You’ll still need Clockify, Toggl, or a similar tool to capture hours — then export to the Data Sheet.
- Client communication. No email, proposal, or contract modules. Use a separate CRM or template for that.
- Real-time multi-user editing. Excel’s co-authoring via OneDrive/365 works, but it’s not as seamless as Google Sheets for simultaneous edits.
If any of these capabilities are deal-breakers, a full SaaS product like HoneyBook or Bonsai may be worth the monthly cost. For most solo developers, the trade-off favors the Excel dashboard.
Best Practices
Log entries weekly, not monthly. Entering 20+ projects at once from memory leads to inaccurate hours and missed expenses. A 10-minute Friday habit keeps data clean and dashboards honest.
Use the Payment Status column religiously. Mark invoices Paid, Pending, or Overdue the moment status changes. The Total Revenue by Payment Status chart on the Client Analysis page turns into your collections priority list.
Review Technology Stack profitability quarterly. The Total Revenue Vs Total Expenses by Technology Stack chart on the Performance tab reveals which stacks are margin killers (heavy infrastructure costs, paid APIs) and which ones print money.
Save a dated snapshot at quarter-end. File → Save As → append the quarter (e.g., Freelance-Dashboard-Q1-2026.xlsx). Gives you a permanent audit trail and makes year-over-year comparisons easy.
Explore Relevant Templates
- Freelance Developer Dashboard in Excel — the template this post is about
- Freelancer Business Dashboard in Excel — broader view covering income, pipeline, and client-level P&L
- Freelancer Business Dashboard in Power BI — same data model in Power BI for larger datasets
- Freelancer Business Dashboard in Google Sheets — Google Sheets version for teams already on Google Workspace
- Browse all Excel Dashboards — 600+ production-grade Excel dashboards
Frequently Asked Questions
What KPIs does the Freelance Developer Dashboard in Excel track?
The Freelance Developer Dashboard in Excel tracks 5 headline KPIs — Total Revenue, Net Income, Total Records, Total Hours Worked, and Avg. Satisfaction — plus 18+ supporting charts across Client Analysis, Project Insights, Revenue Trends, and Performance tabs. All metrics update automatically when you replace the sample data with your own.
Which Excel version do I need to run this dashboard?
The Freelance Developer Dashboard in Excel works in Microsoft Excel 2016 and later. Excel 365 is recommended for the best slicer and pivot-refresh performance. The file does not use VBA, so no macro warnings appear and no security settings need to be adjusted on your machine.
How long does setup actually take?
Setup for the Freelance Developer Dashboard in Excel takes under 5 minutes. Open the .xlsx file, go to the Data Sheet, paste your freelance project records in the same column format, then click Data → Refresh All. Every KPI card and chart across all 5 dashboard pages updates instantly.
How does this compare to HoneyBook or Bonsai?
HoneyBook and Bonsai cost $20-40 per user per month and lock your data in a vendor cloud. The Freelance Developer Dashboard in Excel is a one-time $17.99 purchase that runs offline on Excel, gives you full control of every column and chart, and has no per-user fees. It does not send invoices — pair it with a separate Excel invoice template for that.
Can I customize the Data Sheet columns?
Yes. The Freelance Developer Dashboard in Excel uses standard Excel pivot tables on a Support Sheet. If you add a new column, refresh the pivot cache from the Support Sheet and drag the new field into any pivot layout. If you remove a column that a pivot references, just delete that field from the pivot.
Does the dashboard work offline?
Yes, the Freelance Developer Dashboard in Excel runs completely offline on any computer with Microsoft Excel 2016 or later. No internet connection, no account signup, and no cloud sync is required. You can sync manually via OneDrive or SharePoint if you want multi-device access.
Is this suitable for a 3-5 person agency?
Yes. The Freelance Developer Dashboard in Excel works well for solo developers and small agencies up to 5 people. Use the Client column to tag which developer owns which project, or save a separate copy per team member and consolidate monthly. For 10+ person agencies, a multi-user SaaS is usually a better fit.
About the Author
Built by PK — Microsoft Certified Professional with 15+ years of Excel, Google Sheets, and Power BI experience. Founder of NextGenTemplates, reaching 300K+ subscribers across YouTube channels. Every template is hand-built and tested before release.
Conclusion
The Freelance Developer Dashboard in Excel replaces a $20-40/month SaaS subscription with a one-time $17.99 purchase that runs offline on Microsoft Excel. It tracks 5 headline KPIs and renders 18+ charts across 5 interactive analysis pages, all powered by standard pivot tables you can fully customize.
👉 Click here to Purchase the Freelance Developer Dashboard in Excel
✅ Instant download · One-time payment · No subscription
For video walkthroughs, visit YouTube.com/@PK-AnExcelExpert.
📅 Last updated: April 2026