Corporate secretarial teams manage filing deadlines, board and entity records, service work, penalties, review hours, client expectations, and audit readiness across many moving parts. A missed filing can create financial penalties and reputational risk, while scattered spreadsheets make it difficult to explain the full picture in management meetings.
The Corporate Secretarial Dashboard in Power BI solves that reporting problem with a 5-page .pbix dashboard built for company secretaries, legal operations teams, governance consultants, and compliance service providers. It tracks Total Service Fee, Total Penalty Amount, Total Filings, Total Direct Cost, Net Service Margin, filing status, service type, jurisdiction, responsible officer, priority, and compliance category in one interactive report.
Power BI Desktop is free to use locally, and Microsoft explains the core workflow in its official Power BI Desktop documentation. This template follows that practical workflow: open the .pbix file, replace the sample data source, refresh the model, and review the dashboard pages using slicers and visuals.
Key Features of Corporate Secretarial Dashboard in Power BI
- 5 interactive Power BI pages for Overview, Filing Trends, Client Analysis, Officer Workload, and Compliance Risk.
- 5 top-level KPI cards showing Total Service Fee, Total Penalty Amount, Total Filings, Total Direct Cost, and Net Service Margin.
- 16+ chart views covering filing status, service type, month, quarter, client type, responsible officer, jurisdiction, priority, and compliance category.
- Multiple slicers for quick filtering without rebuilding visuals or pivot tables.
- Editable .pbix file so users can customize fields, page titles, chart colors, measures, and report layouts.
- Compliance and workload focus across fees, penalties, review hours, service completion, officer effort, and client satisfaction.
Dashboard Pages Explanation
1. Overview Page
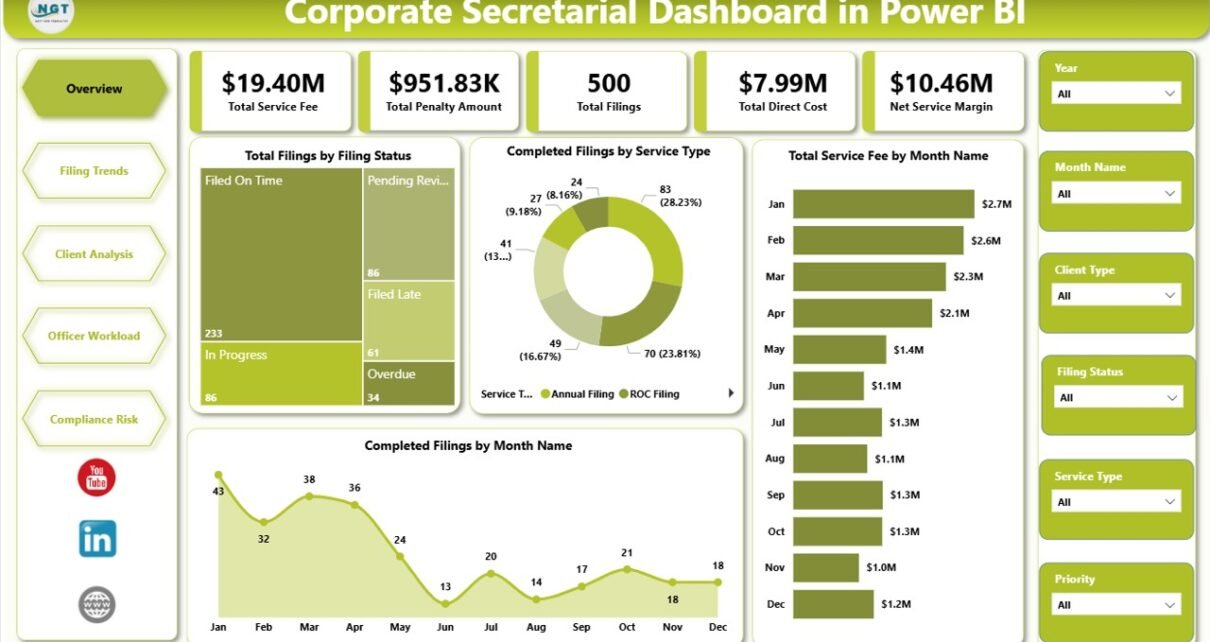
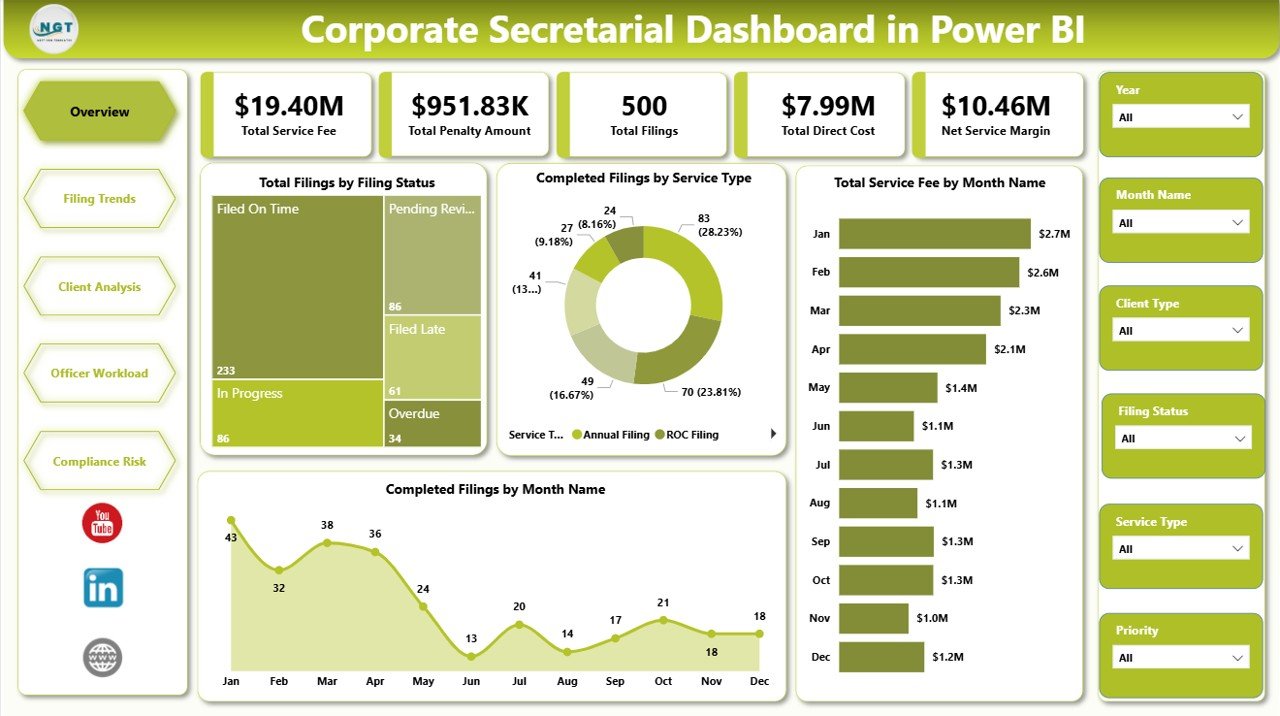
The Overview Page is the management summary of the dashboard. Cards at the top show Total Service Fee, Total Penalty Amount, Total Filings, Total Direct Cost, and Net Service Margin so users can quickly understand volume, revenue, cost, and risk exposure.
Total Filings by Filing Status: This chart compares filings across status groups such as completed, pending, delayed, or under review. It helps teams identify backlog and risk areas without scanning the raw filing register.
Completed Filings by Service Type: This view explains which corporate secretarial services are completed most often. It supports capacity planning and shows where recurring secretarial effort is concentrated.
Total Service Fee by Month Name: This chart shows monthly movement in service fees. It helps leaders understand seasonal filing demand and fee concentration across the reporting year.
Completed Filings by Month Name: This chart tracks completion output month by month. It is useful for comparing delivery pace and highlighting months where completion volume changed materially.
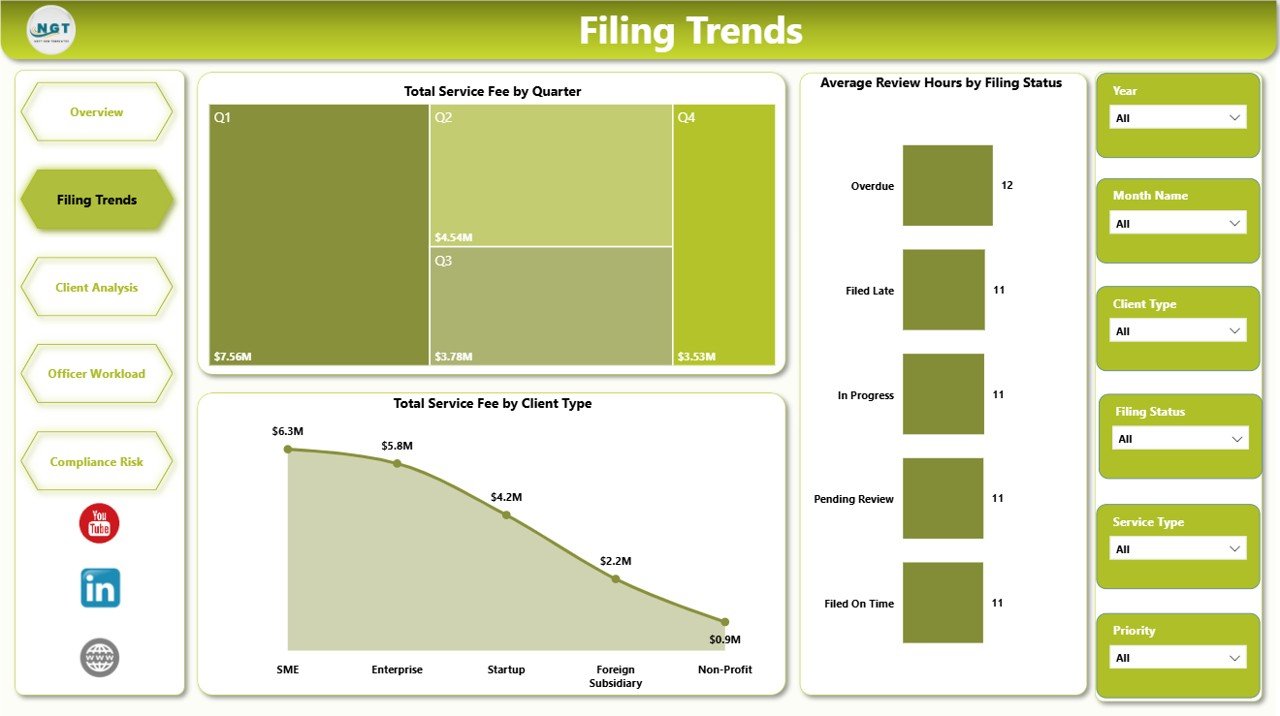
2. Filing Trends
The Filing Trends page is designed for time-based and client-type analysis. Total Service Fee by Quarter shows quarter-level fee distribution, helping teams compare reporting periods. Average Review Hours by Filing Status highlights where officer effort is being consumed. Total Service Fee by Client Type compares fee contribution across client segments, which is useful for service mix and account review discussions.
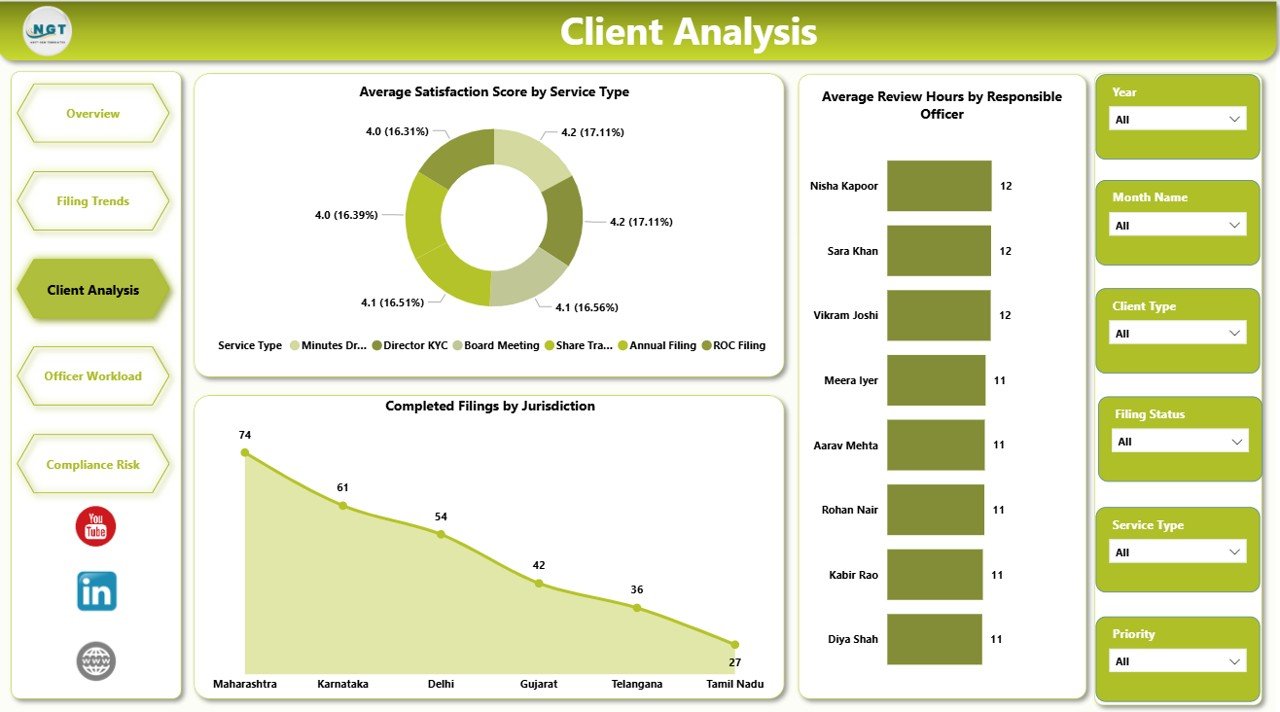
3. Client Analysis
The Client Analysis page connects client satisfaction, responsible officer effort, and jurisdiction-level completion. Average Satisfaction Score by Service Type shows which services are rated better by clients. Average Review Hours by Responsible Officer helps identify workload intensity and possible bottlenecks. Completed Filings by Jurisdiction shows where completed filings are concentrated, making it easier to review jurisdiction-wise performance.
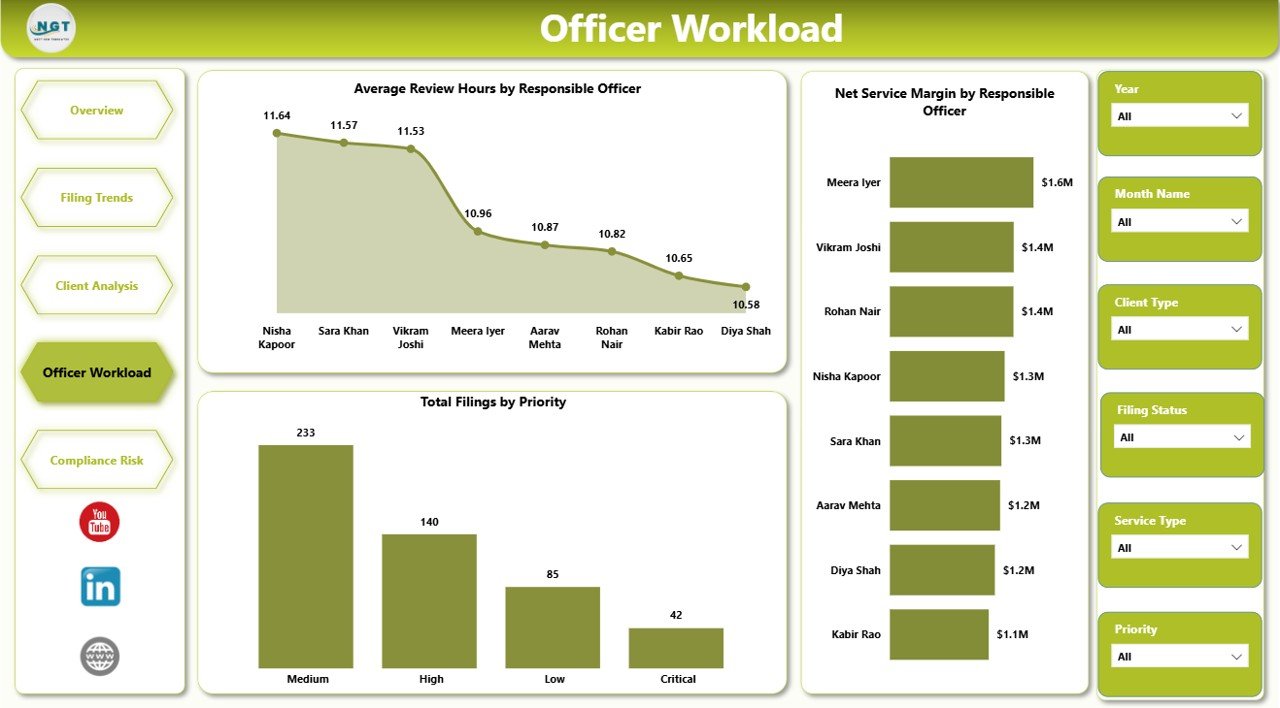
4. Officer Workload
The Officer Workload page helps managers review capacity and contribution by person. Average Review Hours by Responsible Officer shows where review work is concentrated. Net Service Margin by Responsible Officer compares financial contribution after direct cost. Total Filings by Priority explains how much work is tied to high, medium, or low priority filings.
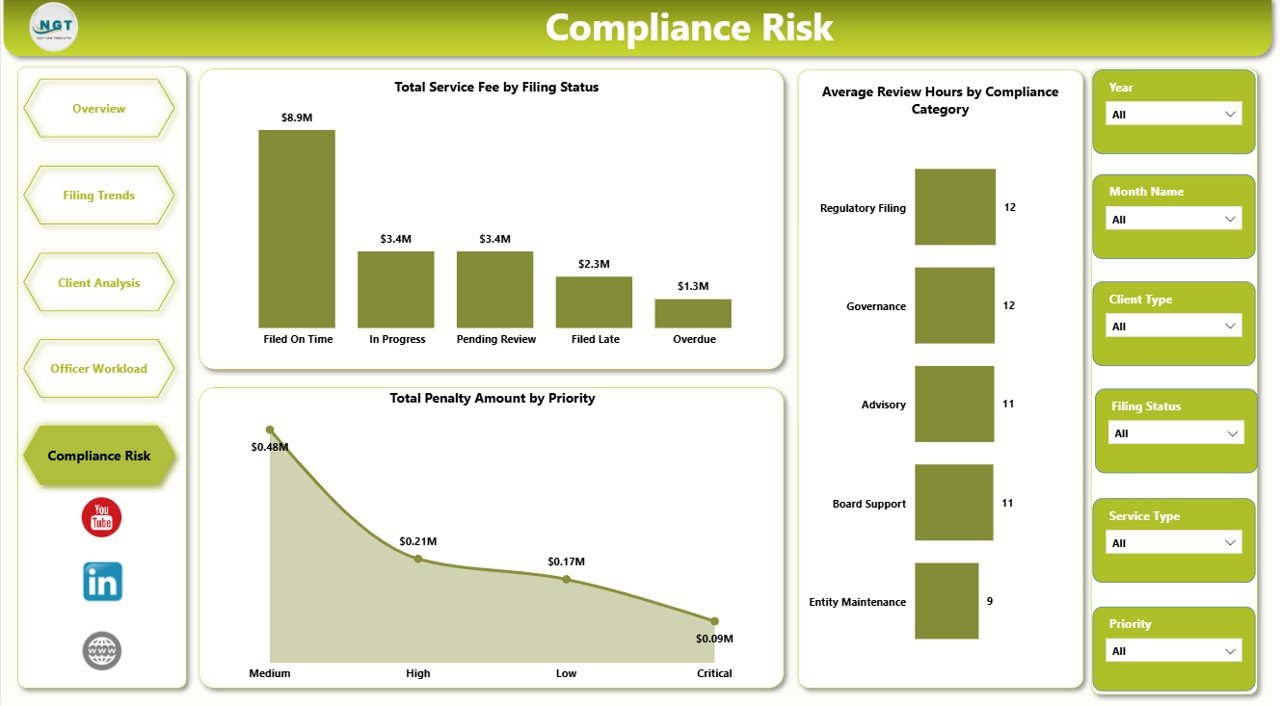
5. Compliance Risk
The Compliance Risk page focuses on exposure and control. Total Service Fee by Filing Status shows the financial value tied to each filing status. Average Review Hours by Compliance Category helps identify categories that require deeper review. Total Penalty Amount by Priority connects penalties with priority levels so teams can focus on the work that creates the highest risk.
Corporate Secretarial Dashboard in Power BI vs. Tableau vs. Paid CRM/SaaS – Feature Comparison
| Feature | Corporate Secretarial Dashboard in Power BI | Tableau Alternative | Paid Compliance SaaS |
|---|---|---|---|
| Cost | $17.99 one-time | License cost plus build time | $50-$500+ per month |
| Platform | Power BI Desktop | Tableau Desktop or Cloud | Vendor cloud app |
| Setup time | Open file, connect data, refresh | Manual dashboard design needed | Onboarding and permissions setup |
| Real-time team collaboration | Available if published to Power BI Service | Available in Tableau Cloud | Usually seat-based |
| Mobile access | Available through Power BI Service | Available in cloud plans | Usually available |
| Customizable fields | Editable model and report pages | Editable with dashboard design work | Limited by vendor settings |
| Share with link | Possible through Power BI Service | Possible through Tableau Cloud | Often requires login |
| Year-1 cost at 5 users | $17.99 for the template | Higher license and setup cost | $3,000-$30,000+ |
| Filing and penalty analytics | Included across 5 pages | Possible with custom setup | Often included in higher plans |
Who Should Use This Template
This dashboard is useful for company secretaries, corporate secretarial teams, legal operations managers, compliance teams, governance consultants, CFO offices, and professional service firms that manage filing work for multiple clients.
It is especially helpful when a team already stores filing data in Excel, CSV, SharePoint, or another structured source and wants a polished Power BI layer for recurring management review. It is not meant to replace statutory filing portals, legal entity management software, approval workflow tools, or live government integrations.
Corporate Secretarial Dashboard in Power BI
Real-World Use Cases
Aisha, company secretary: She opens the Overview and Compliance Risk pages before a monthly governance meeting to explain filing volume, penalty exposure, and service fee movement in a structured way.
Daniel, legal operations manager: He uses Officer Workload to compare review hours and priority filing volume across responsible officers before reallocating work.
Meera, compliance consultant: She uses Client Analysis and Filing Trends to compare client types, jurisdictions, service types, and review effort across a portfolio of company accounts.
Advantages of Corporate Secretarial Dashboard in Power BI
Faster reporting: The dashboard gives users a finished report layout instead of starting from a blank Power BI canvas.
Better risk visibility: Penalty amount, priority, compliance category, filing status, and review hours are visible across the dashboard pages.
Lower cost: A one-time template is easier to approve than a monthly compliance reporting tool when the main need is visual reporting.
Editable design: Power BI users can customize pages, visuals, labels, model relationships, fields, and measures.
Opportunities for Improvement
The dashboard does not include live filing portal connections, statutory submission automation, legal approval workflow, document storage, e-signature routing, or row-level security setup. Teams with advanced needs can extend the .pbix model, connect Power Query to their own sources, publish to Power BI Service, or combine the report with their existing compliance system.
Best Practices
- Keep source column names consistent when replacing the sample data.
- Validate service fee, direct cost, net margin, penalty, and review-hour definitions before presenting the report.
- Refresh the model after each data update.
- Use slicers during review meetings to answer follow-up questions quickly.
- Save a backup before changing relationships, DAX measures, or report page layouts.
Explore Relevant Templates
Corporate Secretarial Dashboard in Power BI – purchase the Power BI dashboard template on NextGenTemplates.
Corporate Secretarial Dashboard in Excel – Excel version for spreadsheet-based teams.
Corporate Secretarial KPI Dashboard in Power BI – KPI-focused Power BI version for governance tracking.
Browse all Power BI Dashboard templates.
Frequently Asked Questions
What does the Corporate Secretarial Dashboard in Power BI track?
It tracks service fees, penalties, total filings, direct cost, net service margin, filing status, completed filings, service type, month, quarter, client type, review hours, responsible officer, jurisdiction, priority, satisfaction score, and compliance category.
Do I need Power BI Pro?
No. You can use the .pbix file locally in Power BI Desktop. Power BI Pro may be needed only if you publish and share the report through Power BI Service.
Can I use my own corporate secretarial data?
Yes. Replace the sample source with your own structured filing data, then refresh the model in Power BI Desktop.
Can I customize the dashboard?
Yes. You can customize visuals, colors, titles, fields, measures, relationships, filters, and report pages.
Does it connect directly to government filing portals?
No. This is a Power BI reporting template. It does not automate filings or connect directly to statutory portals.
Is this suitable for secretarial service providers?
Yes. Service providers can use it to analyze filing status, client type, responsible officer workload, service fees, penalties, and compliance risk across client accounts.
About the Author
Built by PK – Microsoft Certified Professional with 15+ years of Excel, Google Sheets, and Power BI experience. Founder of NextGenTemplates, reaching 300K+ subscribers across YouTube channels. Every template is hand-built and tested before release.
Conclusion
The Corporate Secretarial Dashboard in Power BI gives governance and compliance teams a clear way to review filings, fees, costs, penalties, officer workload, client analysis, and compliance risk from one editable report. If your current reporting process depends on manual summaries or scattered spreadsheets, this template gives you a faster Power BI starting point.
Visit our YouTube channel for step-by-step Excel and Power BI tutorials.