Coworking and coworkation businesses that host startup programs face a distinct analytics challenge: they need to track not just revenue, but workspace utilization rates, NPS scores by hub, and startup performance by funding stage and lead source — all in one place. According to a 2024 Global Coworking Survey, over 63% of flexible workspace operators report using spreadsheets as their primary analytics tool, yet fewer than 20% have dashboards that track NPS and workspace utilization together. The Coworkation Startups Dashboard in Excel fills exactly that gap.
This template tracks 5 executive KPI cards across 5 interactive dashboard pages with 16+ pre-built pivot-driven charts and dynamic slicers — covering every dimension from regional gross profit to high NPS % by industry. Whether you manage one coworkation hub or a network across multiple cities, this $17.99 one-time purchase replaces the patchwork of spreadsheets and manual reports most coworkation operators rely on.
Key Features of Coworkation Startups Dashboard in Excel
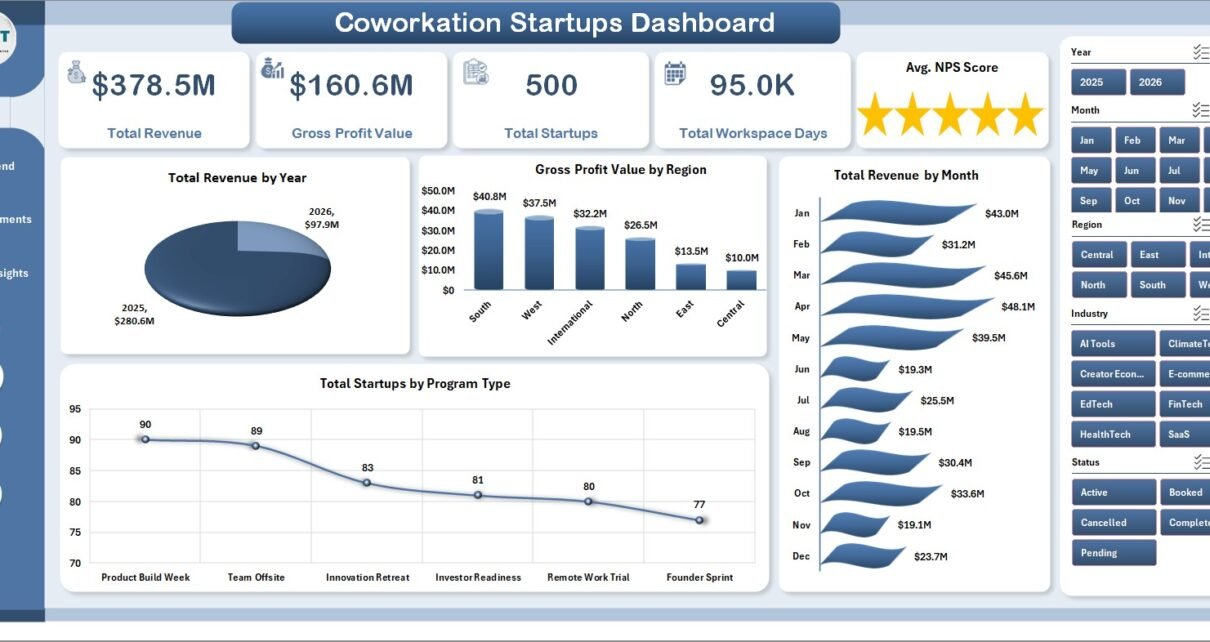
The Coworkation Startups Dashboard in Excel tracks 5 core KPIs — Total Revenue, Gross Profit Value, Total Startups, Total Workspace Days, and Avg. NPS Score — across 5 dedicated analysis pages. It includes 16+ pre-built charts covering revenue by year and month, gross profit by region, startup program type analysis, NPS by coworkation hub, workspace utilization %, and city-level market segmentation.
- All charts powered by pivot tables — refresh with one click after updating data in the Data Sheet
- Dynamic slicers let you filter all charts instantly by program type, region, hub, city, funding stage, or status
- 5 interactive dashboard pages covering Overview, Booking Trend, Market Segments, Program Insights, and Experience Quality
- Data Sheet accepts unlimited rows in a structured column format
- Support Sheet contains all pivot tables and can be hidden during day-to-day use
- No macros required — uses only native Excel pivot tables, slicers, and charts
- Works in Excel 2016, 2019, 2021, and Microsoft 365
Dashboard Pages Explanation
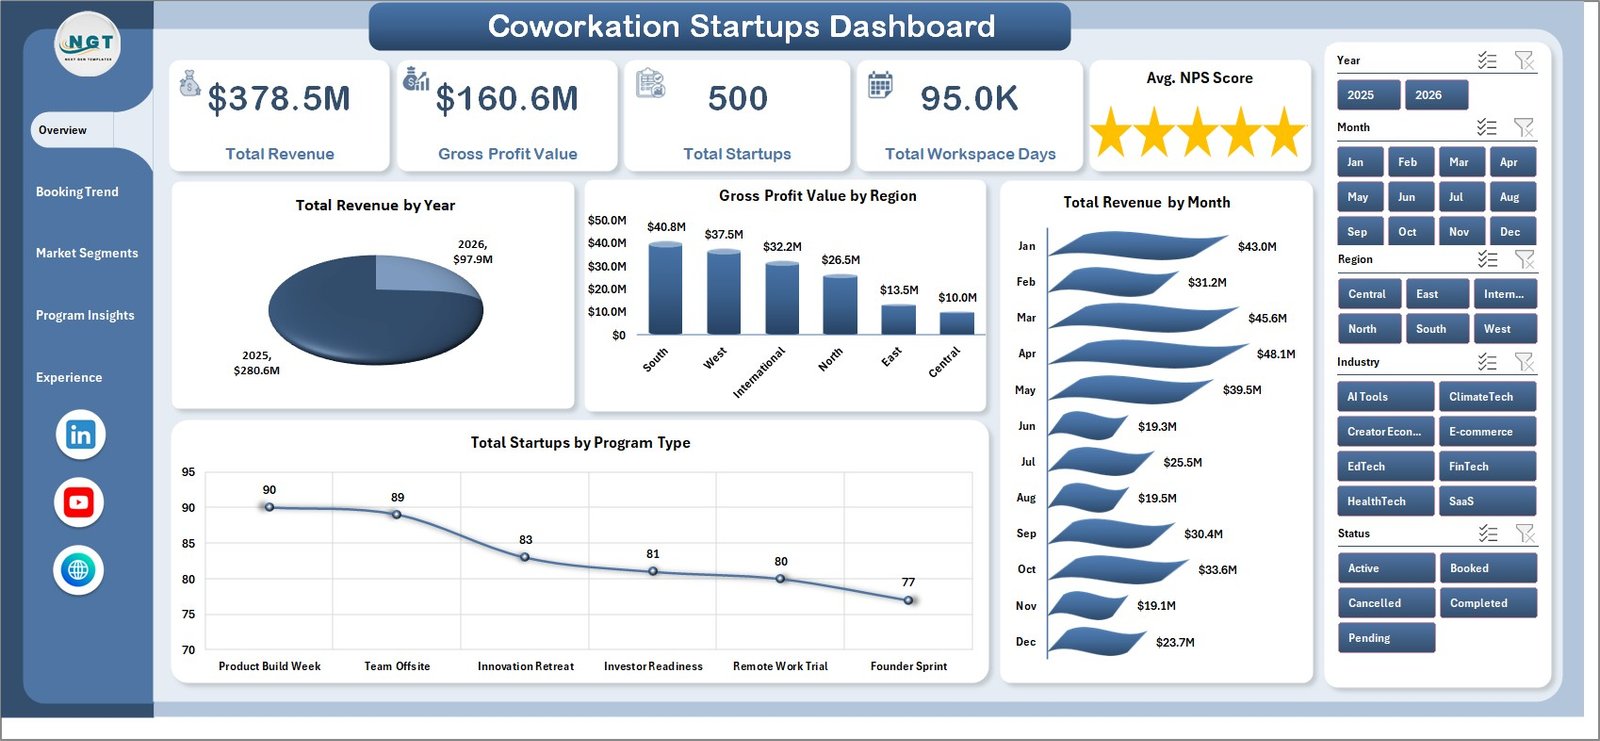
Page 1: Overview
The Overview page shows high-level KPI cards for Total Revenue, Gross Profit Value, Total Startups, Total Workspace Days, and Avg. NPS Score. Charts include Total Revenue by Year, Gross Profit Value by Region, Total Revenue by Month, and Total Startups by Program Type. Dynamic slicers let you filter the entire dashboard instantly by any key dimension.
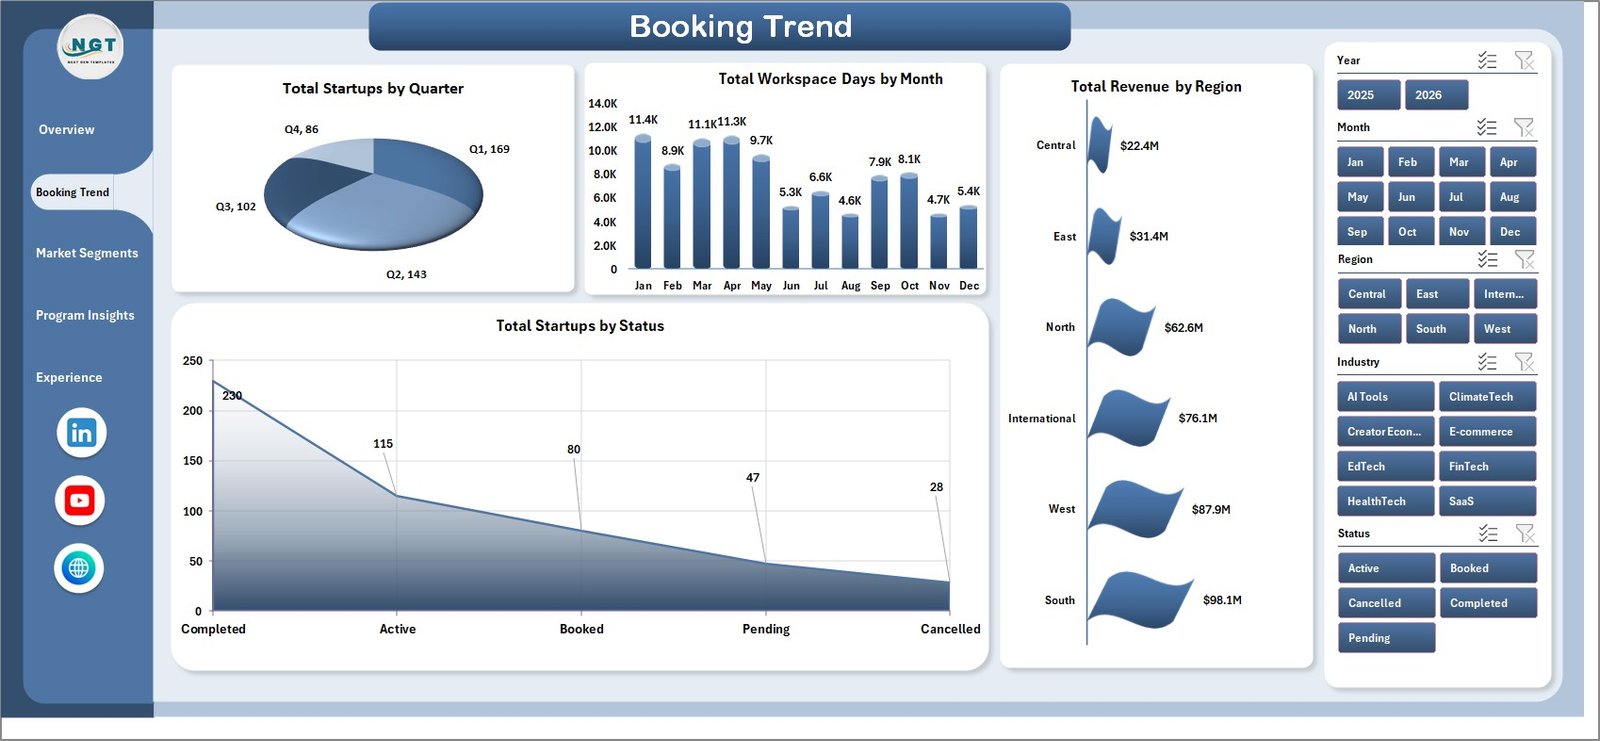
Page 2: Booking Trend
The Booking Trend page analyzes startup booking patterns and revenue distribution with charts for Total Startups by Quarter, Total Workspace Days by Month, Total Revenue by Region, and Total Startups by Status — giving coworkation hub managers a clear picture of booking seasonality and program momentum over time.
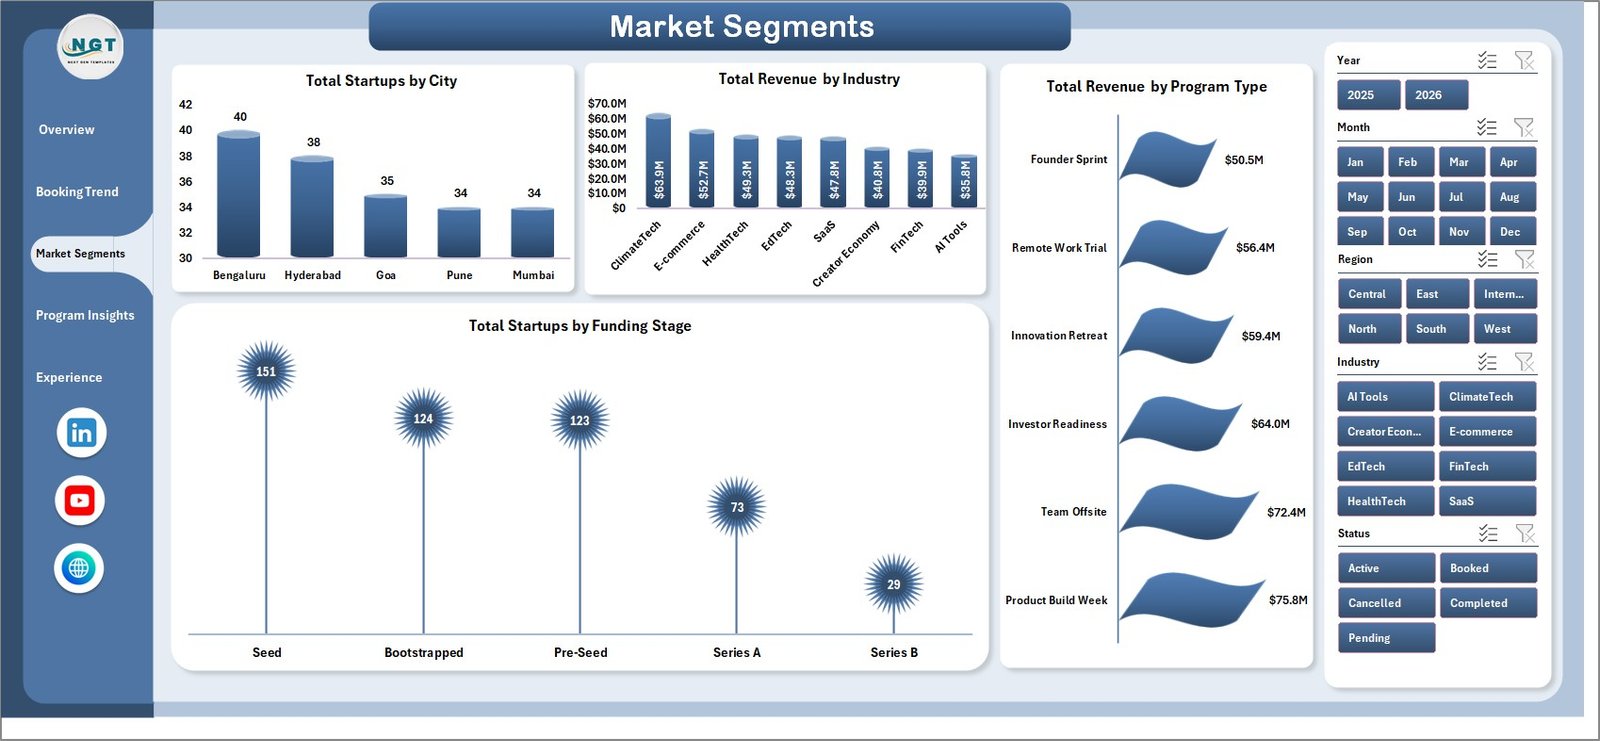
Page 3: Market Segments
The Market Segments page dives into geographic and industry-level segmentation with charts for Total Startups by City, Total Revenue by Industry, Total Revenue by Program Type, and Total Startups by Funding Stage — helping identify which markets and startup profiles generate the most traction across your coworkation network.
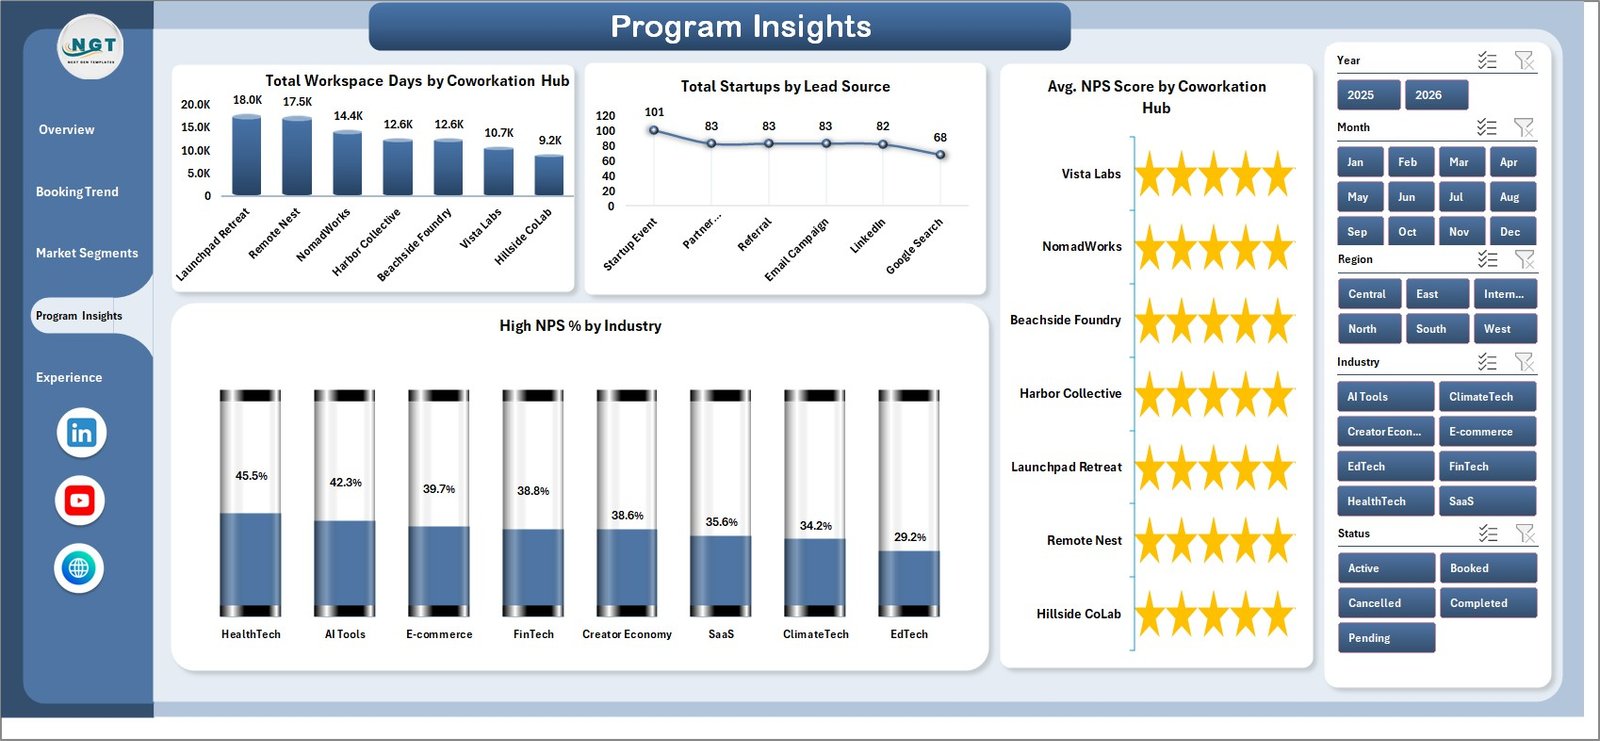
Page 4: Program Insights
The Program Insights page focuses on hub-level and lead source performance with charts for Total Workspace Days by Coworkation Hub, Total Startups by Lead Source, Avg. NPS Score by Coworkation Hub, and High NPS % by Industry — essential for optimizing program delivery and hub capacity planning across your portfolio.
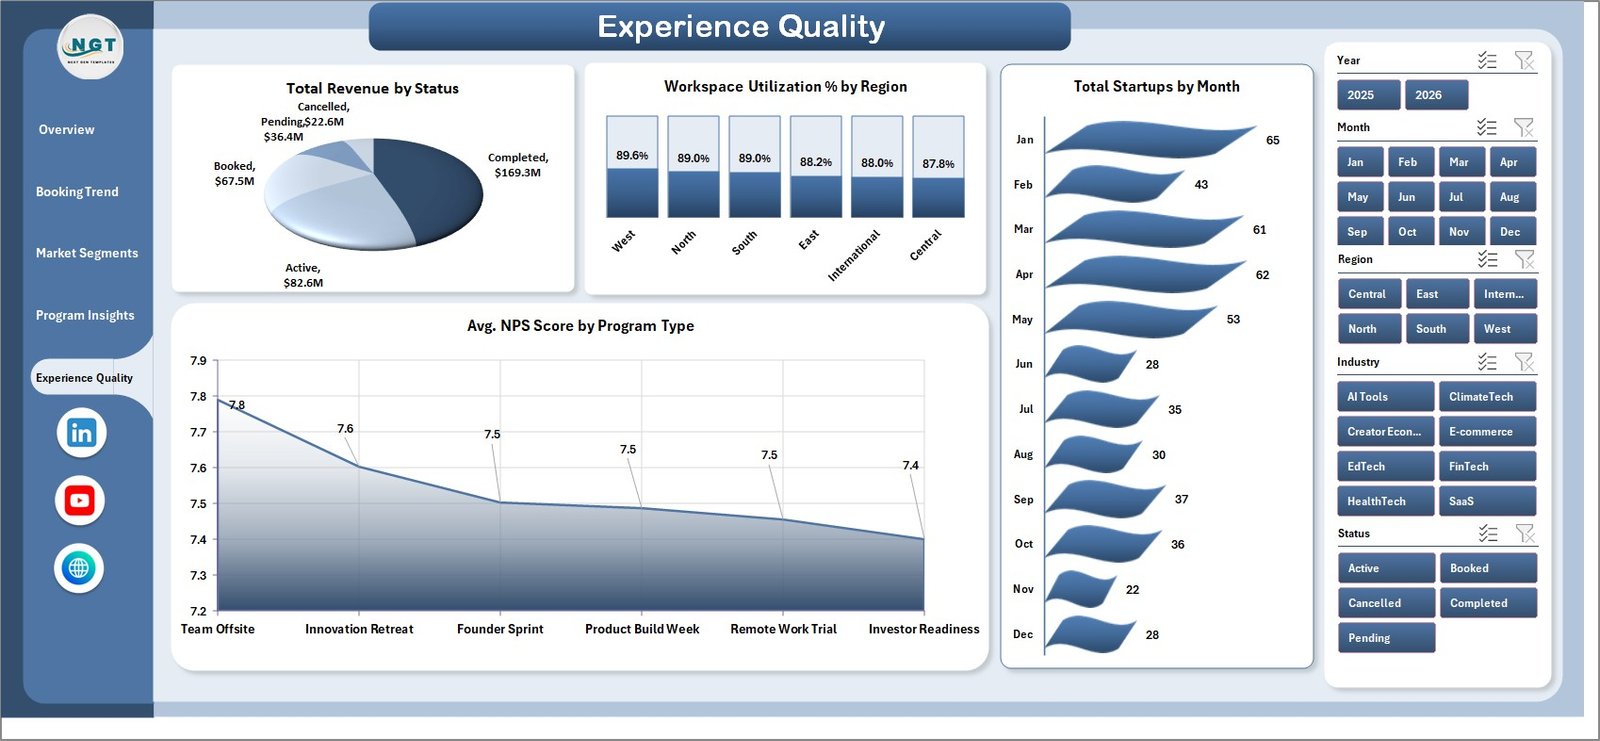
Page 5: Experience Quality
The Experience Quality page tracks experience metrics with charts for Total Revenue by Status, Workspace Utilization % by Region, Total Startups by Month, and Avg. NPS Score by Program Type — connecting delivery quality directly to revenue outcomes so you know which programs retain startups longest.
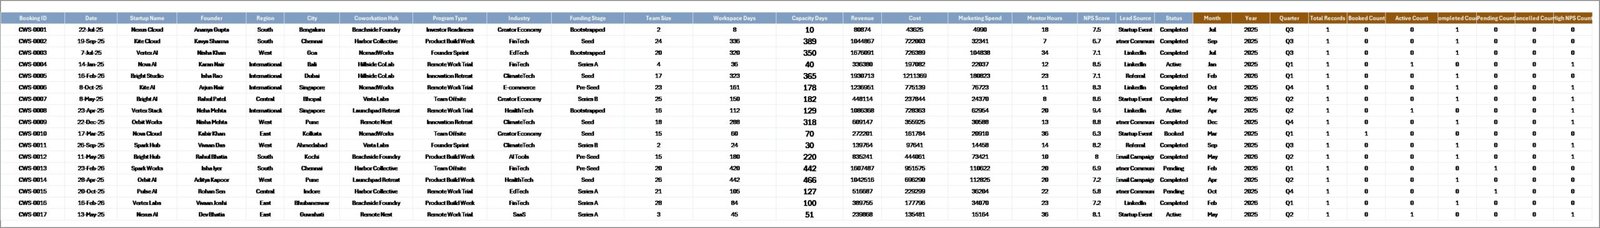
Data Sheet Tab
The Data Sheet is the structured input table. Add your own coworkation startup records in the same column format as the sample data and refresh the workbook to update all cards, charts, slicers, and pivots across every page.
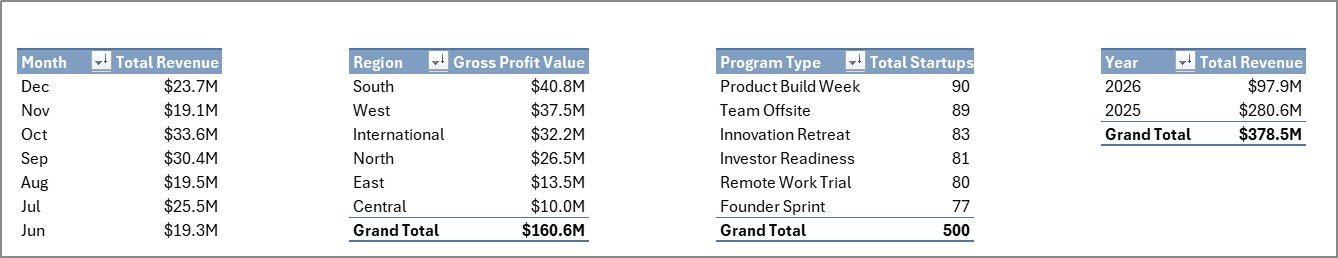
Support Sheet Tab
The Support Sheet contains all the pivot tables that power the dashboard charts dynamically. After updating the Data Sheet, go to the Excel Ribbon, open the Data tab, and click Refresh All. You can keep this sheet hidden once the workbook is set up for a clean stakeholder presentation.
Coworkation Startups Dashboard in Excel vs. Google Sheets vs. Paid Coworking SaaS — Feature Comparison
| Feature | Coworkation Startups Dashboard in Excel | Google Sheets Equivalent | Paid SaaS (Nexudus / Cobot) |
|---|---|---|---|
| Cost | $17.99 one-time | Free (basic) / ~$10 template | $50–$200/month |
| Platform | ✅ Microsoft Excel (offline) | Google Sheets (cloud) | Browser / app |
| Setup time | ✅ Under 10 minutes | 10–15 minutes | Days (onboarding + training) |
| Real-time team collaboration | Via SharePoint / OneDrive | ✅ Native real-time | ✅ Native real-time |
| Customizable fields | ✅ Fully editable | ✅ Fully editable | Limited / locked tiers |
| NPS tracking built-in | ✅ 4 dedicated NPS charts | Manual setup | Partial (varies by tier) |
| Year-1 cost (5 users) | $17.99 total | ~$50 (template) | $600–$2,400/year |
| Workspace utilization analysis | ✅ By region + program | Manual setup | Basic reporting |
For coworkation hub managers and startup program operators who want NPS, utilization, and revenue analytics without monthly SaaS fees, the Coworkation Startups Dashboard in Excel sits in the sweet spot.
Who Should Use This Template
✅ Perfect for:
- Coworkation hub managers tracking startup program performance and workspace utilization across one or multiple hubs
- Accelerator and incubator operators monitoring NPS scores and revenue by program type and cohort
- Startup ecosystem teams analyzing funding stage distribution and lead source effectiveness
- Operations managers at coworking spaces building monthly or annual performance reports for leadership
- Startup founders and small coworking operators who need professional analytics without expensive software
❌ Not a fit if:
- You need real-time booking system integrations or automated member billing
- Your operation requires SOC 2 compliance or SSO access controls
- You need live API connections to coworking management software like Nexudus or OfficeRnD
Real-World Use Cases
Riya manages operations for a coworkation network with 3 hubs across India. She uses the Coworkation Startups Dashboard in Excel to compare NPS scores across hubs, identify which program types drive the highest revenue, and present quarterly workspace utilization reports to her leadership — without paying $150/month for analytics software. The Program Insights page’s Avg. NPS Score by Coworkation Hub chart became her go-to slide for board meetings.
Marcos runs an accelerator program that hosts 50+ startups per quarter. He tracks total workspace days by coworkation hub and startup status using the Booking Trend and Program Insights pages, and uses the data to optimize hub capacity allocation before each new cohort begins. The Market Segments page’s Total Startups by Funding Stage chart helps him pitch investors on program diversity.
A boutique coworking startup in its second year uses this template instead of investing in expensive SaaS analytics — they enter booking records weekly into the Data Sheet and use the Experience Quality page’s Workspace Utilization % by Region chart to identify underperforming hubs before lease renewal decisions.
Advantages of Coworkation Startups Dashboard in Excel
- Tracks NPS and workspace utilization together in one workbook — two metrics most coworking tools report separately
- One-time $17.99 cost vs. $600–$2,400/year for SaaS analytics add-ons
- Setup under 10 minutes — just replace sample data and click Refresh All
- Fully offline — no internet dependency, no data privacy concerns with third-party cloud storage
- Pivot-driven architecture means new data dimensions (e.g., new cities, hubs, or programs) are automatically picked up after refresh
- Shareable via SharePoint or OneDrive for team collaboration without per-user fees
Opportunities for Improvement
- Does not connect directly to coworking management platforms like Nexudus, OfficeRnD, or Cobot — data must be exported and pasted into the Data Sheet manually
- Real-time collaboration requires Microsoft 365 with OneDrive/SharePoint sharing; unlike Google Sheets, it doesn’t offer browser-based simultaneous editing natively
- Chart customization requires some familiarity with Excel pivot tables and chart formatting
- No built-in forecasting or trend prediction — purely a historical reporting dashboard
Best Practices
- Update the Data Sheet at least weekly for meaningful trend analysis on the Booking Trend and Experience Quality pages
- Use consistent naming conventions for hub names, program types, and cities to ensure slicers work cleanly
- Keep the Support Sheet hidden once the dashboard is configured — it prevents accidental pivot table edits
- Create a backup copy of the workbook before modifying pivot source ranges or chart structures
- Use the Overview page slicers to create filtered screenshots for monthly stakeholder reports
Explore Relevant Templates
📊 Content Personalization Startups Dashboard in Excel — campaign, audience, and personalization reporting for startups
📊 Convenience Apps Dashboard in Excel — app performance analytics for startup operators
📊 Career Mentorship Platforms Dashboard in Excel — platform analytics for startup ecosystems
Browse all Excel Dashboard Templates across 50+ industries at NextGenTemplates.
For an overview of best practices in Excel data analysis, see Microsoft Excel Support.
Frequently Asked Questions
What KPIs does the Coworkation Startups Dashboard in Excel track?
The Coworkation Startups Dashboard in Excel tracks 5 KPIs — Total Revenue, Gross Profit Value, Total Startups, Total Workspace Days, and Avg. NPS Score — plus 16+ derived metrics across program type, region, city, coworkation hub, funding stage, lead source, status, and industry dimensions.
How long does setup take?
Setup takes under 10 minutes. Open the file in Microsoft Excel 2016 or later, navigate to the Data Sheet, replace the sample data with your own records in the same column format, then click Data → Refresh All. All 5 dashboard pages update instantly.
Does this template require macros?
No. The Coworkation Startups Dashboard in Excel is built entirely on native Excel pivot tables, slicers, and charts. No macros, Power Query, or add-ins required. It works in Excel 2016, 2019, 2021, and Microsoft 365.
How does this compare to Nexudus or Cobot analytics?
Nexudus and Cobot are member management platforms costing $50–$200/month, designed for bookings and billing. The Coworkation Startups Dashboard in Excel is a $17.99 one-time purchase focused on analytics and NPS/utilization reporting — an ideal companion for teams that manage bookings in a coworking platform but need affordable, customizable dashboards.
Can I track multiple coworkation hubs in one file?
Yes. The Data Sheet supports unlimited rows. You can add a Hub or Region column and filter by it using the slicers, making the dashboard suitable for multi-hub coworkation networks across different cities.
What version of Excel is required?
Microsoft Excel 2016 or later is recommended on both Windows and Mac, including Microsoft 365. The dashboard uses only pivot tables and slicers, which are fully supported in all modern Excel versions.
Is there a Google Sheets version?
Not currently. Browse Google Sheets Dashboard Templates at NextGenTemplates for cloud-based alternatives. The Excel version works offline and updates with a single Refresh All click.
About the Author
Built by PK — Microsoft Certified Professional with 15+ years of Excel, Google Sheets, and Power BI experience. Founder of NextGenTemplates, reaching 300K+ subscribers across YouTube channels (@PK-AnExcelExpert, @NextGenTemplates, @NeoTechNavigators). Every template is hand-built and tested before release.
Conclusion
The Coworkation Startups Dashboard in Excel gives hub managers, accelerator operators, and startup ecosystem teams a professional analytics workbook that tracks revenue, NPS, workspace utilization, and program performance in one place — at a fraction of what SaaS tools charge annually.
Click here to Purchase the Coworkation Startups Dashboard in Excel
Instant download · One-time payment · No subscription
Visit our YouTube channel for step-by-step tutorials: Youtube.com/@PK-AnExcelExpert
Last updated: May 2026