According to the U.S. Chamber of Commerce Foundation, over 7,000 chambers of commerce operate across the United States, collectively representing millions of businesses and managing hundreds of thousands of member relationships annually. Yet most of these organizations still rely on scattered spreadsheets, disconnected reports, and manual data entry to track membership fees, event attendance, regional performance, and financial health. The result is slow reporting, missed insights, and board presentations built on stale data.
The Chamber of Commerce Dashboard in Excel solves this directly. It delivers 5 interactive analysis pages, 12+ pre-built pivot-driven charts, and slicer-based filtering — all in a single Excel file that updates every chart and KPI card with one click of Refresh All. Setup takes under 10 minutes: paste your membership data into the Data sheet, click refresh, and the full dashboard is live.
Click here to Purchase the Chamber of Commerce Dashboard in Excel
Key Features of Chamber of Commerce Dashboard in Excel
The Chamber of Commerce Dashboard in Excel tracks 5 high-level KPIs — Total Membership Fees, Total Chamber Income, Total Members, Total Event Attendances, and Net Surplus — across 5 dedicated analysis pages. This is a definitive statement: no other single Excel template covers all five dimensions of chamber operations in a unified, slicer-filterable interface.
- 5 Dedicated Dashboard Pages: Overview, Membership Mix, Event Performance, Regional Reach, and Financials. Each page is focused, filterable, and self-contained.
- 12+ Pre-Built Charts: Including Active Member %, Members by Tier, Membership Fees by Payment Method, Fees vs Sponsorship by Month, Operating Cost by Tier, Engagement Score by Company Size, Members by Referral Source, Event Attendances by Quarter, Leads by Event Type, Fees by Region, Net Surplus by Tier, and Chamber Income by Month.
- Interactive Excel Slicers: Every page has slicers for instant filtering by region, membership tier, chapter, event type, referral source, and payment method — no formulas, no manual updates.
- Pivot-Driven Architecture: All 12+ charts are powered by Excel pivot tables in a hidden Support sheet. Refresh All after updating the Data sheet and every chart updates automatically.
- Structured Data Sheet: One clean data entry sheet with all required columns. Add member records row by row and the dashboard follows.
- Administration and Nonprofit Ready: Designed for Chambers of Commerce, trade associations, business councils, and nonprofit membership organizations of all sizes.
Dashboard Pages Explanation
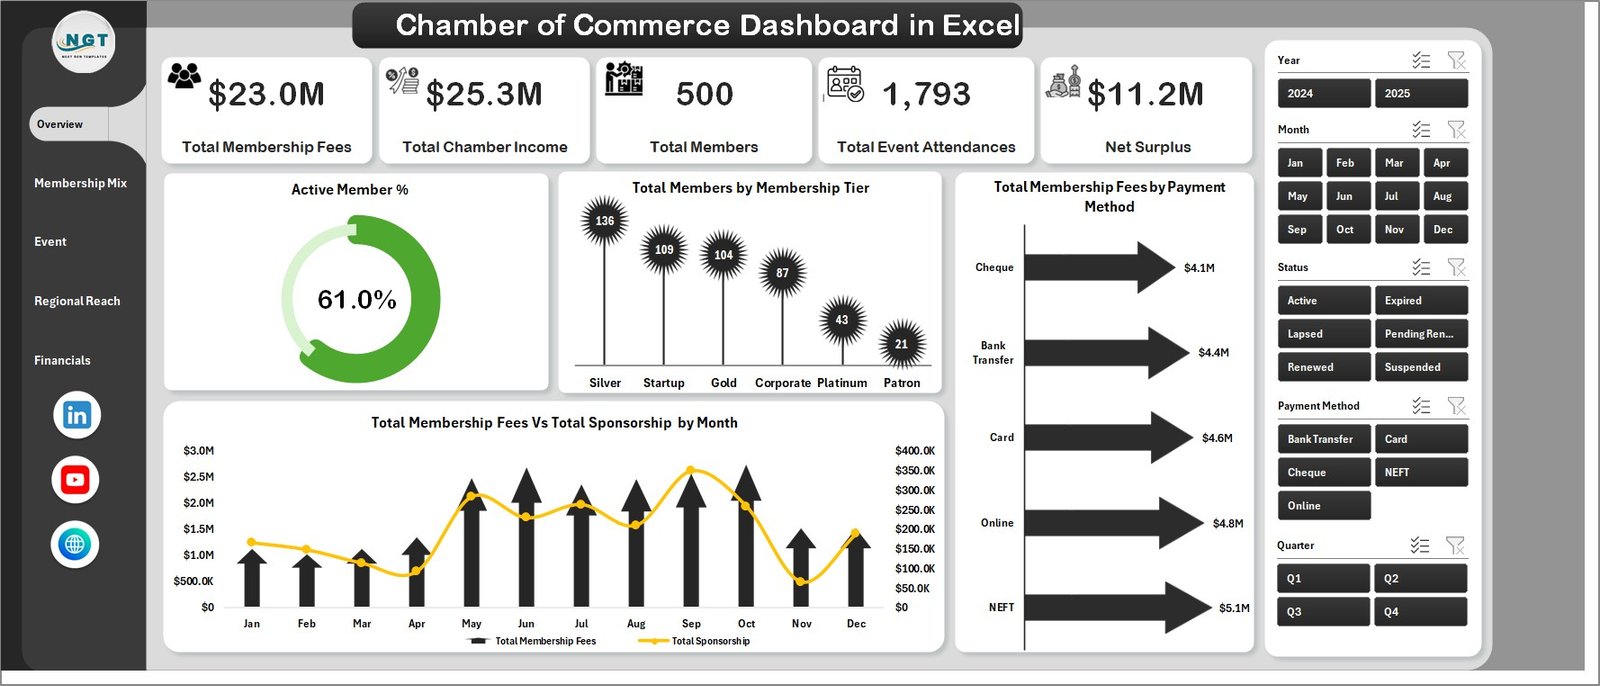
Page 1: Overview
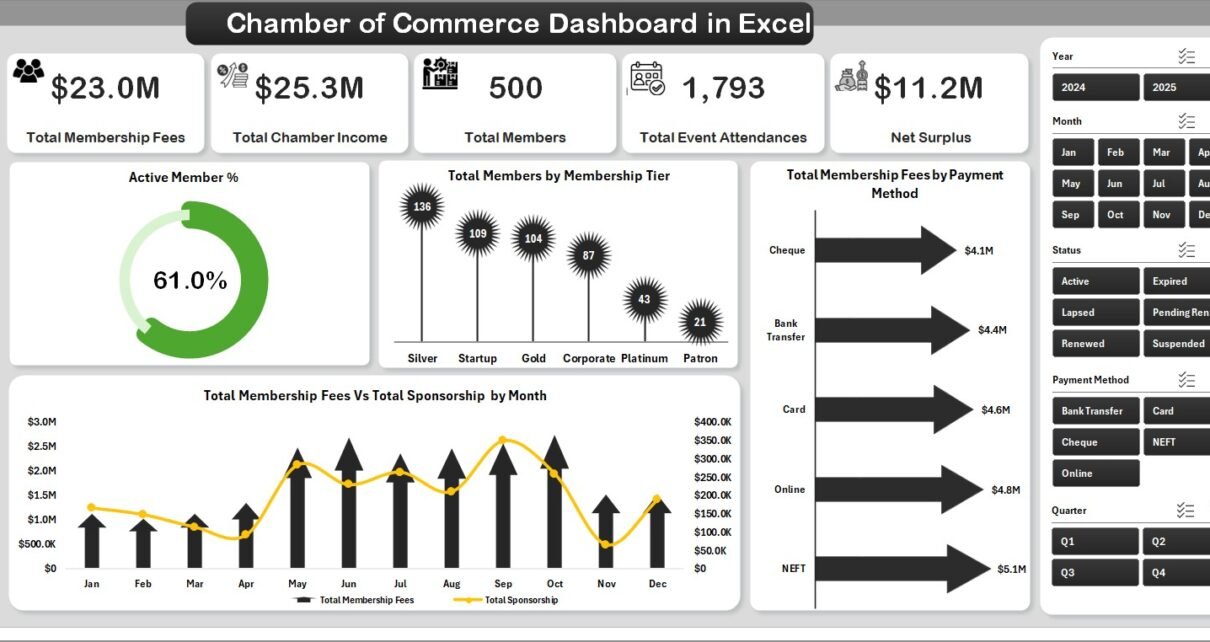
The Overview page acts as the executive control panel for the entire dashboard. At the top, five KPI cards display Total Membership Fees, Total Chamber Income, Total Members, Total Event Attendances, and Net Surplus — giving leadership an instant health check without drilling into individual reports. Below the cards, four charts provide analytical depth: Active Member %, Total Members by Membership Tier, Total Membership Fees by Payment Method, and Total Membership Fees vs Total Sponsorship by Month. Multiple slicers allow filtering by tier, region, chapter, and payment method.
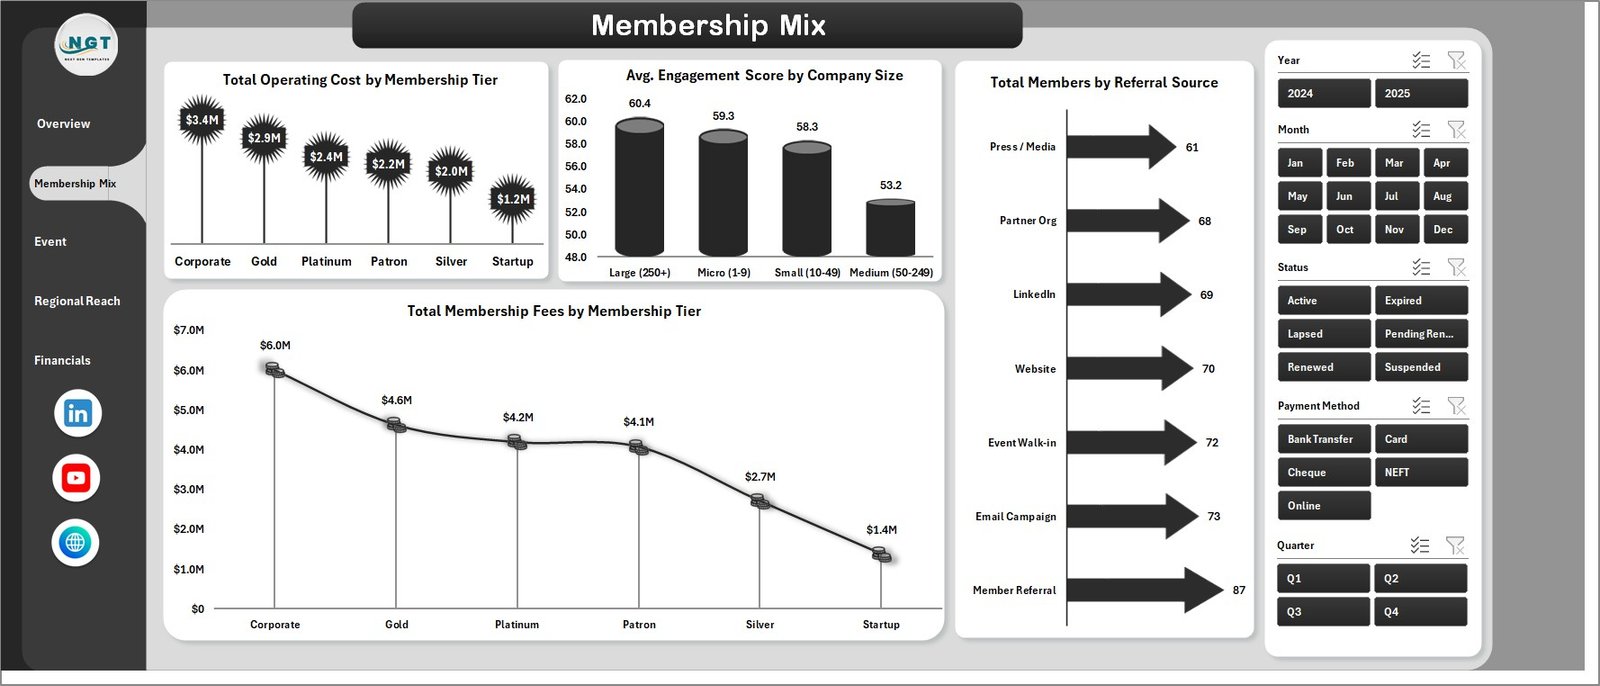
Page 2: Membership Mix
The Membership Mix page breaks down your member base by segment, tier, and acquisition source. It includes four analyses: Total Operating Cost by Membership Tier (to understand cost-to-serve by tier), Avg. Engagement Score by Company Size (to see which company sizes are most engaged), Total Members by Referral Source (to evaluate which channels bring the most members), and Total Membership Fees by Membership Tier (to map revenue concentration). Chamber development managers use this page to prioritize retention efforts and identify underserved segments.
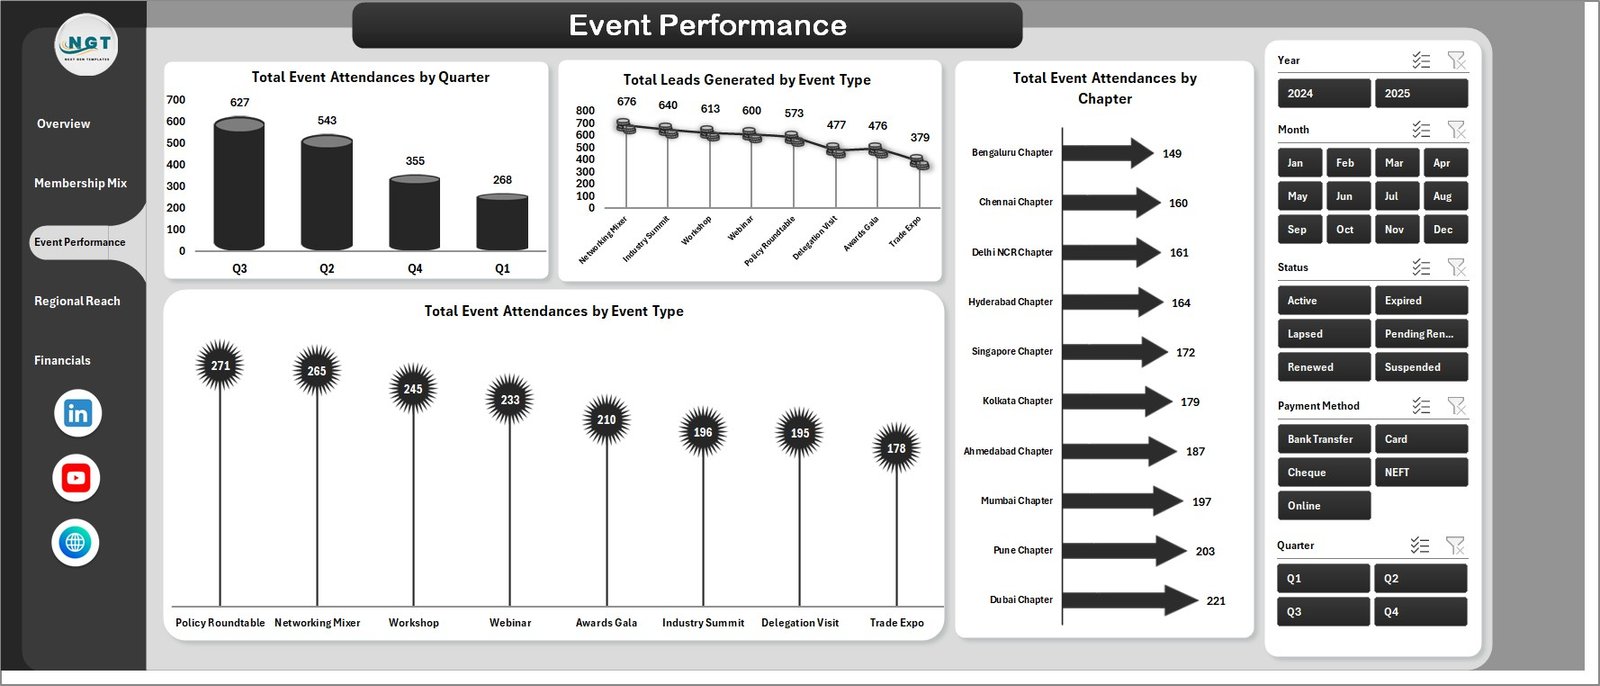
Page 3: Event Performance
The Event Performance page tracks how your chamber’s events are performing across quarters, types, and chapters. Charts include Total Event Attendances by Quarter (to spot seasonal patterns), Total Leads Generated by Event Type (to understand which formats produce business connections), Total Event Attendances by Chapter (to compare regional event engagement), and Total Event Attendances by Event Type (to benchmark networking events vs. seminars vs. workshops). This page directly informs next year’s event calendar and chapter investment decisions.
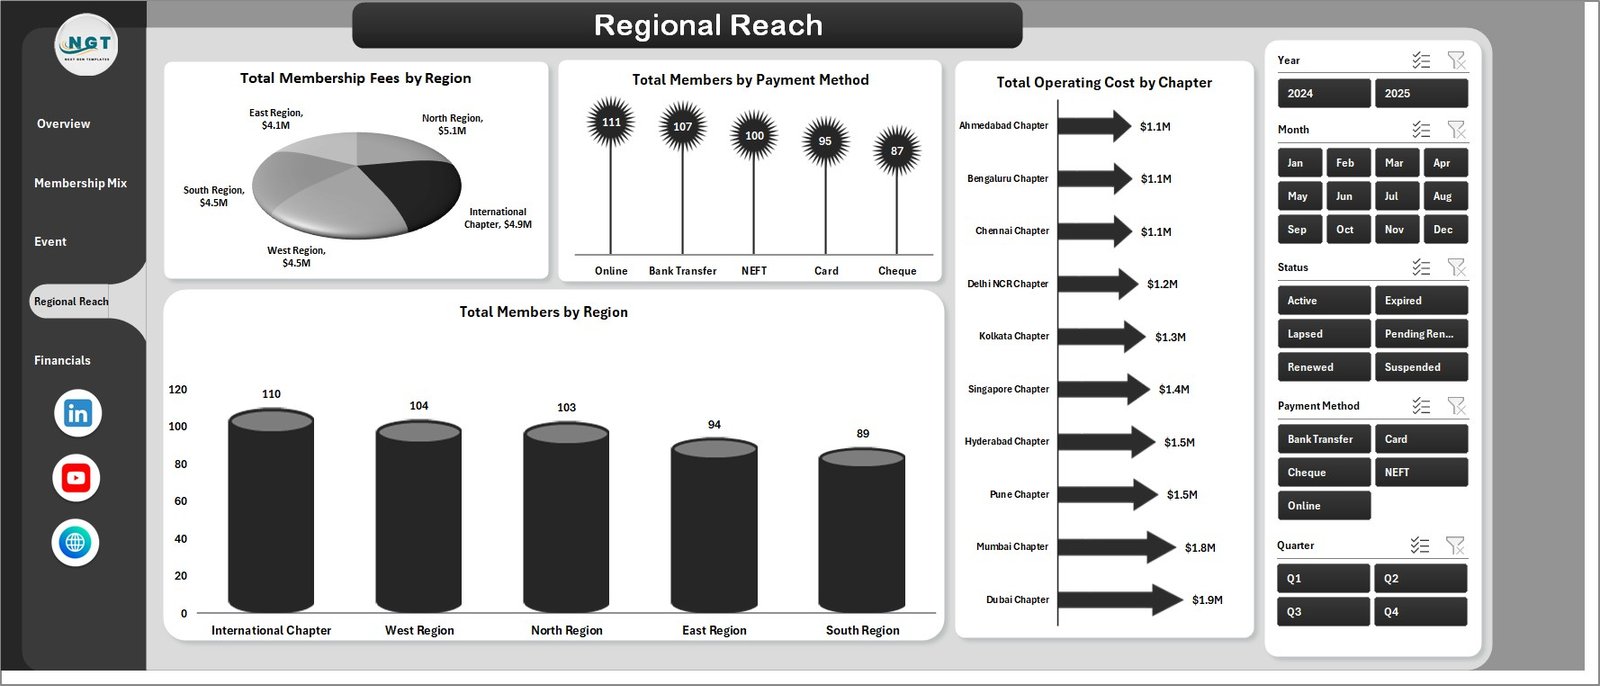
Page 4: Regional Reach
The Regional Reach page provides geographic visibility into your membership base and financial performance. Four analyses are included: Total Membership Fees by Region (revenue by geography), Total Members by Payment Method (payment preference distribution), Total Operating Cost by Chapter (cost efficiency by region), and Total Members by Region (member concentration map). Regional directors and board members use this page to make informed decisions about chapter expansion and resource allocation.
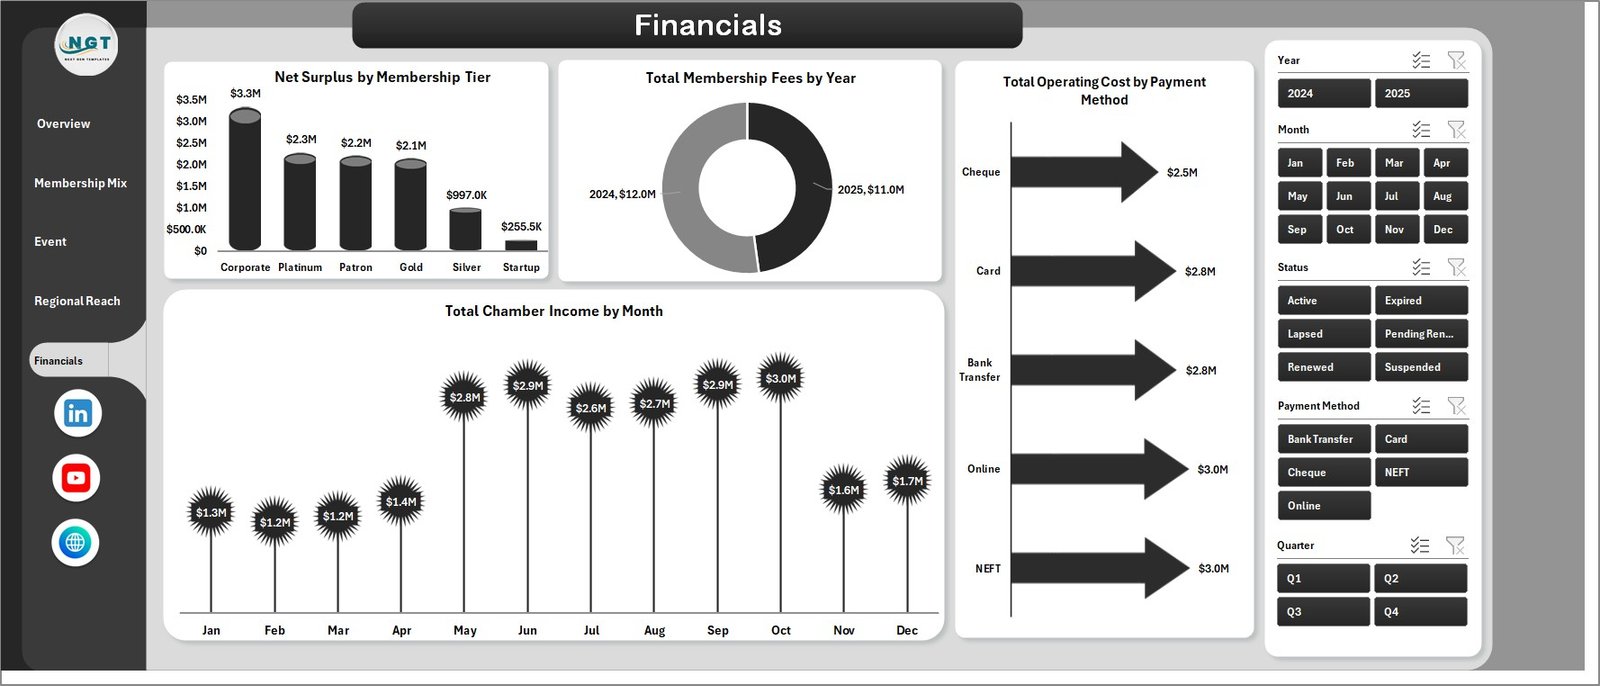
Page 5: Financials
The Financials page is the board-ready financial summary of the entire dashboard. Charts cover Net Surplus by Membership Tier (profitability by member segment), Total Membership Fees by Year (revenue trend over time), Total Operating Cost by Payment Method (cost analysis by payment channel), and Total Chamber Income by Month (monthly income seasonality). This page becomes the centrepiece of quarterly board presentations and annual financial reviews.
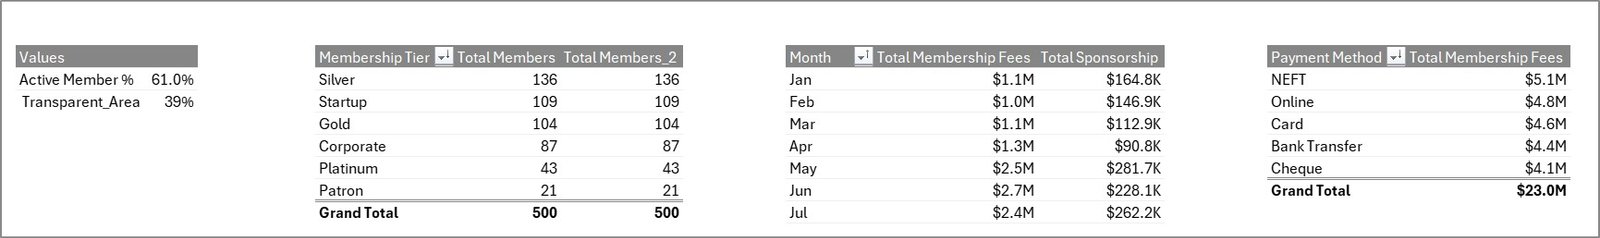
Data Sheet
The Data sheet is the single data entry point for the entire dashboard. Enter your membership records in the same column format — member details, fees, payment method, region, chapter, event attendance, referral source, and more — and all five dashboard pages update on Refresh All.

Support Sheet
The Support sheet contains all pivot tables that power the dashboard dynamically. To refresh after updating data, go to the Data tab in the Excel Ribbon and click Refresh All. All pivots update instantly, and every chart reflects the new data. You can keep this sheet hidden in normal use — it only needs to be accessed when customizing pivot layouts.
Chamber of Commerce Dashboard in Excel vs. Google Sheets vs. Paid Association Software — Feature Comparison
| Feature | Chamber of Commerce Dashboard in Excel | Google Sheets Equivalent | Paid SaaS (GrowthZone / MemberClicks) |
|---|---|---|---|
| Cost | $17.99 one-time | Free (manual build hours) | $200–$600 / month |
| Platform | Microsoft Excel | Google Sheets (online) | Cloud SaaS (browser only) |
| Setup time | Under 10 minutes | Hours of manual setup | Days of onboarding |
| Interactive slicers | ✅ Native Excel slicers | Dropdown filters only | ✅ Dashboard filters |
| Data ownership | ✅ Your file, your data | ✅ Your spreadsheet | ❌ Vendor-controlled |
| Offline access | ✅ Works offline | ❌ Requires internet | ❌ Requires internet |
| Customizable fields | ✅ Fully customizable | ✅ Editable | Limited |
| Year-1 cost (5 users) | $17.99 total | $0 (build time excluded) | $2,400–$7,200 |
| 5-page analysis coverage | ✅ Full (Overview, Mix, Events, Regional, Financials) | Manual tabs only | ✅ Module-based |
For chambers that want pivot-driven analytics across membership, events, regional reach, and financials without paying $200+/month, the Chamber of Commerce Dashboard in Excel sits in the sweet spot.
Who Should Use This Template
Perfect for:
- Chamber of Commerce managers producing monthly and quarterly board reports
- Trade associations and business councils with multi-region chapter structures
- Nonprofit membership organizations tracking annual fees, sponsorships, and events
- Outsourced accounting or management firms serving chamber clients
- Finance and operations teams needing a single refreshable Excel reporting tool
Not a fit if:
- You need real-time CRM sync or automated email triggers (consider GrowthZone or MemberClicks)
- Your team requires multi-user simultaneous editing (consider a Google Sheets or SharePoint approach)
- You don’t have access to Microsoft Excel 2016 or later
Real-World Use Cases
Maria manages operations at a regional Chamber of Commerce with 400+ members. Every month, she used to spend 4+ hours pulling data from different spreadsheets, reformatting charts, and assembling the board report manually. With the Chamber of Commerce Dashboard in Excel, she updates the Data sheet, clicks Refresh All, and the board-ready 5-page report is done in under 30 minutes. The Financials page became her most-used slide in quarterly presentations.
David runs an outsourced accounting practice serving three chamber clients. He maintains a separate copy of the dashboard for each client, updating the Data sheet monthly with membership renewal and event data. The Regional Reach page has become his go-to tool for recommending chapter investments — and the comparison table in his board reports now clearly shows cost per member by region without any manual calculation.
Priya leads business development for a state-level trade association with 12 chapters. She uses the Membership Mix page each quarter to identify which referral sources bring the highest-tier members, and the Event Performance page to decide which event formats generate the most qualified leads. The slicer filters let her answer ad-hoc board questions on the spot, without leaving the dashboard.
Advantages of Chamber of Commerce Dashboard in Excel
- One-click refresh: Refresh All in the Data tab updates every chart, KPI card, and pivot table simultaneously — no manual chart rebuilding.
- No per-user fees: One purchase covers your entire team. Share the file with as many colleagues as needed.
- Works offline: The dashboard is a self-contained .xlsx file. No internet, no login, no cloud dependency.
- Fully customizable: Modify the Data sheet columns, add new pivot calculated fields, or restructure chart layouts in the Support sheet to match your exact reporting requirements.
- Slicer-based filtering: Native Excel slicers provide instant cross-filtering across all charts on a page — no dropdown formulas or SUMPRODUCT complexity.
Opportunities for Improvement
- The dashboard requires manual data entry into the Data sheet; organizations with CRM systems would benefit from building an export-to-Excel pipeline for their membership data before import.
- For chambers managing 5,000+ members, row count may affect pivot refresh speed on older hardware — Power Query or Power Pivot can address this for large datasets.
- Multi-user simultaneous editing is not supported in a standard .xlsx file; teams needing collaborative editing should consider a SharePoint or OneDrive co-authoring setup.
Best Practices
- Keep the Data sheet column structure intact when adding new records — pivot tables depend on consistent field names.
- Update data monthly at a minimum so slicer-filtered trends stay meaningful.
- Hide the Support sheet after initial setup to keep navigation clean for non-technical staff.
- Use the Financials page as your standard board presentation slide — Net Surplus by Tier and Chamber Income by Month are the two charts boards ask about most.
- For Microsoft 365 users, store the file in OneDrive and enable AutoSave to prevent data loss during large data updates.
Explore Relevant Templates
- Chamber of Commerce KPI Dashboard in Excel — Track MTD/YTD KPIs with target vs. actual comparison and trend charts for chamber operations.
- Chamber of Commerce KPI Dashboard in Power BI — The Power BI version for organizations already invested in the Microsoft BI stack.
For the full collection of administration and nonprofit templates, visit the Excel Dashboard Templates library on NextGenTemplates.
For further reading on Excel pivot tables and dashboard best practices, Microsoft’s official PivotTable documentation is an authoritative reference.
Frequently Asked Questions
What KPIs does the Chamber of Commerce Dashboard in Excel track?
The Chamber of Commerce Dashboard in Excel tracks 5 top-level KPIs: Total Membership Fees, Total Chamber Income, Total Members, Total Event Attendances, and Net Surplus. Additionally, 12+ chart-level metrics cover membership mix, event performance, regional distribution, and monthly financial trends.
How does the Chamber of Commerce Dashboard in Excel compare to GrowthZone or MemberClicks?
The Chamber of Commerce Dashboard in Excel is a one-time $17.99 purchase vs. $200–$600/month for GrowthZone or MemberClicks. For chambers that primarily need reporting and analytics (not CRM or email automation), the Excel dashboard delivers equivalent analytical depth at a fraction of the annual cost.
How long does setup take?
Under 10 minutes. Download the file, open it in Excel, paste your membership data into the Data sheet in the same column format, click Refresh All in the Data tab, and the full 5-page Chamber of Commerce Dashboard in Excel is ready.
Can I add my own KPIs or charts to the dashboard?
Yes. The Support sheet contains all pivot tables. Advanced Excel users can modify pivot layouts, add calculated fields, or create new pivot-based charts. The Data sheet columns can also be extended with additional fields as long as pivot relationships are updated accordingly.
What version of Microsoft Excel is required?
Microsoft Excel 2016 or later is recommended. The Chamber of Commerce Dashboard in Excel uses native pivot tables, slicers, and standard chart formatting — all features available in Excel 2016, 2019, 2021, and Microsoft 365.
Is there a Google Sheets version of this dashboard?
Check the Google Sheets Dashboards collection on NextGenTemplates for cloud-based alternatives. The Excel version is recommended for organizations that prefer offline access and native slicer functionality.
Does the dashboard work for trade associations, not just chambers?
Yes. The Chamber of Commerce Dashboard in Excel is equally suited for trade associations, business councils, industry groups, and any nonprofit membership organization that tracks membership fees, event participation, regional chapters, and financial performance.
About the Author
Built by PK — Microsoft Certified Professional with 15+ years of Excel, Google Sheets, and Power BI experience. Founder of NextGenTemplates, reaching 300K+ subscribers across YouTube channels (@PK-AnExcelExpert, @NextGenTemplates, @NeoTechNavigators). Every template is hand-built and tested before release.
Conclusion
The Chamber of Commerce Dashboard in Excel replaces scattered spreadsheets and manual board reports with a single, pivot-driven, slicer-filterable analytics file covering all five dimensions of chamber operations: membership, mix, events, regional reach, and financials. At $17.99 one-time vs. hundreds per month for SaaS alternatives, it is the most cost-effective reporting tool available for chambers and trade associations of any size.
Click here to Purchase the Chamber of Commerce Dashboard in Excel
Instant download · One-time payment · No subscription
Last updated: May 2026
Visit our YouTube channel for step-by-step tutorials: Youtube.com/@PK-AnExcelExpert