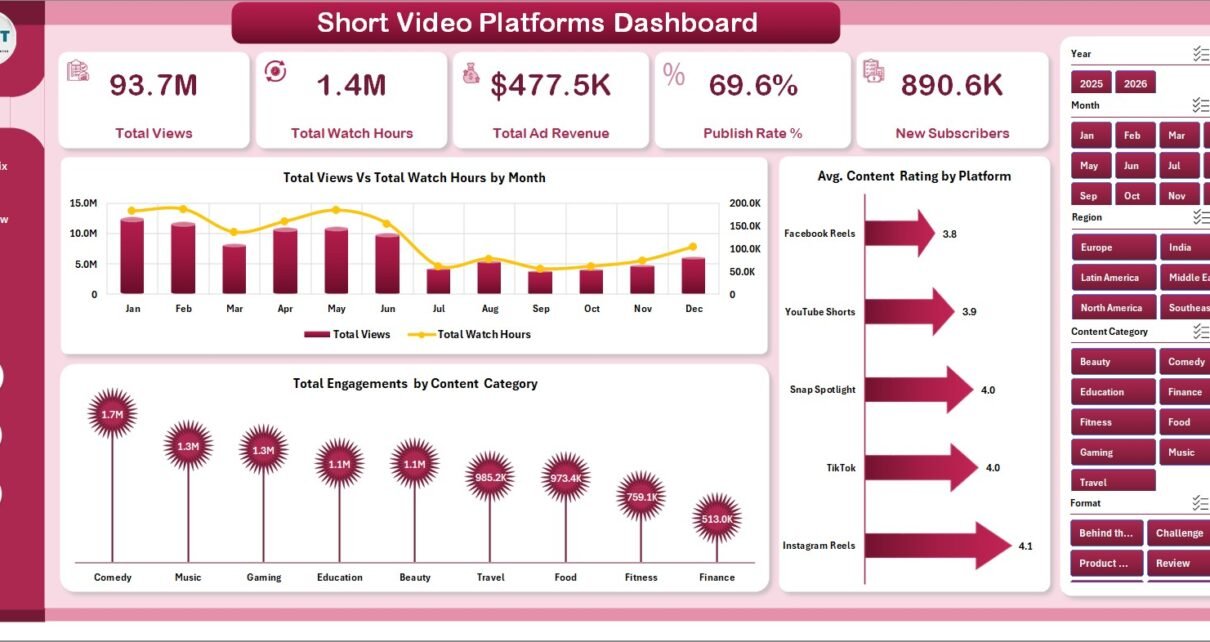
Short Video Platforms Dashboard in Excel helps creators, media teams, agencies, and platform analysts review views, watch hours, ad revenue, publish rate, subscribers, engagement, campaign output, content quality, and production cost across 7 workbook tabs. Short-form video is now a major digital attention channel: DataReportal reports that YouTube ads reach 2.65 billion users each month, while TikTok has reported ad reach of 2.21 billion worldwide. When video results are scattered across TikTok, YouTube Shorts, Instagram Reels, Snapchat Spotlight, and other channels, it becomes difficult to see which platforms, creators, content categories, formats, regions, and campaigns are actually driving growth. This Excel dashboard gives you a structured reporting layer without rebuilding charts from scratch.
Short Video Platforms Dashboard in Excel
Key Features of Short Video Platforms Dashboard in Excel
- 5 KPI cards: Total Views, Total Watch Hours, Total Ad Revenue, Publish Rate %, and New Subscribers.
- 5 analysis pages: Overview, Platform Mix, Creator View, Content, and Revenue.
- 19 dashboard charts: compare platform, creator, format, category, campaign, region, audience, monetization, and monthly performance.
- Interactive slicers: filter the dashboard quickly by available fields and review targeted segments.
- Editable Data Sheet: replace the sample short video records with your own data in the same column format.
- Support Sheet: pivot tables power the workbook dynamically and can be hidden after setup.
- Excel-based workflow: useful for recurring reporting without a monthly analytics SaaS subscription.
Dashboard Pages Explanation
1 – Overview Page
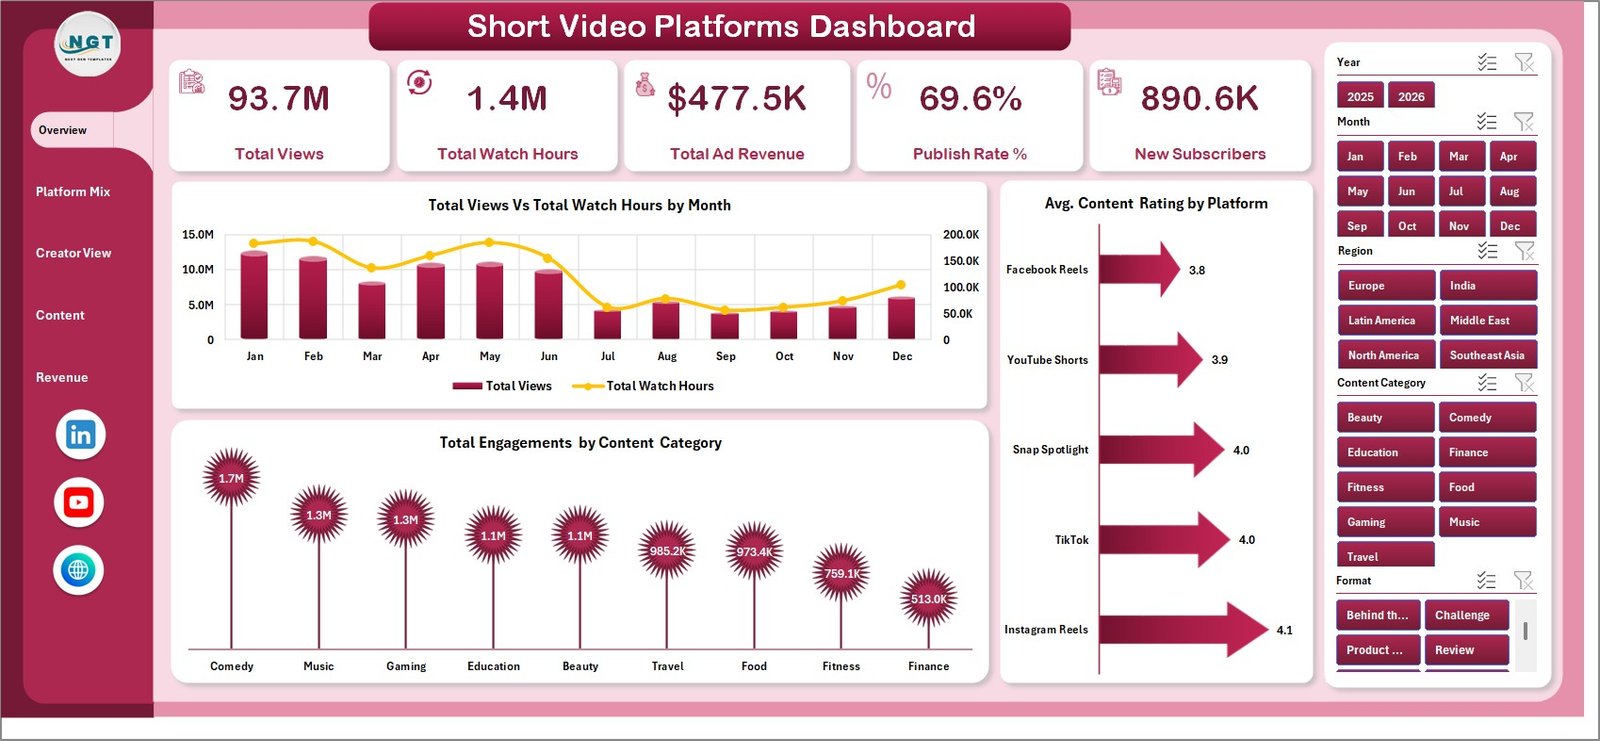
The Overview Page gives a high-level performance summary for short video publishing. The top KPI cards show Total Views, Total Watch Hours, Total Ad Revenue, Publish Rate %, and New Subscribers so managers can quickly understand reach, viewing depth, monetization, output consistency, and audience growth.
Total Views Vs Total Watch Hours by Month: This chart compares monthly reach with total watch time. It helps users see whether high-view months also produced meaningful viewing depth.
Total Engagements by Content Category: This chart shows which content categories generate the most combined engagement. It helps creators and marketers identify the themes that attract comments, likes, shares, and saves.
Avg. Content Rating by Platform: This chart compares average content rating across platforms. It helps teams understand where their content quality or audience response is strongest.
2 – Platform Mix
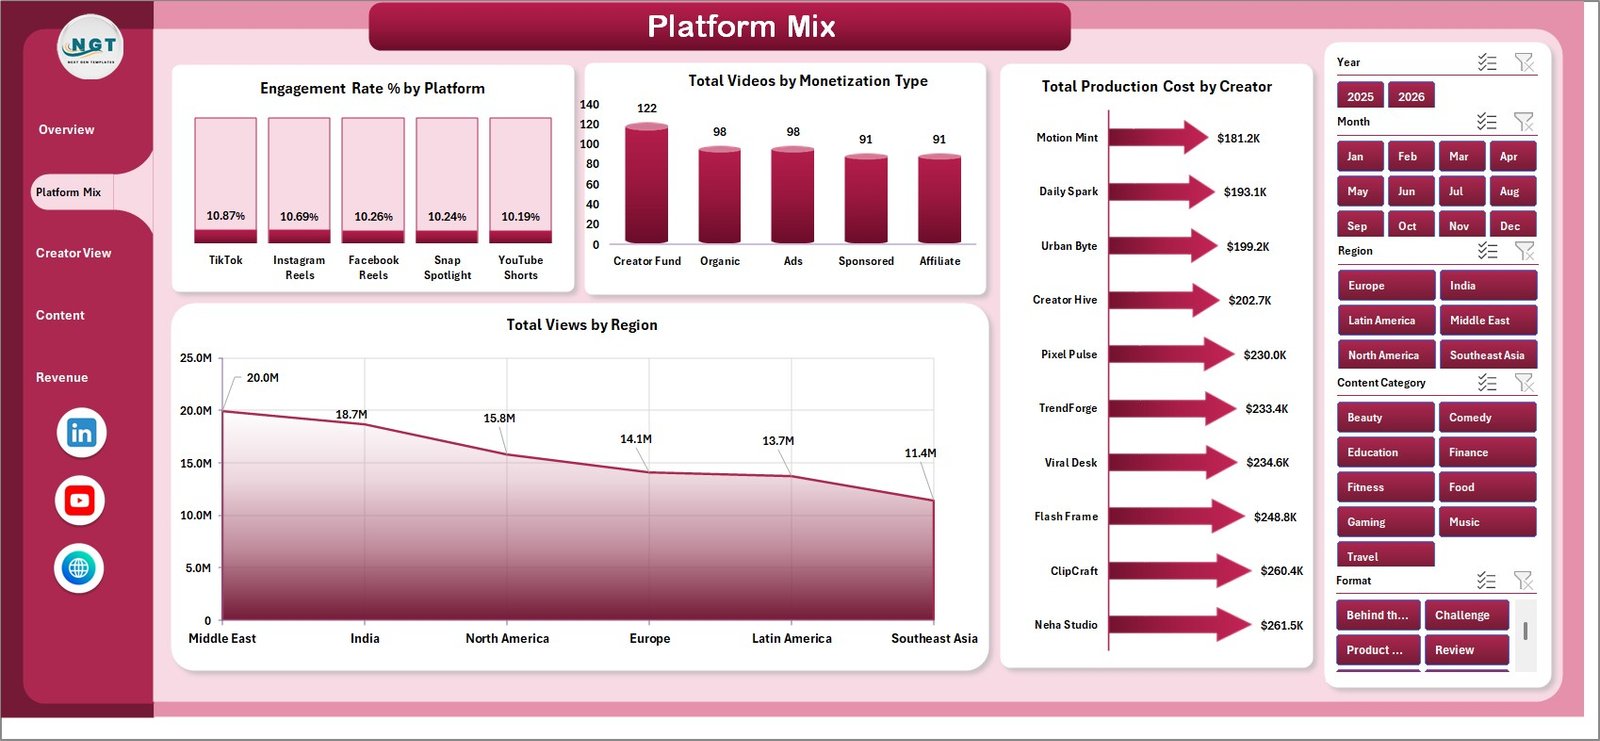
The Platform Mix sheet focuses on channel distribution, monetization, regional reach, and creator-level cost.
Engagement Rate % by Platform: This chart compares engagement efficiency across short video platforms. It helps users see whether a platform is producing active audience response, not only passive views.
Total Videos by Monetization Type: This chart breaks published videos by monetization model. It helps teams understand how much content is ad-supported, sponsored, affiliate-driven, subscription-based, or non-monetized.
Total Views by Region: This chart shows where views are coming from geographically. It supports regional content planning and market-level performance reviews.
Total Production Cost by Creator: This chart compares production spend by creator. It helps managers review creator investment and compare cost against reach, engagement, and revenue on other pages.
Platform Mix
3 – Creator View
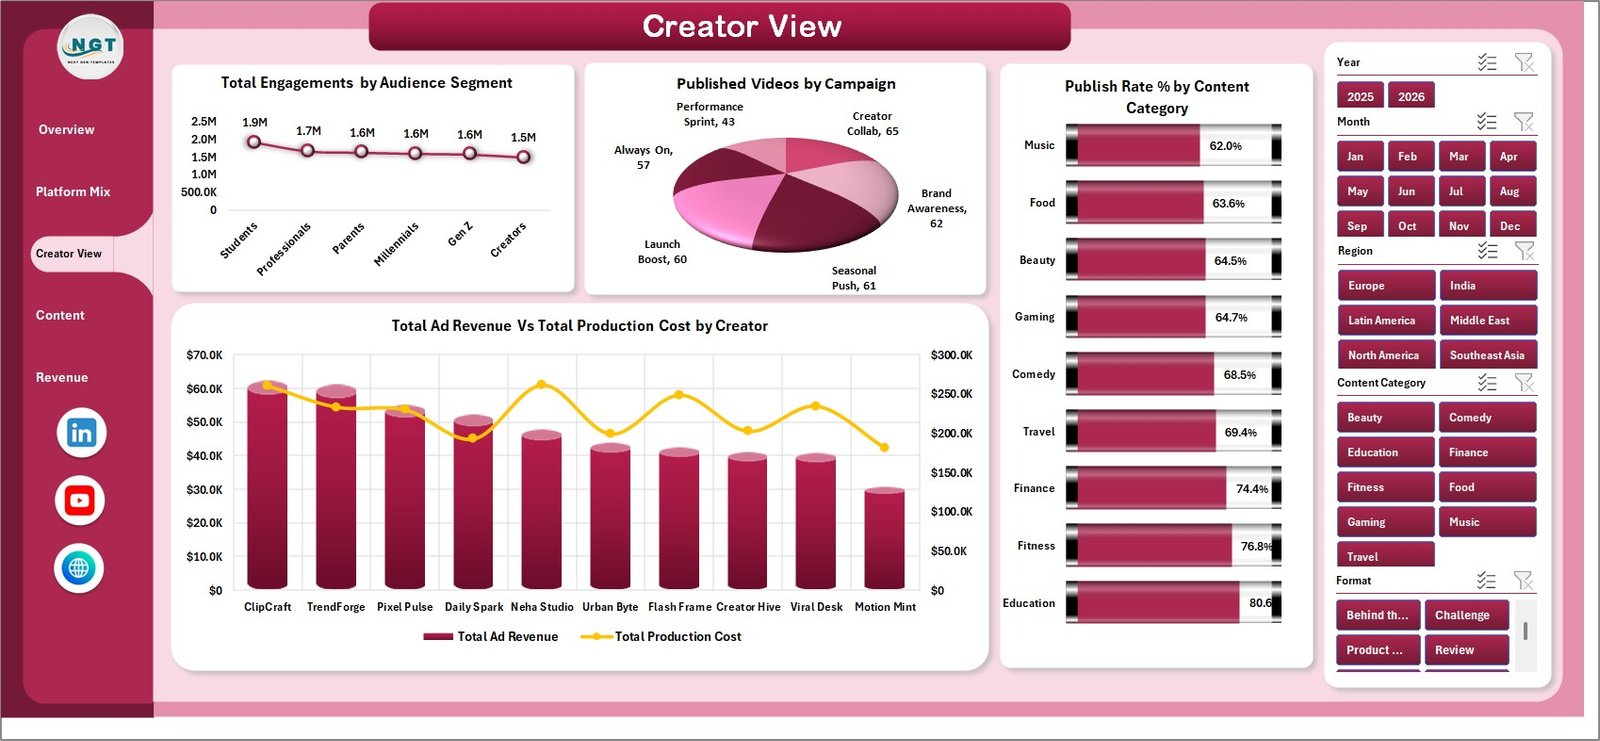
The Creator View sheet is designed for creator managers, agency leads, and brand teams that need to review audience response, campaign contribution, publishing consistency, and creator profitability.
Total Engagements by Audience Segment: This chart compares engagement by audience group. It helps identify which segments are most responsive to short video content.
Published Videos by Campaign: This chart shows campaign output volume. It helps teams check whether campaigns received enough content coverage.
Publish Rate % by Content Category: This chart compares publishing consistency by category. It helps planners find content themes where execution is strong or weak.
Total Ad Revenue Vs Total Production Cost by Creator: This chart compares revenue and production cost for each creator. It helps teams identify profitable creators and creators who may need budget, format, or topic adjustments.
Creator View
4 – Content
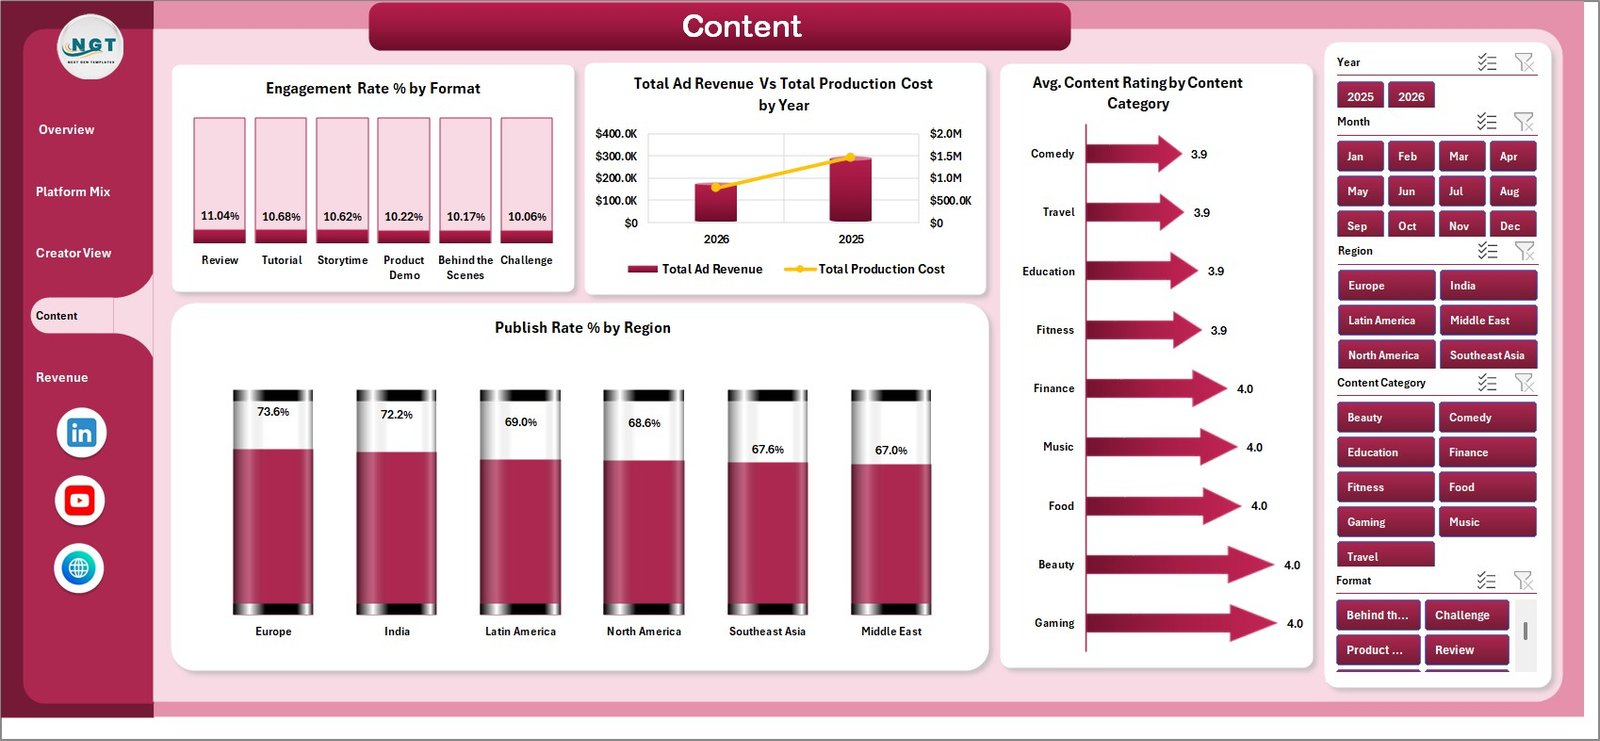
The Content sheet helps users evaluate formats, yearly monetization, regional publish performance, and category-level quality.
Engagement Rate % by Format: This chart compares engagement rate across formats such as tutorials, trends, product demos, interviews, and challenges. It helps teams decide which creative formats deserve more production time.
Total Ad Revenue Vs Total Production Cost by Year: This chart compares annual monetization with annual cost. It helps users evaluate whether short video programs are becoming more efficient over time.
Publish Rate % by Region: This chart compares publishing consistency by region. It helps regional teams understand where content calendars are being followed.
Avg. Content Rating by Content Category: This chart compares content quality scores by category. It helps teams identify topics that need stronger scripting, editing, hooks, or audience targeting.
Content
5 – Revenue
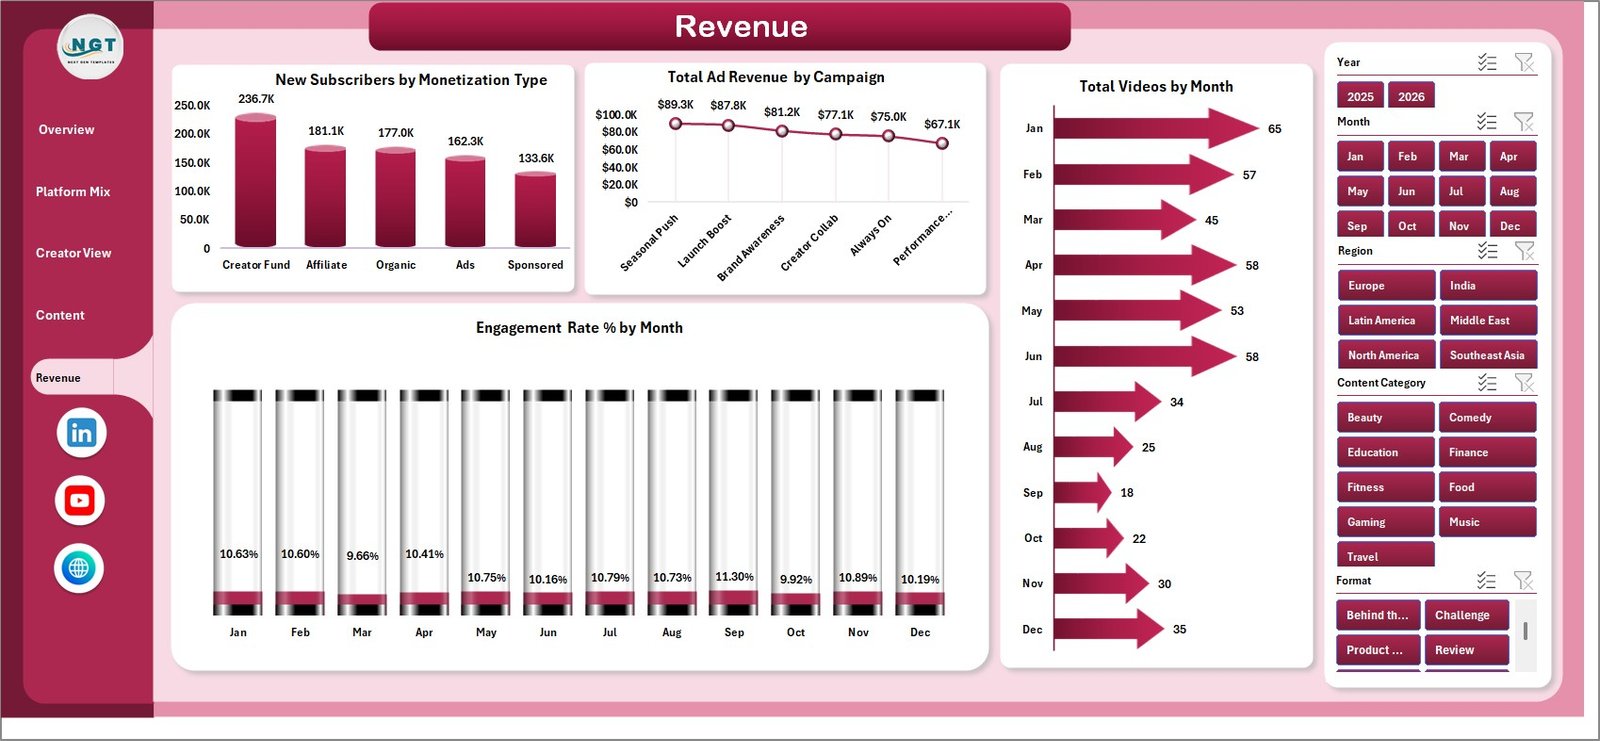
The Revenue sheet brings subscriber growth, monetization, engagement trend, and publishing volume into one view.
New Subscribers by Monetization Type: This chart shows subscriber growth by monetization model. It helps users see which content revenue strategy is also helping audience growth.
Total Ad Revenue by Campaign: This chart compares ad revenue across campaigns. It supports campaign-level ROI reviews and future budget planning.
Engagement Rate % by Month: This chart tracks engagement efficiency over time. It helps teams spot months where audience response improved or declined.
Total Videos by Month: This chart shows publishing volume by month. It helps users connect output level with views, watch hours, engagement, and revenue.
Revenue
6 – Data Sheet Tab
The Data Sheet is where you add your short video platform data in the same format as the sample records. Keep the column headers and structure unchanged so the KPI cards, slicers, pivot tables, and charts continue to work correctly.

Data Sheet tab
7 – Support Sheet
The Support Sheet contains multiple pivot tables used to create the entire dashboard dynamically. After updating the Data Sheet, go to the Data tab in the Excel ribbon and click Refresh All. Microsoft explains that Excel users can refresh PivotTables and connected data through refresh commands. Once refreshed, the dashboard cards and charts update. You can keep this sheet hidden for regular users.

Support sheet tab
Short Video Platforms Dashboard in Excel vs. Google Sheets vs. Paid Social Media SaaS – Feature Comparison
| Feature | This Excel Dashboard | Google Sheets Alternative | Paid Social Media SaaS |
|---|---|---|---|
| Cost | One-time template purchase | Low software cost but manual dashboard setup | Recurring monthly or annual subscription |
| Platform | Microsoft Excel | Google Sheets | Vendor-hosted web app |
| Setup time | Replace data and refresh pivots | Build formulas, charts, and filters manually | Connect accounts and configure reports |
| Customization | Edit sheets, pivots, charts, slicers, and labels | Editable but must be maintained manually | Depends on vendor permissions |
| Short video reporting fit | Best for editable management reporting | Best for cloud-first teams | Best for live platform integrations |
Who Should Use This Template
This template is useful for creator economy teams, short video agencies, social media managers, influencer marketing teams, YouTube Shorts creators, TikTok creators, Instagram Reels managers, media startups, brand content teams, and analysts who need a repeatable Excel dashboard for short video performance.
It is not a replacement for a live social media scheduler, publishing tool, ad manager, content approval workflow, or API-based social listening platform. It works best when your performance data can be exported from platform tools and pasted or imported into Excel.
Real-World Use Cases
Aisha, social media manager: reviews monthly views, watch hours, engagement rate, and new subscribers before planning next month’s content calendar.
Daniel, creator partnerships lead: compares ad revenue and production cost by creator before renewing creator contracts.
Meera, agency analyst: filters campaigns, regions, platforms, and content categories to prepare a client performance review.
Advantages of Short Video Platforms Dashboard in Excel
- It keeps platform, content, creator, audience, campaign, cost, and revenue metrics in one workbook.
- It uses familiar Excel features, including slicers, charts, pivot tables, and editable data sheets.
- It helps teams compare reach, engagement, quality, subscribers, and monetization side by side.
- It can be customized for different platforms, regions, creators, formats, campaigns, and monetization types.
Opportunities for Improvement
This dashboard does not automatically pull data from TikTok, YouTube, Instagram, or Snapchat APIs. Users need to export or prepare their data and keep the Data Sheet structure consistent. Teams that need live scheduling, automatic comments analysis, or account-level API sync may still need a dedicated social media analytics platform.
Best Practices
- Keep the Data Sheet columns in the same order when adding new records.
- Refresh all pivot tables after updating the source data.
- Review views together with watch hours so viral reach is not mistaken for deep attention.
- Compare ad revenue with production cost before increasing spend on a creator or campaign.
- Use slicers to isolate platform, region, creator, campaign, audience segment, format, and monetization type.
Explore Relevant Templates
You can download the product here: Short Video Platforms Dashboard in Excel.
You may also like these related template categories: Excel Dashboard Templates and MS Excel Templates.
Frequently Asked Questions
What does the Short Video Platforms Dashboard in Excel track?
It tracks views, watch hours, ad revenue, publish rate, new subscribers, engagements, content rating, videos, monetization type, region, production cost, audience segment, campaign, format, platform, creator, content category, year, and month.
Can I use this dashboard for TikTok, YouTube Shorts, and Instagram Reels?
Yes. You can use it for any short video platform if your data follows the same structure used in the Data Sheet.
Do I need advanced Excel skills?
No. You mainly need to replace the sample data and refresh the workbook. Advanced users can customize charts, pivots, and slicers if needed.
Does the workbook connect directly to social platforms?
No. This is an Excel reporting dashboard, not an API connector. Export your platform data, prepare it in the same format, and refresh the dashboard.
Can the Support Sheet be hidden?
Yes. The Support Sheet contains pivot tables that support the dashboard. You can keep it hidden after setup.
Can agencies use this for client reporting?
Yes. Agencies can use slicers and page-level analysis to prepare platform, creator, campaign, and regional reporting for clients.
About the Author
Built by PK – Microsoft Certified Professional with 15+ years of Excel, Google Sheets, and Power BI experience. Founder of NextGenTemplates, reaching 300K+ subscribers across YouTube channels. Every template is hand-built and tested before release.
Conclusion
The Short Video Platforms Dashboard in Excel gives content teams a practical way to review short video reach, watch time, engagement, publishing consistency, subscribers, monetization, cost, and campaign performance in one workbook. Instead of rebuilding reports every month, you can update the Data Sheet, refresh the pivots, and use the dashboard pages for creator reviews, campaign reporting, platform comparison, and revenue planning.
For more Excel, Google Sheets, and Power BI tutorials, visit PK: An Excel Expert on YouTube.
Sources: DataReportal Global Social Media Statistics and Microsoft Excel Support.