Garden retail is a seasonal, low-margin, staff-heavy business. A single bedding-plant category can account for 40% of spring revenue but only 18% of net profit, and most garden center owners don’t see that gap until the season is over. The Garden Center Dashboard in Power BI closes that visibility gap — 5 headline KPIs, 5 interactive analysis pages, 14 DAX-driven visuals, and slicer-based filtering across Category, Region, Season, Customer Type, Payment Method, and Salesperson — all in one .pbix file you can refresh in under 10 minutes.
If you run an independent garden center, manage a plant nursery, or consult for horticulture retailers, this guide walks through every page of the Garden Center Dashboard in Power BI, what it shows, when to use which slicer, and how it compares to spending $89–$289 per register per month on a cloud POS analytics add-on.
👉 Click here to Purchase the Garden Center Dashboard in Power BI
Key Features of Garden Center Dashboard in Power BI
- 5 Live KPI Cards on the Overview page — Total Transactions, Total Cost, Total Revenue, Net Profit, Total Quantity Sold — all recalculating on refresh.
- 14 DAX-Driven Visuals spanning 5 analysis pages: Overview, Sales Trend, Category Analysis, Customer Insights, and Sales Team.
- Multi-Dimensional Slicers on every page for Category, Region, Season, Customer Type, Payment Method, and Salesperson.
- Retail-Ready Data Model with Date, Category, Product, Season, Region, Channel, Customer Type, Salesperson, Status, Quantity, Revenue, Cost, Net Profit, Payment Method, and Satisfaction Score columns.
- Works in Free Power BI Desktop — no Pro license needed unless you publish to Service.
- Under 10 minutes to set up — connect your POS export to the existing schema and refresh.
Dashboard Pages Explanation
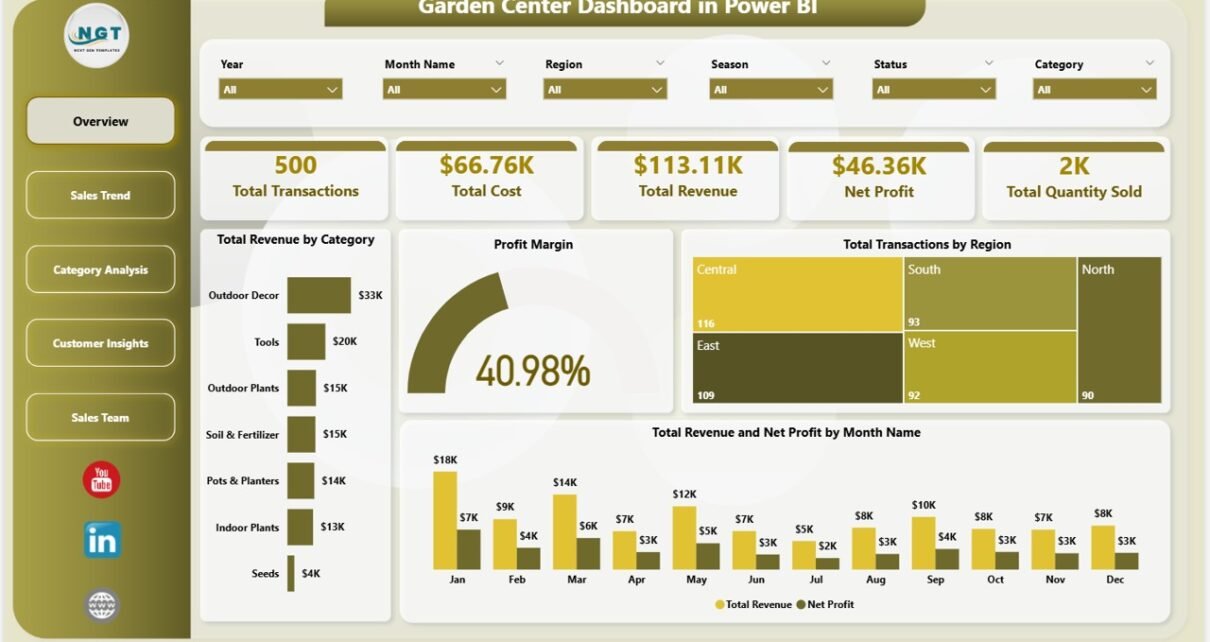
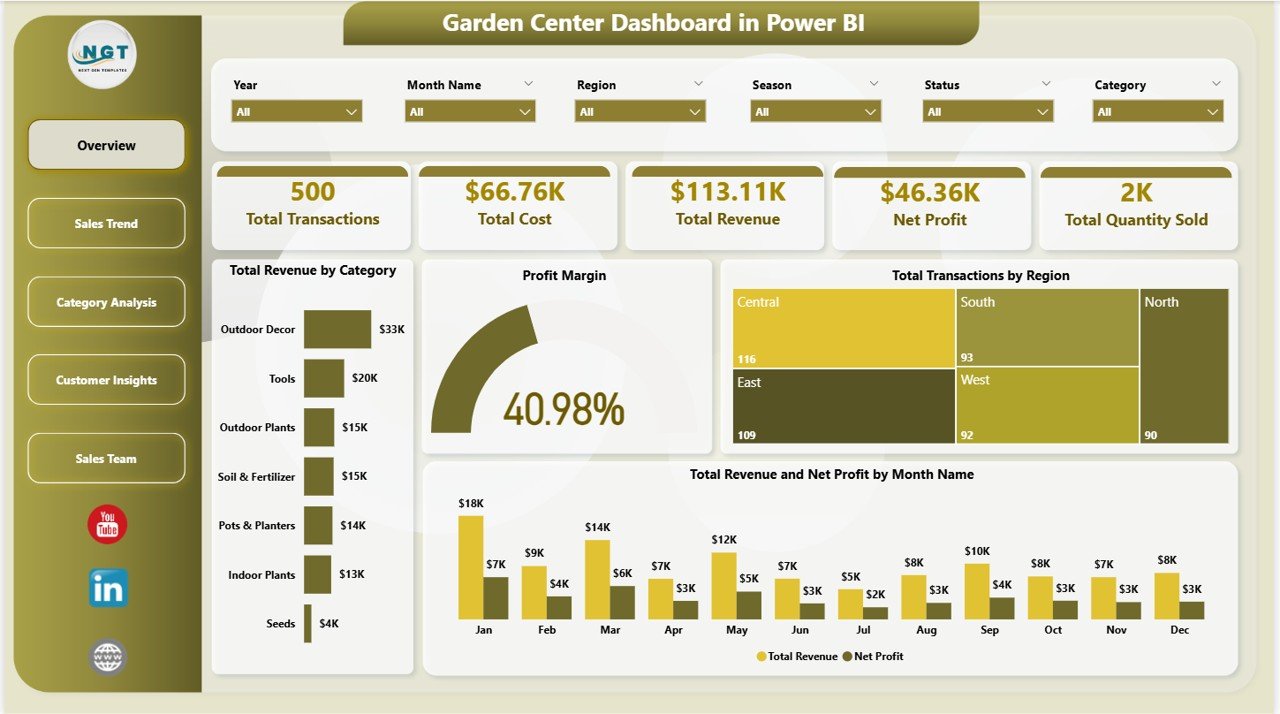
Page 1: Overview Page
The Overview page leads with 5 headline KPI cards — Total Transactions, Total Cost, Total Revenue, Net Profit, and Total Quantity Sold — plus four analysis visuals: Total Revenue by Category, Profit Margin (gauge), Total Transactions by Region, and Total Revenue and Net Profit by Month Name. Three slicers (Category, Region, Season) filter the entire page in one click.
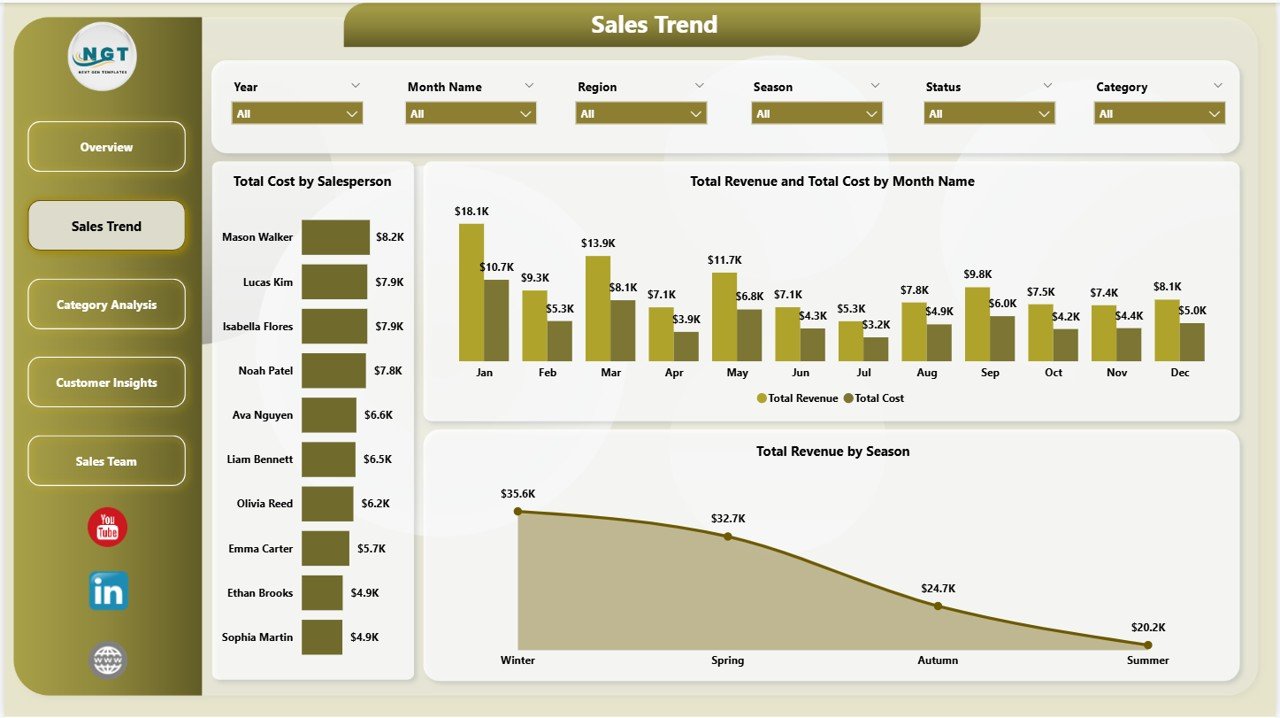
Page 2: Sales Trend
The Sales Trend page tracks month-over-month performance with three visuals: Total Cost by Salesperson, Total Revenue and Total Cost by Month Name, and Total Revenue by Season. This is the page that tells a garden center owner whether Spring or Fall is the real profit driver — not just the revenue peak.
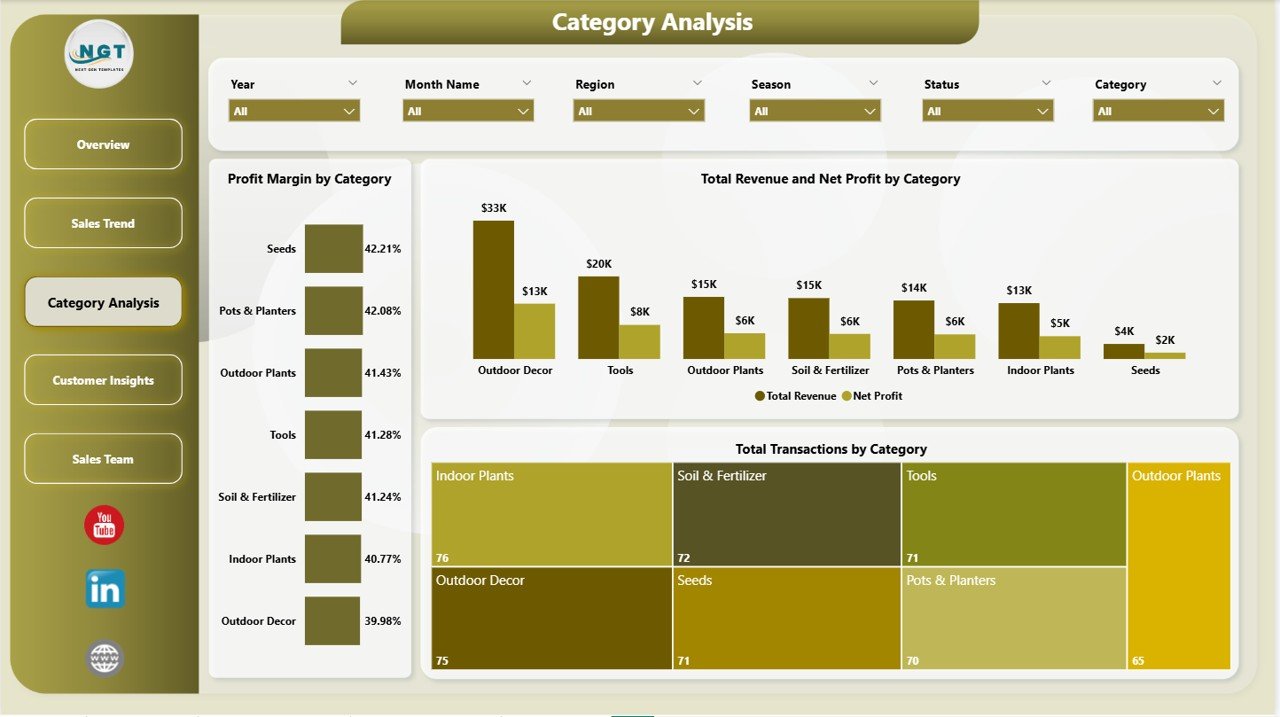
Page 3: Category Analysis
The Category Analysis page is where margin meets mix: Profit Margin by Category (Plants, Soil & Mulch, Pots, Tools, Garden Chemicals, Outdoor Furniture), Total Revenue and Net Profit by Category, and Total Transactions by Category. One screen tells you whether bedding plants pay for themselves — or whether you’re subsidizing them with tool sales.
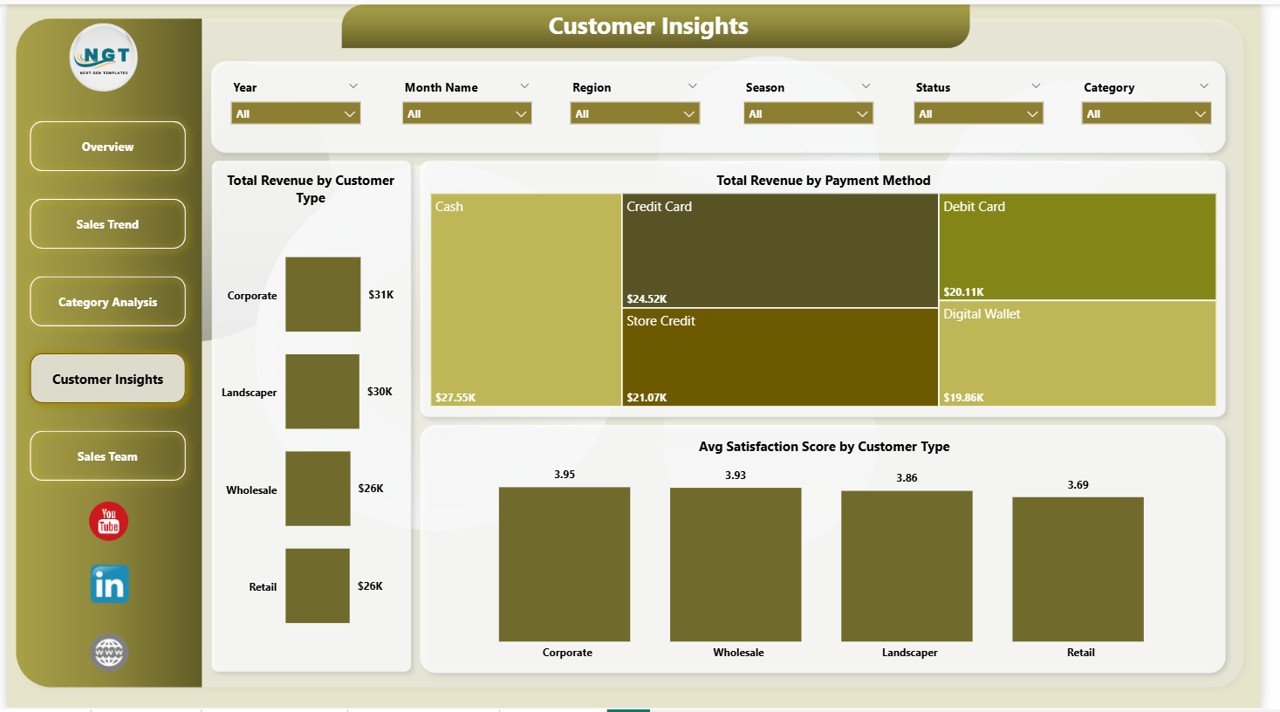
Page 4: Customer Insights
The Customer Insights page splits revenue and loyalty across three views: Total Revenue by Customer Type (Retail Shopper vs Landscaper vs B2B), Total Revenue by Payment Method (Cash, Card, UPI, Net Banking), and Avg Satisfaction Score by Customer Type. Loyalty programs, credit terms, and payment-acceptance strategy all flow from these three visuals.
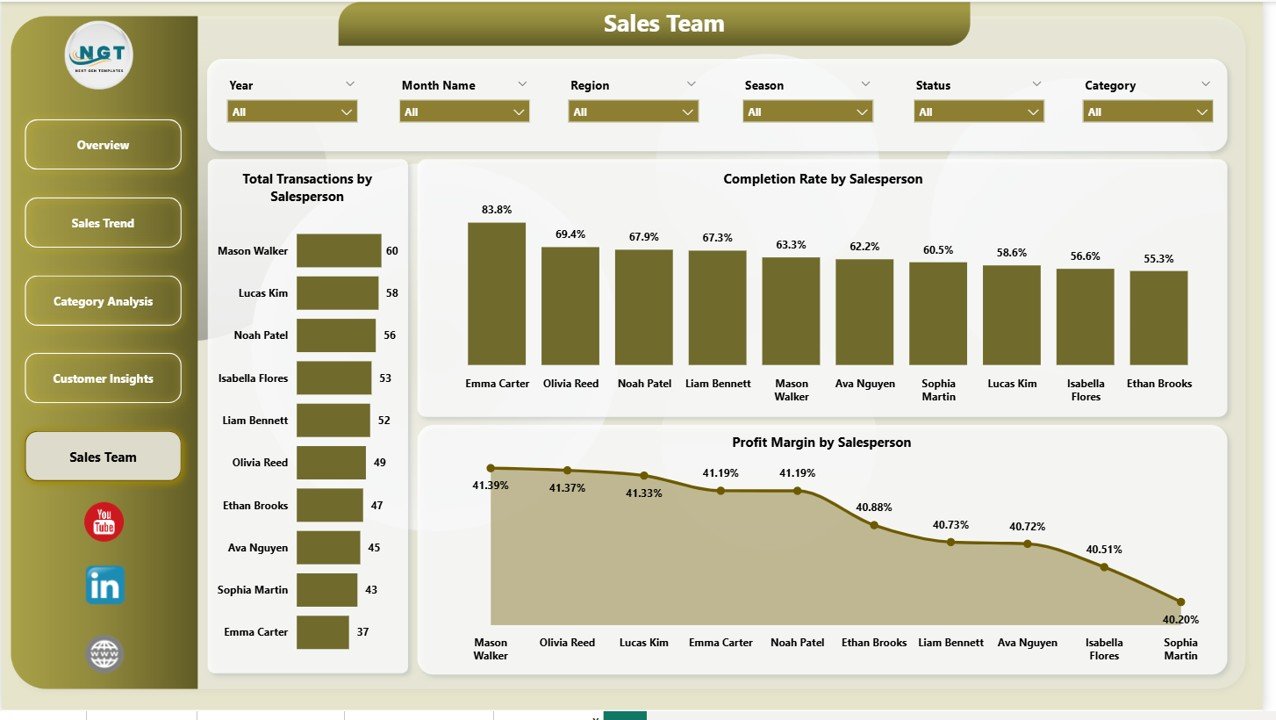
Page 5: Sales Team
The Sales Team page benchmarks every staff member on volume, completion, and margin: Total Transactions by Salesperson, Completion Rate by Salesperson, and Profit Margin by Salesperson. It is the single most actionable page for commission structure and coaching.
Garden Center Dashboard in Power BI vs. Tableau / Qlik vs. Lightspeed Retail / Shopify POS — Feature Comparison
| Feature | Garden Center Dashboard in Power BI | Tableau / Qlik | Lightspeed Retail / Shopify POS |
|---|---|---|---|
| Cost | $17.99 one-time ✅ | $70–$840 / user / year | $89–$289 / register / month |
| Platform | Power BI Desktop (free) ✅ | Tableau / Qlik Cloud | Vendor cloud POS |
| Setup time | Under 10 minutes ✅ | 1–5 days | 2–5 days |
| Real-time team collaboration | Via Power BI Service (Pro) | ✅ Native | ✅ Native |
| Mobile access | Power BI mobile app ✅ | Tableau Mobile ✅ | Dedicated app ✅ |
| Customizable DAX & Power Query | Full access ✅ | Different syntax | ❌ Fixed reports |
| Share with link | Via Power BI Service | Via Tableau Cloud | Via vendor portal |
| Year-1 cost at 5 users | $17.99 total ✅ | $3,500–$4,200 | $5,340–$17,340 |
| Profit Margin by Salesperson view | Pre-built ✅ | DIY | Paid add-on |
For garden centers and plant nurseries that want full Power BI analytics without paying $3,000+ a year for Tableau or $5,000+ for cloud POS analytics, the Garden Center Dashboard in Power BI sits in the sweet spot.
Who Should Use This Template
Perfect for:
- Independent garden center owners running 1–10 retail locations
- Plant nursery managers tracking seasonal sales and salesperson performance
- Multi-location garden retailers needing region-level slicers and store benchmarking
- Retail analysts and consultants advising garden, outdoor, or horticulture clients
- Power BI–comfortable owners who want analytics without per-user SaaS fees
Not a fit if:
- You need row-level security with Active Directory or SSO across 50+ stores
- You’ve never opened Power BI Desktop and don’t want to learn it
- You need integrated payment processing and inventory in one system
- You need live, real-time POS streaming (this template uses scheduled refresh)
Real-World Use Cases
Maya owns an independent garden center in suburban Ohio. Spring is her big season — bedding plants, mulch, seed packets — but she had no way to see which category was actually profitable week-by-week. She refreshes her POS export every Monday morning, filters the Overview by Season = Spring, and instantly sees that her hanging-basket category is doing 3× the margin of her fertilizer category. Spring display space reallocated from one chart.
Arjun runs a plant nursery in Pune with 4 salespeople. He was guessing who was closing high-value landscaping consults and who was stuck selling ₹150 seedlings. The Sales Team page showed him Profit Margin by Salesperson and Completion Rate by Salesperson side by side — he restructured commissions within a week. Two months later his team’s blended margin rose 9 points.
Linda consults for 6 small garden retailers across Texas. She replaced her old PowerPoint reporting stack with this one template — refresh each client’s data, screenshot the slicer-filtered visuals, email the PDF. One Power BI dashboard, six clients, zero per-user subscription fees.
Advantages of Garden Center Dashboard in Power BI
- One-time $17.99 vs $89+/month per register — Year-1 savings of $1,000+ vs Lightspeed Retail, $3,000+ vs Tableau, on a single comparable analytics layer.
- Pre-built DAX measures — Total Revenue, Total Cost, Net Profit, Profit Margin %, Total Transactions, Total Quantity, Avg Satisfaction, and Completion Rate are written, tested, and ready.
- Slicer-first design — Filter by Region, Season, or Customer Type without writing a single line of DAX or Power Query.
- Cross-platform sibling — The Garden Center Dashboard in Excel offers the same architecture for teams that live in spreadsheets.
- 100% data ownership — Your .pbix stays on your machine; no telemetry, no automatic cloud sync.
Opportunities for Improvement
The Garden Center Dashboard in Power BI uses scheduled refresh from your POS export by default — not a live DirectQuery connection. For most independent retailers that’s the right trade-off (simpler, faster, no gateway needed), but if you specifically need always-live POS data, you’ll either need to set up a DirectQuery source or use this template alongside your POS’s native dashboards.
There is also no row-level security pre-configured. For multi-store chains where each store manager should only see their own store’s data, you’ll need to add RLS roles in Power BI Desktop. Microsoft documents the pattern thoroughly in the official Power BI row-level security guide.
Best Practices
- Refresh the data on the same day each week (e.g., Monday morning) so trend visuals stay consistent.
- Use the Region slicer to compare stores — combined with the Season slicer, this is the highest-value view for inventory ordering.
- Always pair Profit Margin by Salesperson with Completion Rate by Salesperson before making commission decisions. High margin with low completion can mean cherry-picking deals.
- Save a dated copy of the .pbix file each month to build a rolling history without bloating the active file.
- Publish to Power BI Service (Pro license) if more than two team members need to view the report on mobile or in a browser.
Explore Relevant Templates
- Garden Center Dashboard in Excel — the cross-platform sibling, same 5-page architecture in Microsoft Excel
- Landscaping Services Dashboard in Power BI — adjacent service-business analytics
- Photography Business Dashboard in Power BI — same Power BI architecture for service-based small businesses
- Print Shop Dashboard in Power BI — adjacent retail vertical with similar customer-and-margin analytics
- Browse all Power BI Dashboard Templates
Frequently Asked Questions
How much does the Garden Center Dashboard in Power BI cost compared to Tableau?
The Garden Center Dashboard in Power BI is a one-time $17.99 purchase. Tableau Creator licenses start at roughly $70 per user per month — over $840 per year per user. For a 5-person garden retail team, that’s $4,200 a year vs $17.99 once. This template delivers the reporting layer on Microsoft Power BI Desktop (free), with no per-seat fees.
How long does setup take?
Setup for the Garden Center Dashboard in Power BI takes under 10 minutes. Extract the .zip, open the .pbix file in Power BI Desktop, replace the sample transactions with your own data in the existing schema, and click Home → Refresh. Every KPI card, slicer, and visual across all 5 pages recalculates automatically.
Can this handle multi-location garden center chains?
Yes. The Garden Center Dashboard in Power BI includes a Region column and a Total Transactions by Region visual on the Overview page. Add a location code per row, and the Region slicer on every page filters the whole report by store or delivery zone instantly. The model has been tested with up to 100,000 transaction rows on a typical 16 GB laptop.
What version of Power BI do I need?
Microsoft Power BI Desktop (free) is sufficient to open, edit, and refresh the file locally. Power BI Pro ($14/user/month) is only required if you want to publish to Power BI Service and share via link. The template uses standard DAX and Power Query patterns documented in the official Microsoft Power BI documentation.
Can I add new categories or salespeople without breaking anything?
Yes. Add new rows to the source data and click Home → Refresh. The DAX measures, slicers, and visuals in the Garden Center Dashboard in Power BI all use dynamic field references, so new dimension values appear automatically without rewriting anything.
Is my data stored on Microsoft’s cloud or sent to NextGenTemplates?
No. The Garden Center Dashboard in Power BI is a standalone .pbix file stored only on your computer. There is no telemetry, no account requirement, no automatic cloud sync. If you choose to publish to Power BI Service, the data is stored in your own Microsoft tenant — under your control.
Does this come with an Excel or Google Sheets version?
Yes — the Garden Center Dashboard in Excel is the cross-platform sibling, with the same 5-page structure built on pivot tables and slicers. Pick the Power BI version if you want DAX, dynamic visuals, and Power BI Service publishing.
About the Author
Built by PK — Microsoft Certified Professional with 15+ years of Excel, Google Sheets, and Power BI experience. Founder of NextGenTemplates, reaching 300K+ subscribers across YouTube channels (@PK-AnExcelExpert, @NextGenTemplates, @NeoTechNavigators). Every template is hand-built and tested before release.
Conclusion
If you run a garden center, manage a plant nursery, or consult for horticulture retailers, the Garden Center Dashboard in Power BI replaces $3,000+ per year of cloud POS analytics with a one-time $17.99 .pbix file. Five interactive pages, 14 DAX-driven visuals, slicer filtering on every page, and a clean retail-ready data model — all in Microsoft Power BI Desktop (free).
👉 Click here to Purchase the Garden Center Dashboard in Power BI
Instant download · One-time payment · No subscription · Lifetime updates
🎥 Visit our YouTube channel for step-by-step video tutorials: YouTube.com/@PK-AnExcelExpert
📅 Last updated: May 2026