Dropshipping operators spend an average of $3,200 per year on analytics SaaS tools — Triple Whale alone runs $129-499/month, Polar runs $150-400/month, and dedicated marketplace analytics (Helium 10, Jungle Scout, eRank) add another $50-100/month each. The Drop Shipping Dashboard in Power BI replaces all of those with a single $17.99 one-time purchase that runs entirely in Power BI Desktop, tracking 5 core KPIs across 5 interactive report pages and 13+ pre-built visuals.
If you’re running a multi-channel dropshipping store on Shopify, Amazon, eBay, Etsy, or TikTok Shop, you already know the analytics problem: every marketplace has its own dashboard, every ad platform has its own attribution model, and every supplier has its own spreadsheet. The Drop Shipping Dashboard in Power BI consolidates all of that into one DAX-driven .pbix file with multi-slicer filtering, so you can answer the questions that actually matter for profit — which channel has the highest ROAS, which category has the best margin, which supplier is killing your delivery rate — in 2-3 clicks instead of 2-3 hours.
👉 Click here to Purchase the Drop Shipping Dashboard in Power BI
Key Features of the Drop Shipping Dashboard in Power BI
The Drop Shipping Dashboard ships as a single .pbix file with 5 interactive report pages, all driven by DAX measures on a shared data model. Here’s what makes it different from a generic ecommerce template:
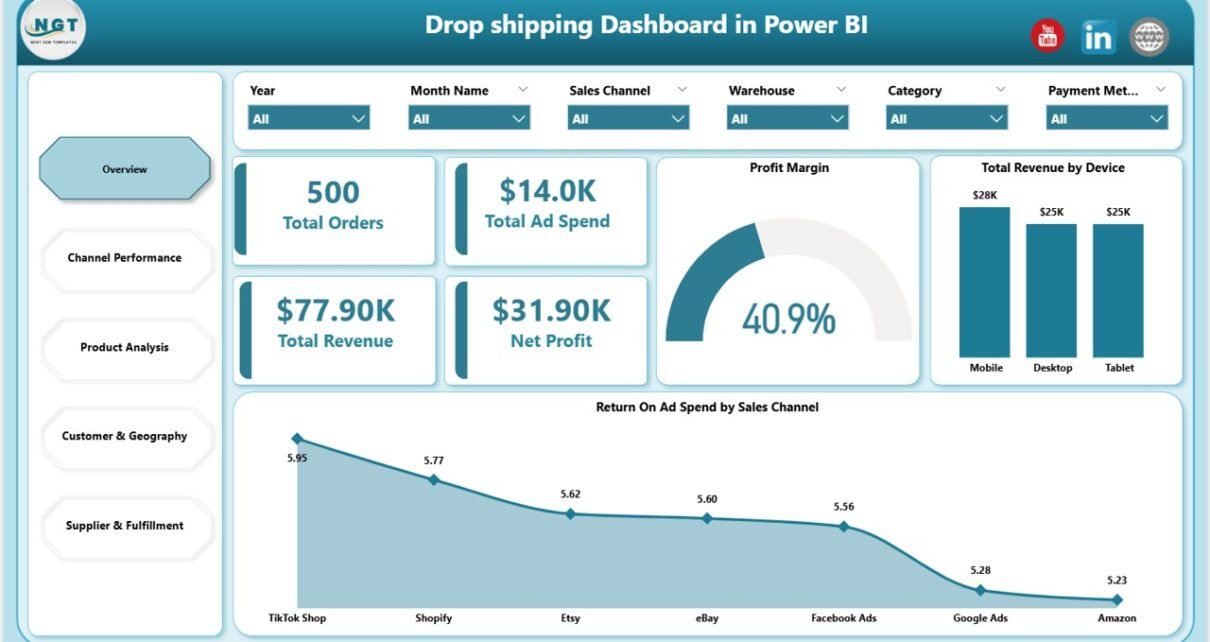
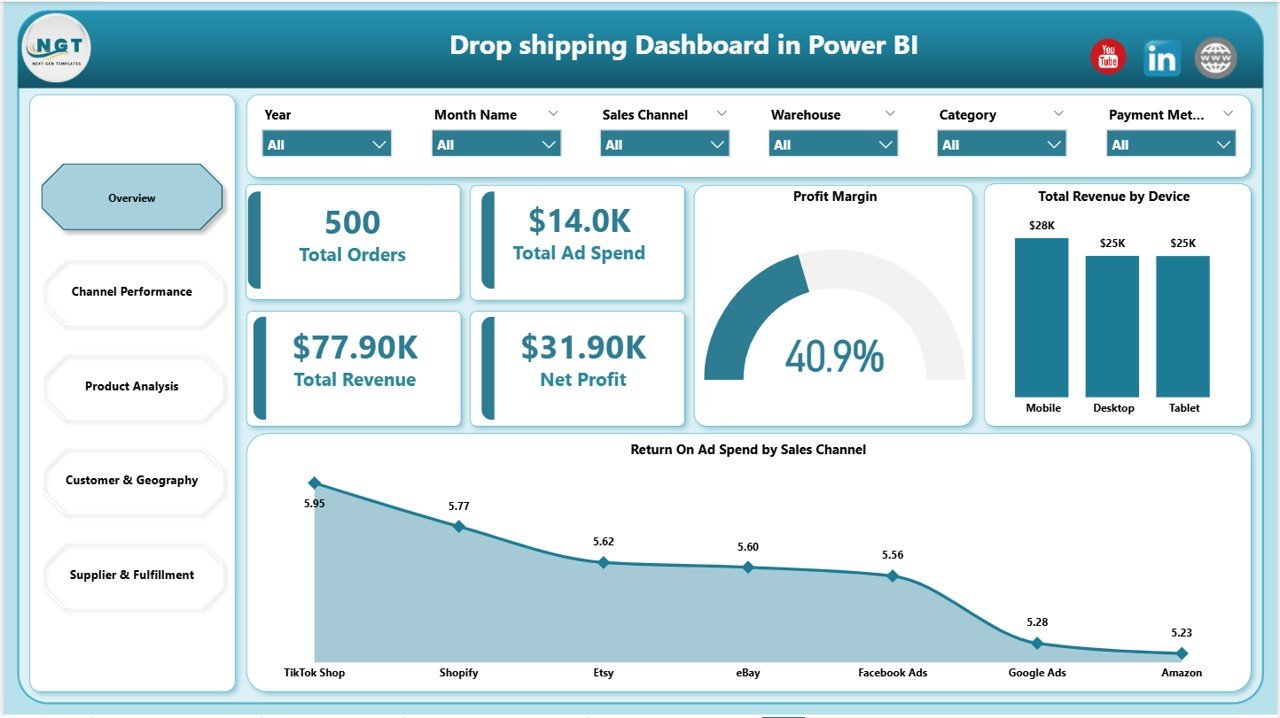
- 5 Executive KPI Cards on the Overview page — Total Orders, Total Ad Spend, Total Revenue, Net Profit, and Profit Margin. These are the five numbers most dropshipping operators need to see before anything else, calculated dynamically through DAX.
- 13+ Pre-Built Visuals — Every chart is connected to the data model via DAX measures. No need to drag fields, define aggregations, or write new measures.
- Multi-Slicer Filtering on every page — Filter by Sales Channel (Shopify, Amazon, eBay, Etsy, TikTok Shop), Date Range, Country, Supplier, Category, Device, and Payment Method. Slicer clicks cascade across the entire report through Power BI’s cross-filter behavior.
- One-Click Refresh Architecture — After updating your source data, click Home > Refresh and every visual and KPI updates simultaneously.
- Supplier & Fulfillment Visibility — Pre-built visuals for revenue by supplier, delivery rate by supplier, and return rate by warehouse — three numbers that decide whether a dropshipping store scales or stalls.
- Customer Geography Analytics — Total orders and revenue split by your top 5 customer countries, plus revenue by payment method. Helps you decide where to scale ad spend and which payment options drive conversion.
Dashboard Pages Explanation
The Drop Shipping Dashboard splits analytics into 5 logical pages, each answering a specific business question. Slicers at the top of every page filter all visuals on that page (and cross-filter related pages where bookmarks are configured).
Page 1: Overview
This page shows 5 KPI cards (Total Orders, Total Ad Spend, Total Revenue, Net Profit, Profit Margin) and charts including Total Revenue by Device and Return On Ad Spend by Sales Channel. The Overview page is the first thing you see when opening the .pbix file — it’s designed to answer “how did the business do this period?” in under 5 seconds.
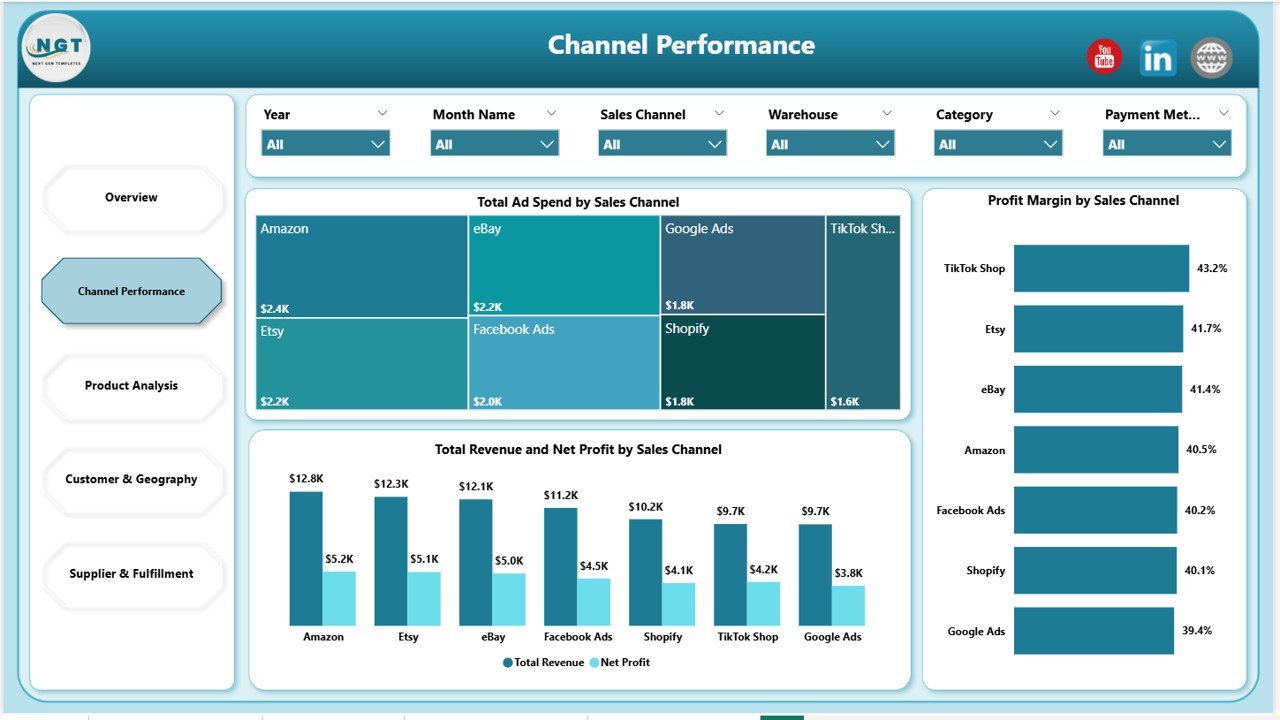
Page 2: Channel Performance
This page shows Total Ad Spend by Sales Channel, Total Revenue and Net Profit by Sales Channel, and Profit Margin by Sales Channel. It exists to answer one specific question: “which channel is actually profitable, not just busy?” Before you scale ad spend on any channel, this page tells you whether last month’s spend was justified.
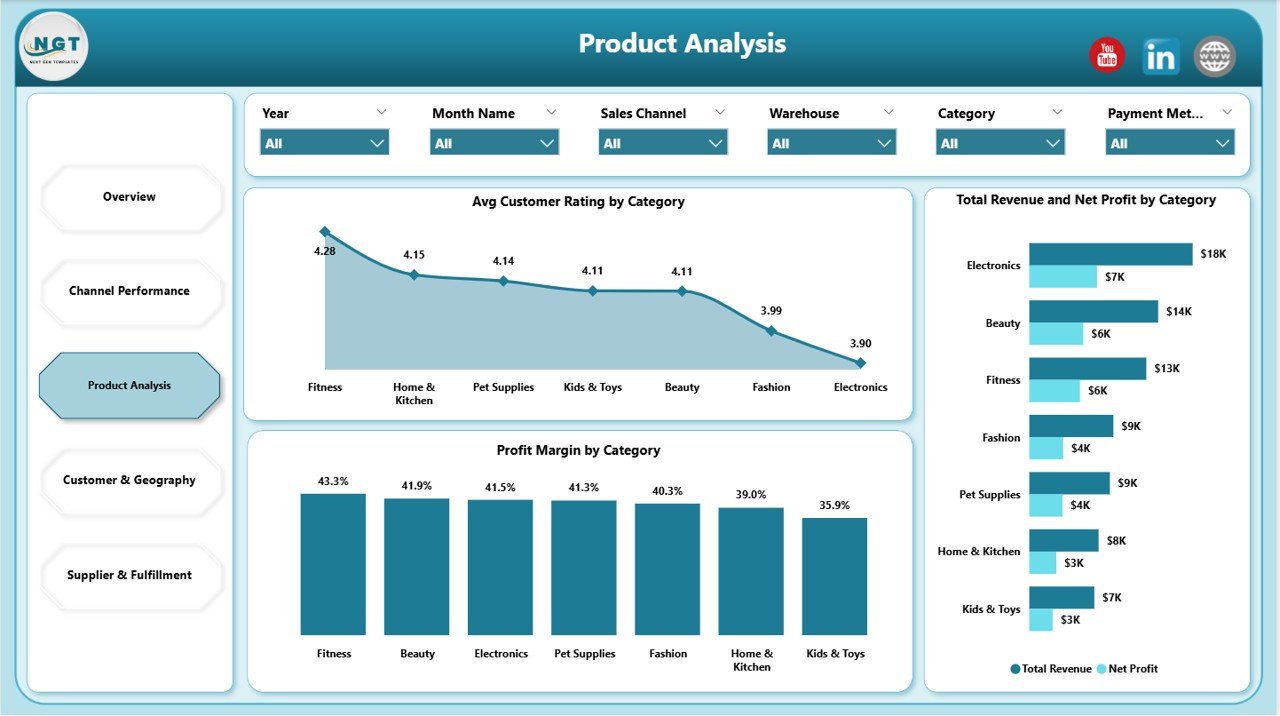
Page 3: Product Analysis
This page shows Avg Customer Rating by Category, Profit Margin by Category, and Total Revenue and Net Profit by Category. Use this page to identify hero SKUs, dead inventory, and the categories whose customer ratings are dragging down repeat purchases. The juxtaposition of margin and rating in one view is the key insight — high-margin categories with low ratings need attention, not more ad spend.
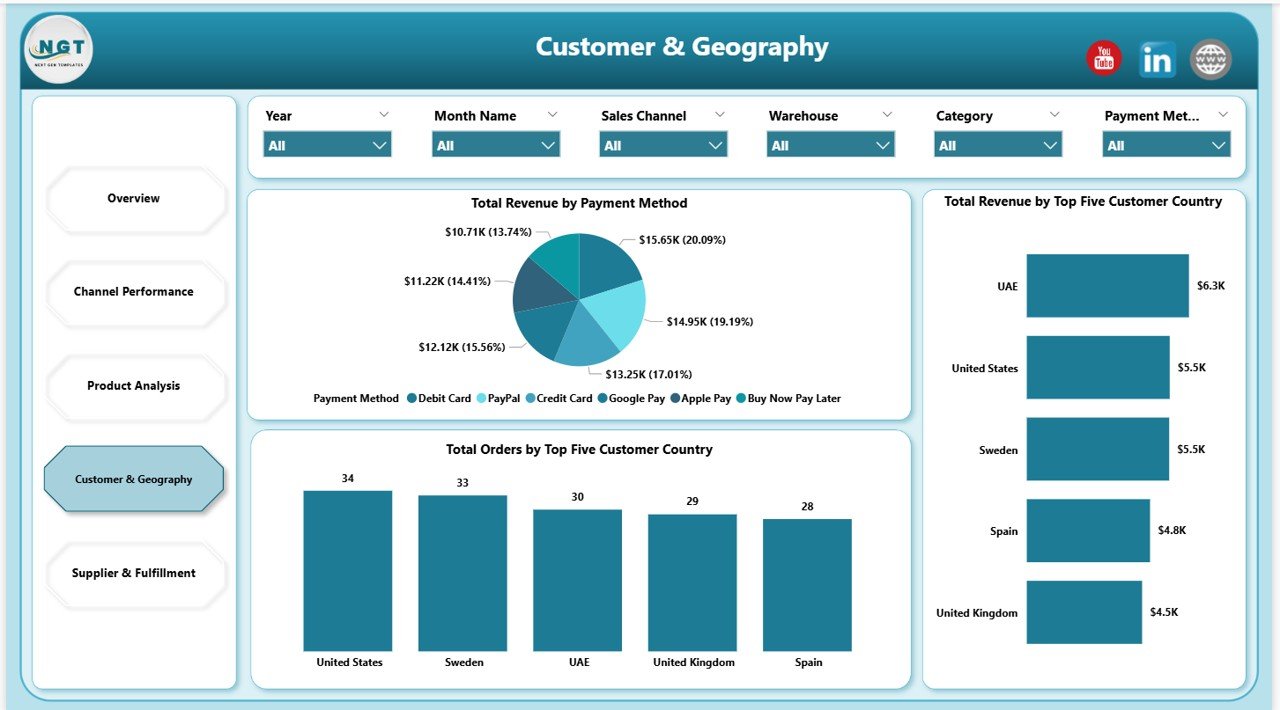
Page 4: Customer & Geography
This page shows Total Revenue by Payment Method, Total Orders by Top Five Customer Country, and Total Revenue by Top Five Customer Country. The “top 5 country” pattern keeps the view focused — if you’re shipping to 40 countries but 80% of revenue comes from 5, this page surfaces that automatically. Pair it with payment-method data to decide which payment options to prioritize at checkout.
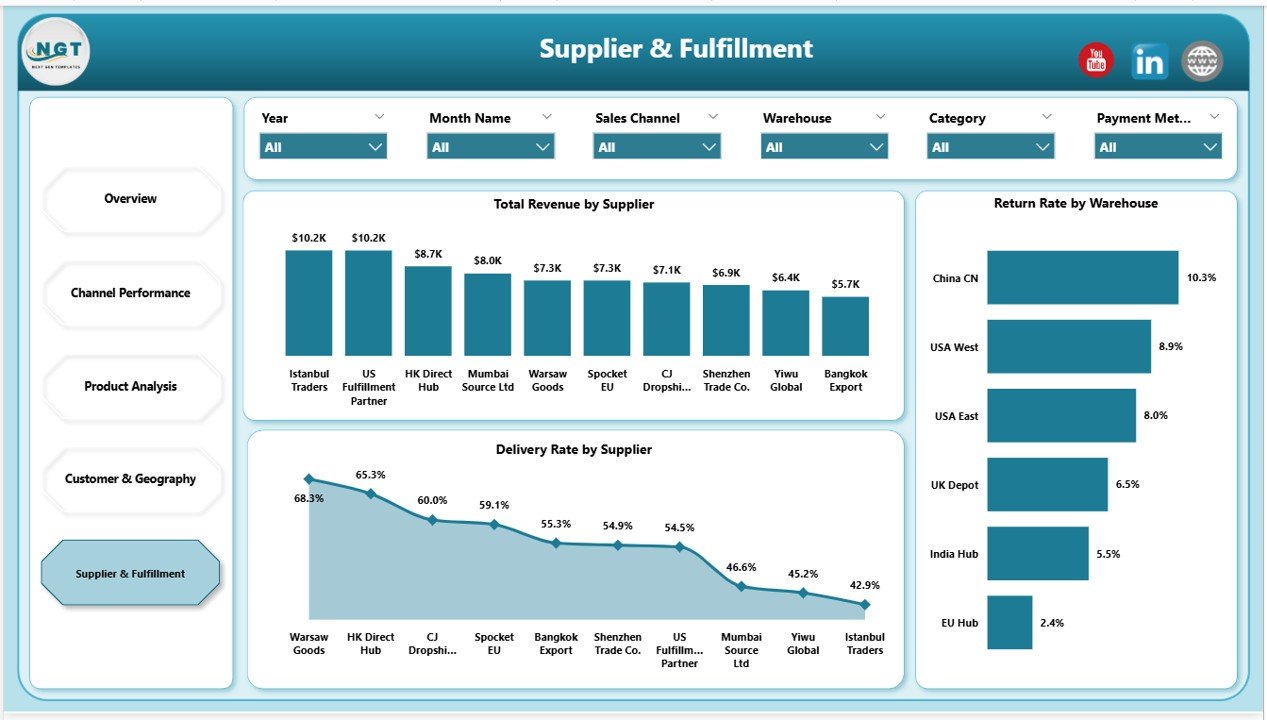
Page 5: Supplier & Fulfillment
This page shows Total Revenue by Supplier, Delivery Rate by Supplier, and Return Rate by Warehouse. Critical for any operator running 3+ suppliers where one bad fulfillment partner can erase a month of margin. Most dropshipping templates ignore the supplier side entirely — this dashboard makes it page 5 instead of a footnote.
Drop Shipping Dashboard in Power BI vs. Tableau / Qlik vs. Triple Whale / Polar — Feature Comparison
| Feature | Drop Shipping Dashboard in Power BI | Tableau / Qlik alternative | Triple Whale / Polar |
|---|---|---|---|
| Cost | $17.99 one-time | $70-150 / user / month | $129-499 / month |
| Platform | Power BI Desktop (free) | Tableau / Qlik Cloud | Cloud SaaS |
| Setup time | Under 10 minutes | 1-3 days | 2-5 days (integrations) |
| Sales channel ROAS (Shopify, Amazon, eBay, TikTok) | ✅ Pre-built | Build from scratch | ✅ Auto-sync |
| Supplier cost & margin tracking | ✅ Pre-built | Manual modeling | ❌ Not native |
| Works offline / private data | ✅ | ❌ | ❌ |
| Year-1 cost at 5 users | $17.99 | $4,200 – $9,000 | $1,548 – $5,988 |
| Customizable DAX & visuals | ✅ Full Power BI access | ✅ Tableau Calc | Limited (UI only) |
For dropshippers who want channel ROAS, supplier margin, and customer geography in one Power BI file without paying $1,500+ per year for a SaaS analytics suite or $4,000+ per year for Tableau, the Drop Shipping Dashboard in Power BI sits in the sweet spot.
Who Should Use This Template
Perfect for:
- Solo dropshippers and small teams running Shopify, WooCommerce, or multi-marketplace stores ($10K-$500K monthly revenue)
- Operators selling on 2+ channels (Shopify + Amazon, Etsy + TikTok Shop) who need a single ROAS view in Power BI
- Stores using 3+ dropshipping suppliers who need supplier-level delivery rate and return rate tracking
- Agencies or consultants delivering monthly Power BI performance reports to dropshipping clients
- Power BI-comfortable founders who already use Power BI Desktop for other reporting
Not a fit if:
- You need real-time API sync with Shopify, Meta Ads, or Google Ads (use Triple Whale or Polar)
- Your team works entirely in Google Sheets or Excel and won’t open .pbix files
- You need published Power BI Service workspaces with row-level security (this is a Desktop .pbix)
- You want a real-time mobile app — Power BI mobile works but requires publishing to Power BI Service with a Pro license
Real-World Use Cases
Marcus runs a 4-person Shopify dropshipping team selling pet accessories on Shopify, Amazon, and TikTok Shop. He uses the Drop Shipping Dashboard in Power BI every Monday morning to review the previous week’s ROAS by channel. Last quarter he killed his TikTok Shop spend after the dashboard surfaced a 0.8x ROAS while Shopify direct was running at 3.2x. He replaced his $199/month Triple Whale subscription with this $17.99 file, saving roughly $2,380 per year.
Priya is a Mumbai-based ecommerce consultant managing 7 dropshipping clients. She drops each client’s monthly export into a copy of this Power BI dashboard and exports a 5-page PDF report straight from Power BI Desktop. Setup takes 8 minutes per client. Before this, she was spending 3 hours per client building reports from scratch in Tableau. Across 7 clients, that’s 21 hours saved per month — billable hours she now spends on strategy work instead.
Jamie operates a solo print-on-demand store with 12 suppliers across AliExpress, Printful, and Spocket. The Supplier & Fulfillment page surfaced that one supplier was running a 14% return rate vs. 3% for the rest — Jamie swapped suppliers and recovered roughly $4,200/month in margin. The dashboard paid for itself 200x over in the first quarter.
Advantages of the Drop Shipping Dashboard in Power BI
The Drop Shipping Dashboard’s biggest advantage is total cost of ownership. A $17.99 one-time purchase versus $1,548-$5,988 per year for Triple Whale or Polar means the dashboard pays for itself within the first day of use. Other advantages include:
- Offline-first architecture — Your order data, supplier costs, and customer information stay on your local machine. No SaaS telemetry, no third-party data access.
- Fully customizable DAX — Every measure is unlocked. Add new KPIs, modify aggregations, or build entirely new pages without contacting support.
- Native Power BI Desktop performance — DAX measures evaluate in milliseconds even on 100K+ row datasets, far faster than browser-based SaaS dashboards.
- Publishable to Power BI Service — If you upgrade to Power BI Pro ($14/user/month), you can publish the .pbix to Power BI Service for browser/mobile access and scheduled refresh.
- Zero vendor lock-in — Built on Microsoft Power BI, the world’s most widely-adopted BI tool. No proprietary file format to worry about.
Opportunities for Improvement
Being honest about limitations builds trust, and there are a few worth flagging:
- No automatic API sync — Data refresh is manual. You’ll need to export CSVs from Shopify, Amazon Seller Central, and your ad platforms, then refresh the Power Query data source. Triple Whale and Polar auto-sync this; this dashboard does not.
- Windows-first — Power BI Desktop runs on Windows. Mac users will need a Windows VM (Parallels, UTM) or use the web-based Power BI Service via a Pro license.
- Single data source design — The .pbix is designed around one consolidated order table. If you want to model returns, refunds, and chargebacks separately, you’ll need to extend the model.
- Pro license required for publishing — To share via the Power BI Service workspace, every viewer needs a Pro license ($14/user/month). Free embedding via Publish to Web is available but is public-facing only.
Best Practices
To get the most out of the Drop Shipping Dashboard in Power BI, follow these proven practices:
- Refresh weekly, not daily — Dropshipping numbers swing day-to-day. Looking at week-over-week or month-over-month trends gives better signal than daily ROAS noise.
- Standardize channel names in your source data — “Shopify Direct” and “shopify direct” become two different channels in the slicer. Use a single naming convention.
- Tag suppliers with country codes — When the same product ships from three different suppliers in three countries, prefix supplier names with country codes (e.g., “CN-Supplier1”, “US-Supplier2”) so the supplier slicer doubles as a country filter.
- Build bookmarks for monthly reviews — Use Power BI’s bookmark feature to save common slicer states like “Last 30 days, Shopify only” or “All channels, Q4”. Switch between them with one click.
- Export to PDF for stakeholder reports — Power BI Desktop exports the entire 5-page report to PDF in one click via File > Export > Export to PDF. Perfect for monthly board reports or client deliverables.
Explore Relevant Templates
Looking for adjacent templates? Browse our full Power BI Dashboard Templates library, or pick from these direct fits:
- 📊 Subscription Box Dashboard in Power BI — adjacent ecommerce model (recurring revenue + churn)
- 💳 Buy-Now-Pay-Later Platforms Dashboard in Power BI — checkout payment optimization
- 🛒 Ecommerce Conversion Rate KPI Dashboard in Google Sheets — pair with this to plug funnel leaks
- 🏪 Etsy Seller Analytics Dashboard in Google Sheets — for sellers focused exclusively on Etsy
- 📊 Also available as: Dropshipping Dashboard in Excel for teams who prefer the Excel pivot engine over Power BI’s DAX engine
Frequently Asked Questions
What KPIs does the Drop Shipping Dashboard in Power BI track?
The Drop Shipping Dashboard in Power BI tracks 5 core KPIs (Total Orders, Total Ad Spend, Total Revenue, Net Profit, Profit Margin) plus 13+ visual-level metrics including ROAS by sales channel, profit margin by category, supplier delivery rate, warehouse return rate, and revenue by top 5 customer country. All metrics are calculated through DAX measures.
How long does setup take?
Setup for the Drop Shipping Dashboard in Power BI takes under 10 minutes. Download and unzip the .pbix, open it in Power BI Desktop, point the data source at your own order-level file via Power Query Editor, and click Home > Refresh. Every visual, KPI card, and slicer updates automatically through the pre-built DAX measures.
How does this compare to Triple Whale or Polar?
The Drop Shipping Dashboard in Power BI is a $17.99 one-time purchase versus Triple Whale’s $129-499 monthly subscription. The trade-off is that Power BI requires manual data refresh (CSV export from Shopify or marketplace), while Triple Whale auto-syncs via API. For stores under $500K monthly revenue, the Power BI option saves $1,500-$6,000 per year.
Do I need a Power BI Pro license?
No. The Drop Shipping Dashboard runs entirely in Power BI Desktop, which is a free download from Microsoft. You only need Power BI Pro ($14/user/month) if you want to publish the report to the Power BI Service for browser/mobile access or scheduled refresh.
Which sales channels does the Drop Shipping Dashboard support?
The Drop Shipping Dashboard in Power BI supports any sales channel you have data for. The sample dataset uses Shopify, Amazon, eBay, Etsy, and TikTok Shop, but you can rename or add channels in the source data. The slicer auto-populates from your data, so adding a new channel requires zero DAX edits.
Can I customize the colors and add my logo?
Yes. The Drop Shipping Dashboard in Power BI uses a standard Power BI report theme, so you can edit colors via the theme JSON file, swap to any built-in theme under View > Themes, replace fonts, and insert your logo on any page. All visuals and DAX measures are unlocked and fully editable.
Is my data private when using this dashboard?
Yes. The Drop Shipping Dashboard in Power BI is a local .pbix file — your order data, supplier costs, and customer information stay on your computer unless you explicitly publish to the Power BI Service. There’s no telemetry, no analytics tracking, and no third-party data access. This is a key advantage over SaaS analytics tools that store your data on their servers.
About the Author
Built by PK — Microsoft Certified Professional with 15+ years of Excel, Google Sheets, and Power BI experience. Founder of NextGenTemplates, reaching 300K+ subscribers across YouTube channels. Every template is hand-built and tested before release.
Conclusion
The Drop Shipping Dashboard in Power BI is the fastest way to get a multi-channel dropshipping analytics suite without paying $1,500-$6,000 per year for a SaaS subscription. It tracks the 5 KPIs that matter (Orders, Ad Spend, Revenue, Net Profit, Profit Margin), surfaces channel-level ROAS, product category margin, customer geography, and supplier fulfillment performance — all in one .pbix file that opens in the free Power BI Desktop.
👉 Click here to Purchase the Drop Shipping Dashboard in Power BI
✅ Instant download · One-time payment · No subscription
For more Power BI tutorials and template walkthroughs, visit our YouTube channel: Youtube.com/@PK-AnExcelExpert
📅 Last updated: May 2026