New: NextGenTemplates Academy - video courses on Excel formulas with AI and Pivot Tables & dashboards. Early-bird: 20% off with code EARLYBIRD20 - first 20 orders only. See the courses →
  • Learn Excel (Free Course)
    • 1. Shortcut Keys
    • 2. Fill & Flash Fill
    • 3. Find & Replace
    • 4. Sort & Filter
    • 5. Formulas & Functions
    • 6. Data Validation
    • 7. Conditional Formatting
    • 8. Basic Charts
    • 9. Advanced Charts
    • 10. Pivot Tables
    • 11. Excel Dashboards
    • 12. VBA Course
    • 13. Excel Formulas with AI
  • Templates
  • Tutorials
    • Charts and Visualization
    • VBA
    • Excel Tips and Tricks
    • Excel Dashboards
    • Power Pivot & DAX
  • Power BI
  • Template Store
    • Ready to Use Templates
  • Courses
  • Academy
    • Excel + AI Mastery: 100 Formulas
    • Excel Pivot Tables & Dashboards
  • About Us
  • Contact Us

PK: An Excel Expert

Transforming Data into Decisions

Tag: MTD YTD Dashboard Excel

Dashboard Templates

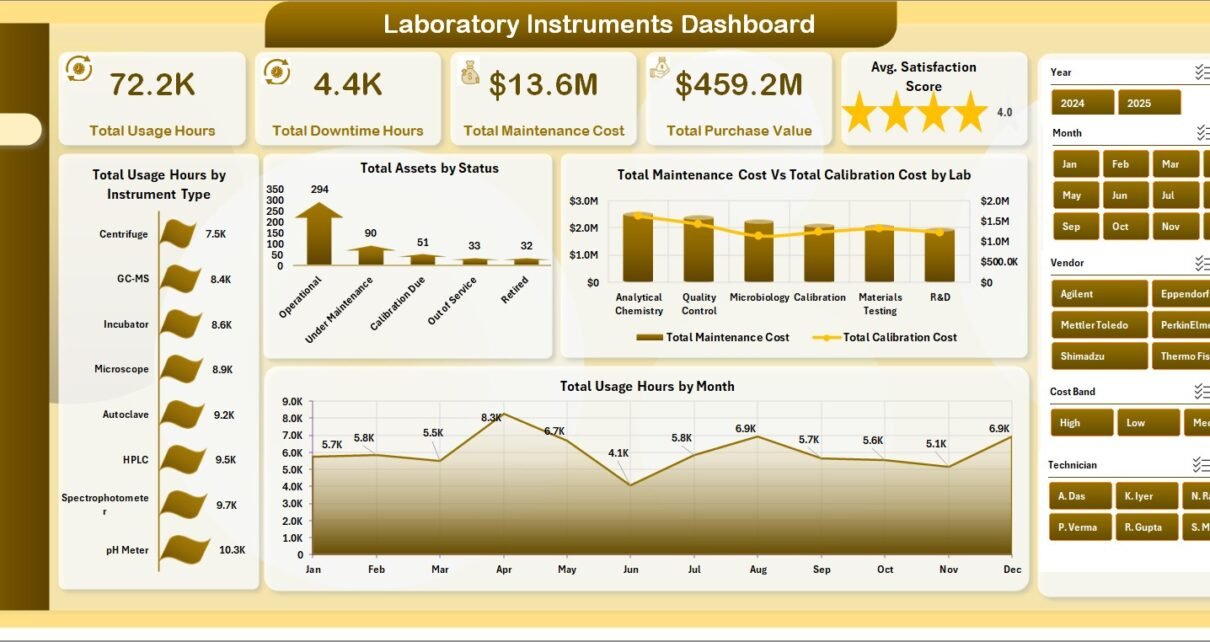
Laboratory Instruments Dashboard in Excel

June 29, 2026June 29, 2026 PKComments Off on Laboratory Instruments Dashboard in Excel
Laboratory Instruments Dashboard in Excel is a ready-to-use reporting template for labs that need clearer visibility into instrument usage, downtime, maintenance cost, calibration cost, asset value, test runs, and inventory
Read More
Dashboard

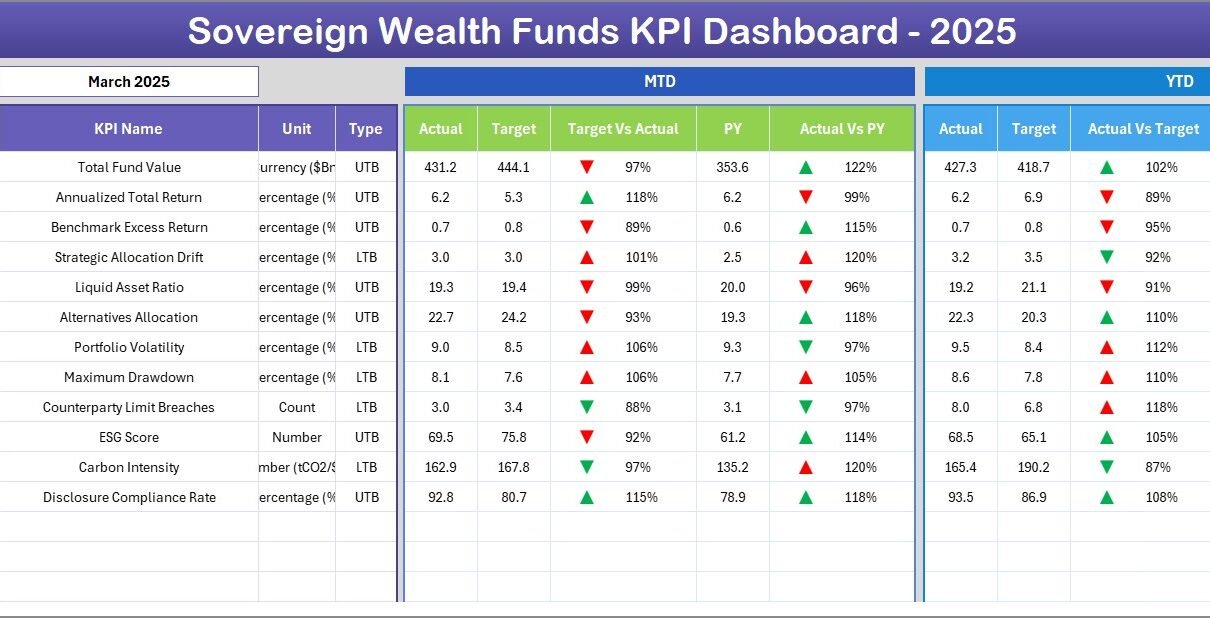
Sovereign Wealth Funds KPI Dashboard in Excel

May 16, 2026May 16, 2026 PKComments Off on Sovereign Wealth Funds KPI Dashboard in Excel
Sovereign Wealth Funds (SWFs) managed over $11.5 trillion in assets globally in 2025, with the top 100 funds growing AUM by 8.4% year-over-year according to the Global SWF 2025 report.
Read More
Templates

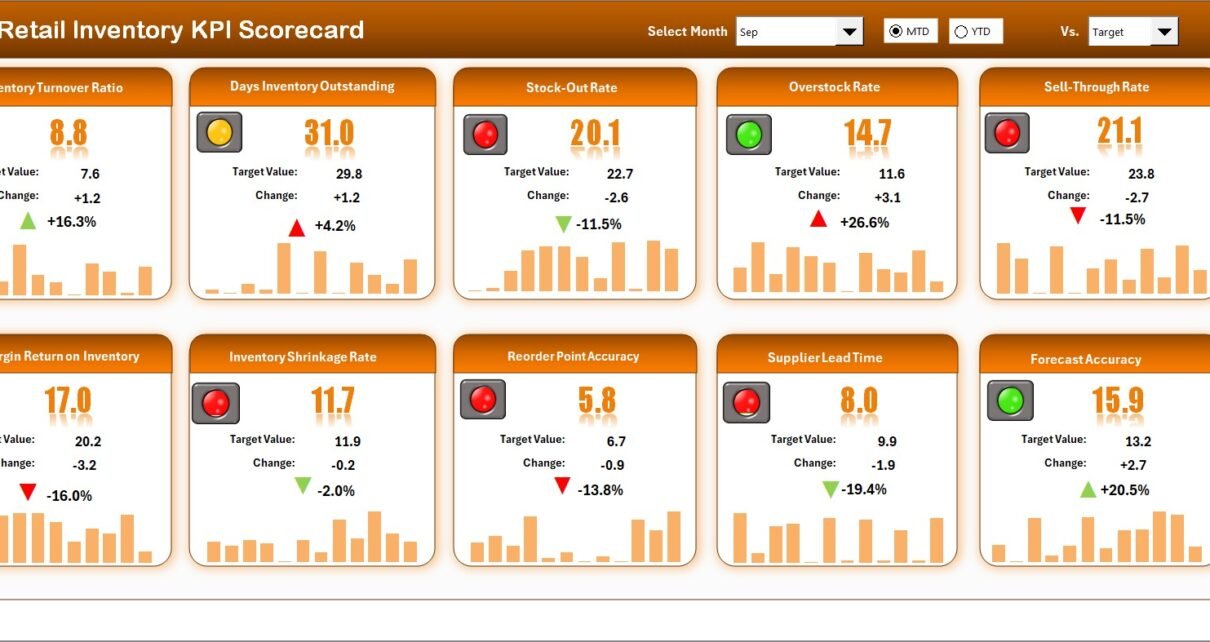
Retail Inventory KPI Scorecard in Excel

February 18, 2026February 18, 2026 PKComments Off on Retail Inventory KPI Scorecard in Excel
Retail businesses move fast. Products arrive daily. Customers expect availability. Margins stay tight. However, many retailers still manage inventory using scattered spreadsheets and manual tracking. As a result, stockouts increase,
Read More
Dashboard

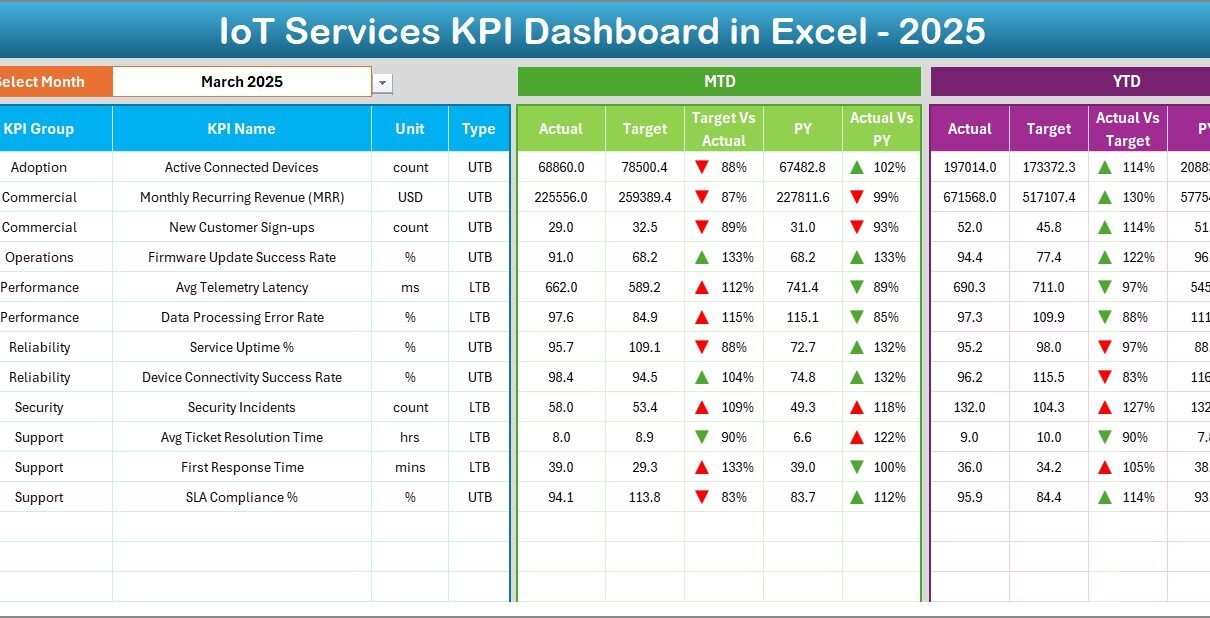
IoT Services KPI Dashboard in Excel

February 18, 2026February 18, 2026 PKComments Off on IoT Services KPI Dashboard in Excel
In today’s connected world, IoT service providers handle massive data streams, device networks, uptime metrics, response times, and customer performance indicators. However, many IoT businesses still rely on scattered spreadsheets
Read More
Dashboard

ERP Consulting KPI Dashboard in Excel

February 17, 2026February 17, 2026 PKComments Off on ERP Consulting KPI Dashboard in Excel
In today’s competitive market, ERP consulting firms must track performance with precision. You cannot rely on scattered spreadsheets or delayed reports. Instead, you need clarity, structure, and control. Therefore, the
Read More
Dashboard

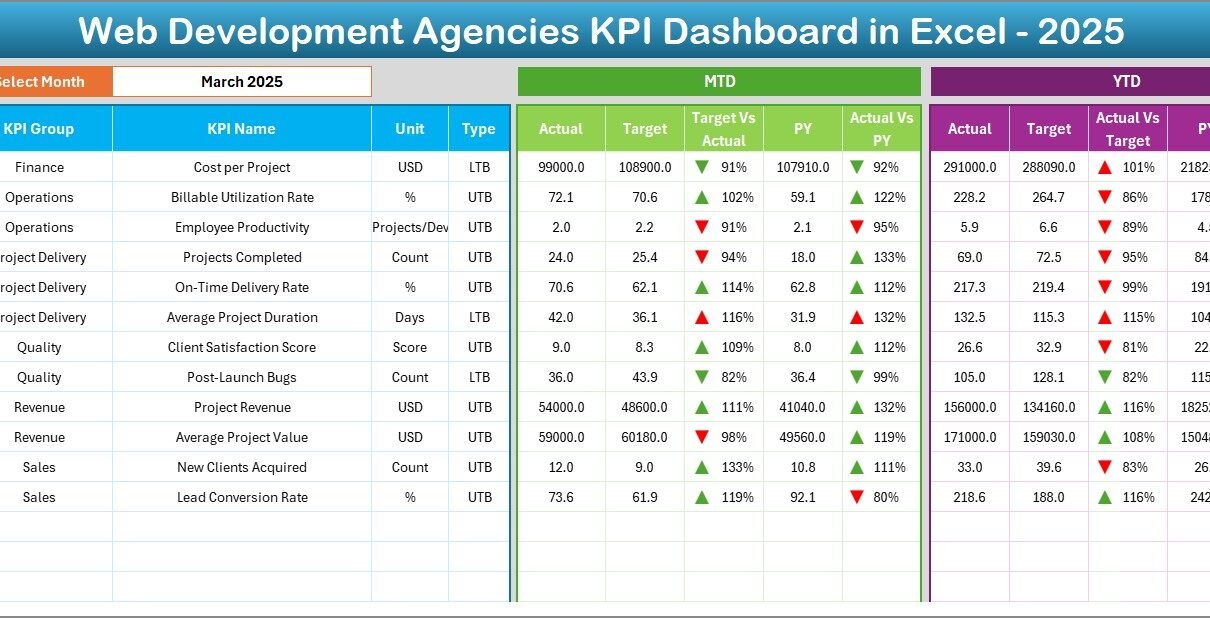
Web Development Agencies KPI Dashboard in Excel

February 17, 2026February 17, 2026 PKComments Off on Web Development Agencies KPI Dashboard in Excel
In today’s fast-moving digital world, web development agencies face intense competition. Clients expect fast delivery. Projects demand quality code. Teams must manage timelines, budgets, and client satisfaction at the same
Read More
Dashboard

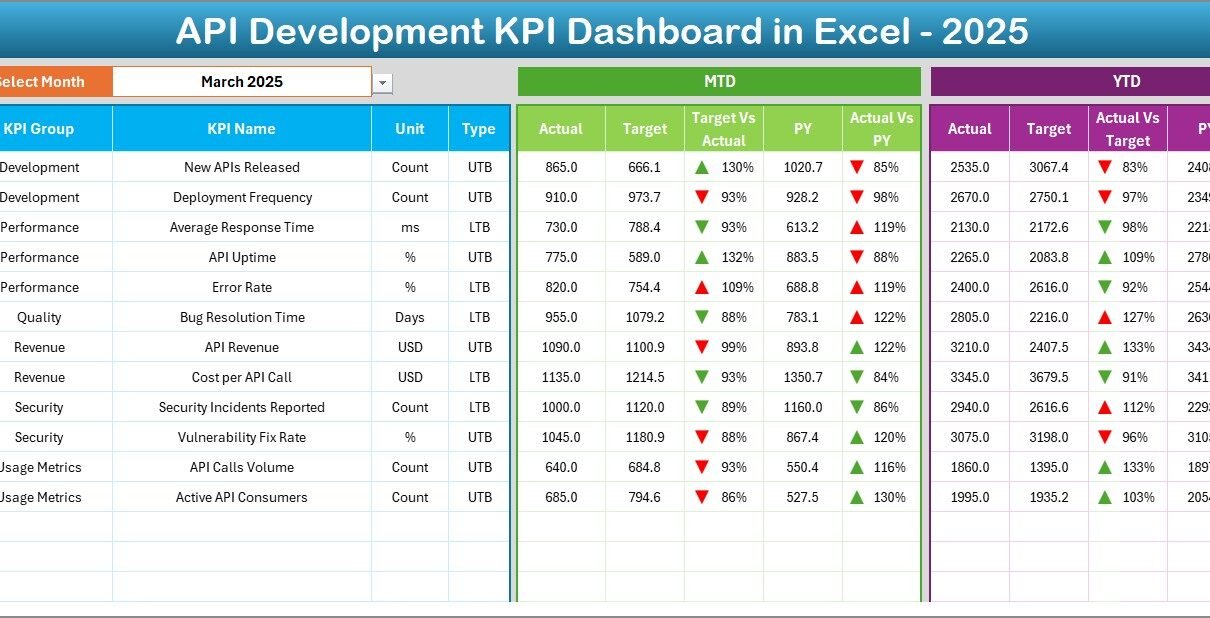
API Development KPI Dashboard in Excel

February 14, 2026February 14, 2026 PKComments Off on API Development KPI Dashboard in Excel
Modern software teams move fast. However, without the right metrics, even the best API teams lose direction. You may release endpoints on time. Yet you may still miss performance targets.
Read More
Dashboard

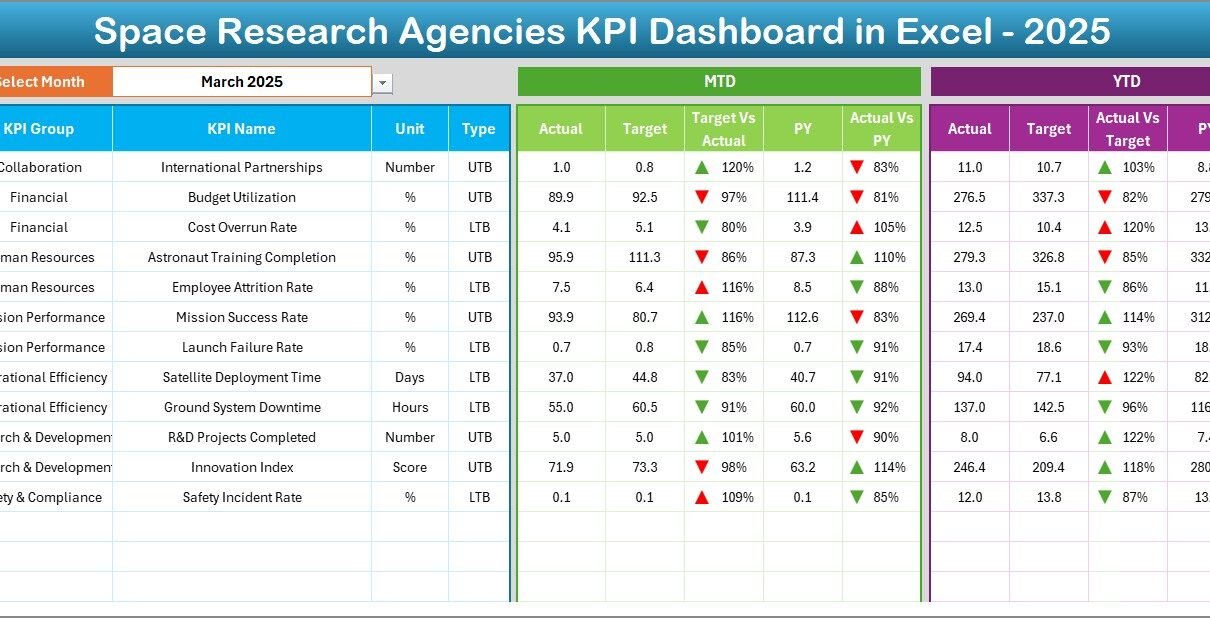
Space Research Agencies KPI Dashboard in Excel

February 13, 2026February 13, 2026 PKComments Off on Space Research Agencies KPI Dashboard in Excel
Space research agencies operate in one of the most complex and high-stakes environments in the world. They manage satellite launches, deep space missions, research projects, technology development, and global collaborations.
Read More
Dashboard

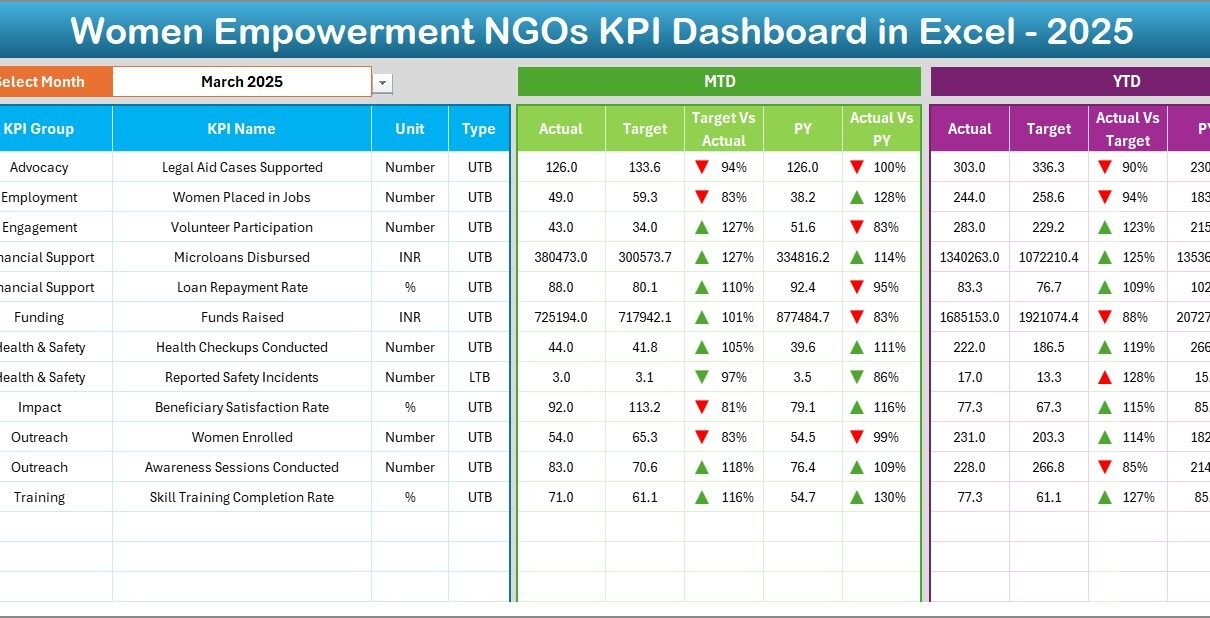
Women Empowerment NGOs KPI Dashboard in Excel

February 13, 2026February 13, 2026 PKComments Off on Women Empowerment NGOs KPI Dashboard in Excel
Women empowerment NGOs work every single day to create change. They support education, provide skill training, improve healthcare access, and protect rights. However, while the mission feels powerful, tracking performance
Read More
Dashboard

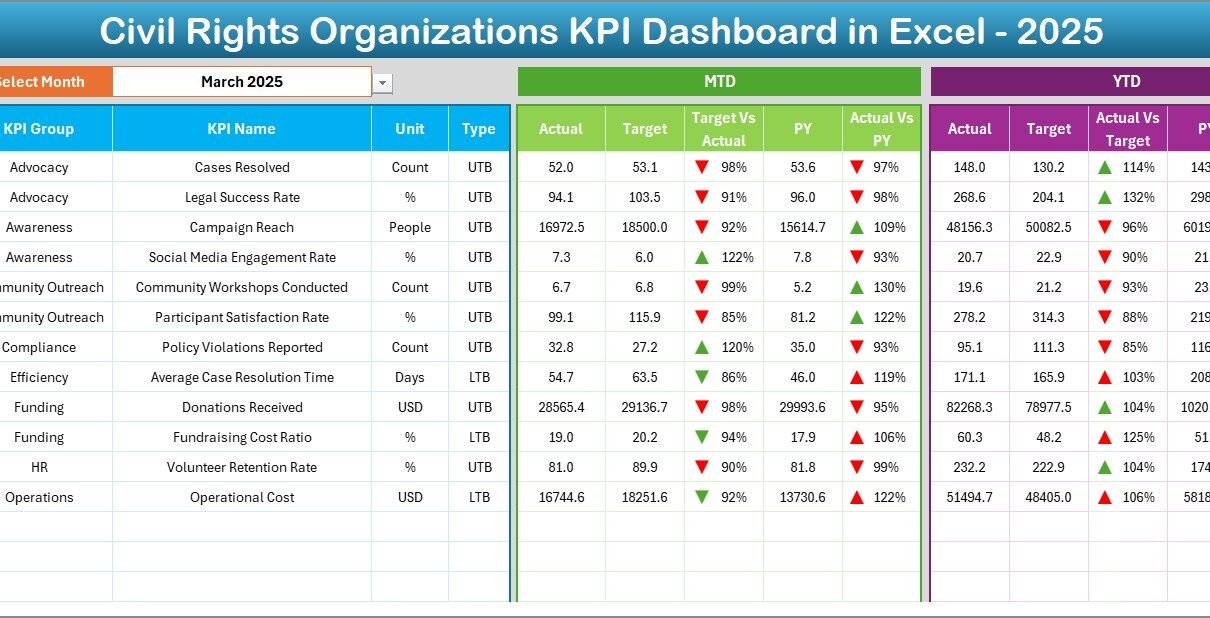
Civil Rights Organizations KPI Dashboard in Excel

February 11, 2026February 11, 2026 PKComments Off on Civil Rights Organizations KPI Dashboard in Excel
Civil rights organizations work every day to protect justice, equality, and human dignity. However, passion alone does not drive impact. Data drives impact. Measurement creates clarity. Accountability builds trust. So,
Read More

Posts pagination

1 2 Next
  • Learn Excel (Free Course)
    • 1. Shortcut Keys
    • 2. Fill & Flash Fill
    • 3. Find & Replace
    • 4. Sort & Filter
    • 5. Formulas & Functions
    • 6. Data Validation
    • 7. Conditional Formatting
    • 8. Basic Charts
    • 9. Advanced Charts
    • 10. Pivot Tables
    • 11. Excel Dashboards
    • 12. VBA Course
    • 13. Excel Formulas with AI
  • Templates
  • Tutorials
    • Charts and Visualization
    • VBA
    • Excel Tips and Tricks
    • Excel Dashboards
    • Power Pivot & DAX
  • Power BI
  • Template Store
    • Ready to Use Templates
  • Courses
  • Academy
    • Excel + AI Mastery: 100 Formulas
    • Excel Pivot Tables & Dashboards
  • About Us
  • Contact Us
Copyright © 2023 PK-AnExcelExpert.com - Privacy Policy