New: NextGenTemplates Academy - video courses on Excel formulas with AI and Pivot Tables & dashboards. Early-bird: 20% off with code EARLYBIRD20 - first 20 orders only. See the courses →
  • Learn Excel (Free Course)
    • 1. Shortcut Keys
    • 2. Fill & Flash Fill
    • 3. Find & Replace
    • 4. Sort & Filter
    • 5. Formulas & Functions
    • 6. Data Validation
    • 7. Conditional Formatting
    • 8. Basic Charts
    • 9. Advanced Charts
    • 10. Pivot Tables
    • 11. Excel Dashboards
    • 12. VBA Course
    • 13. Excel Formulas with AI
  • Templates
  • Tutorials
    • Charts and Visualization
    • VBA
    • Excel Tips and Tricks
    • Excel Dashboards
    • Power Pivot & DAX
  • Power BI
  • Template Store
    • Ready to Use Templates
  • Courses
  • Academy
    • Excel + AI Mastery: 100 Formulas
    • Excel Pivot Tables & Dashboards
  • About Us
  • Contact Us

PK: An Excel Expert

Transforming Data into Decisions

Tag: MTD YTD Dashboard Excel

Dashboard

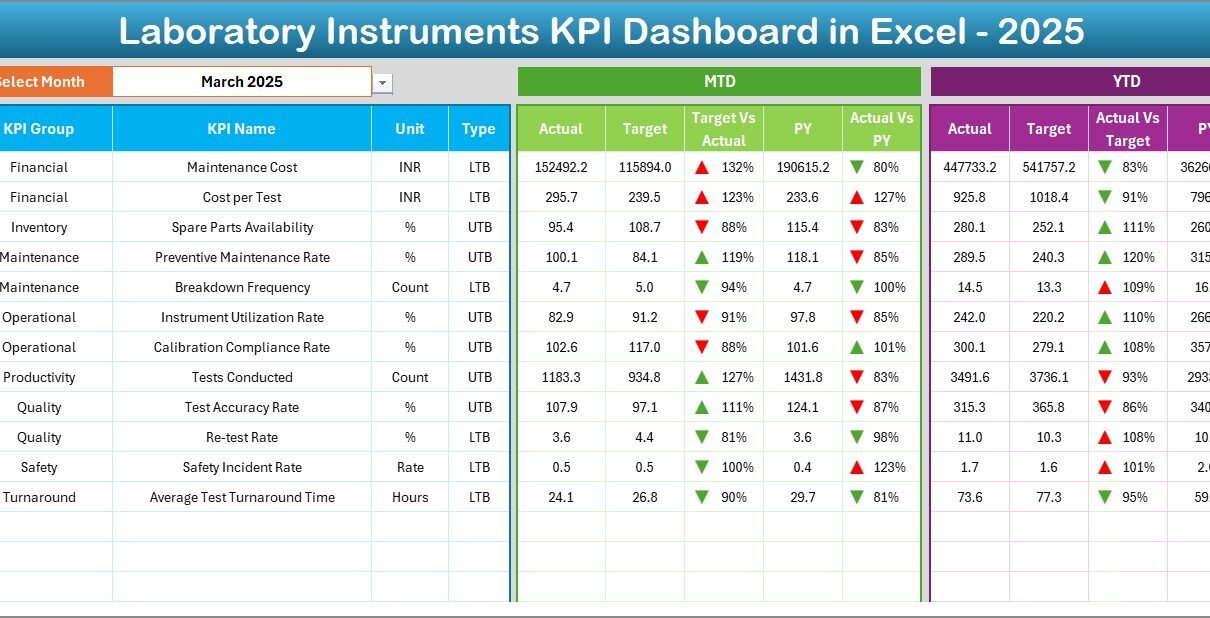
Laboratory Instruments KPI Dashboard in Excel

February 11, 2026February 11, 2026 PKComments Off on Laboratory Instruments KPI Dashboard in Excel
Laboratories run on accuracy, speed, and compliance. However, many labs still track instrument performance using scattered Excel files. As a result, managers struggle to monitor calibration schedules, downtime, utilization rates,
Read More
Dashboard

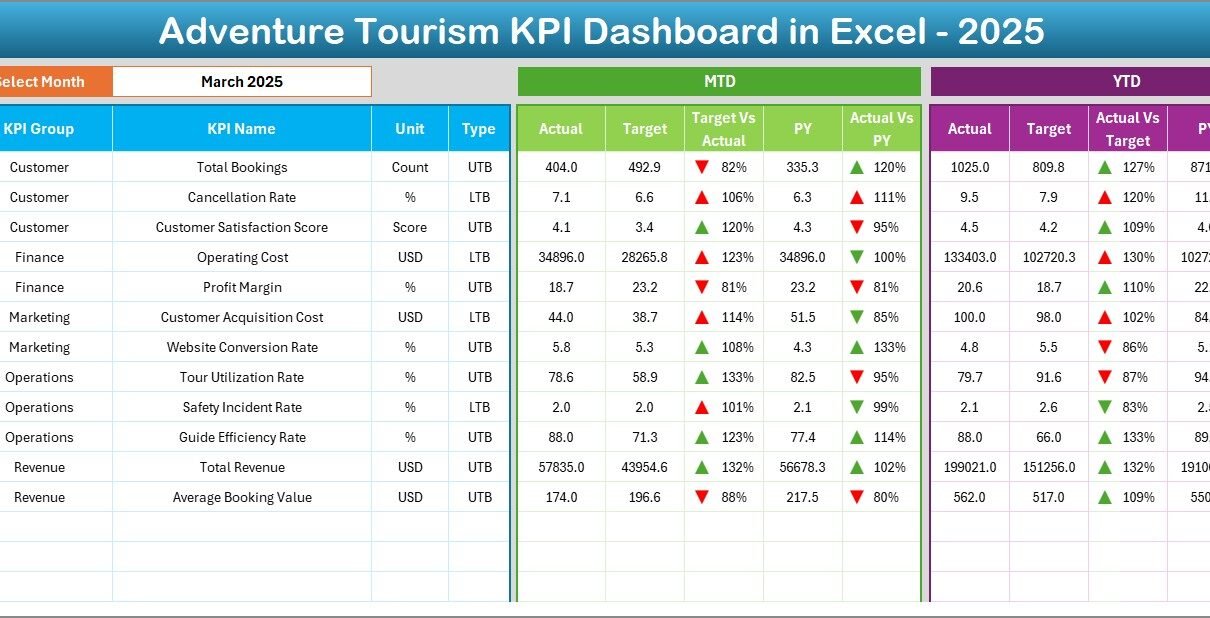
Adventure Tourism KPI Dashboard in Excel

February 6, 2026February 6, 2026 PKComments Off on Adventure Tourism KPI Dashboard in Excel
Adventure tourism continues to grow rapidly. Travelers now seek thrilling experiences like trekking, rafting, scuba diving, desert safaris, and mountain biking. However, running an adventure tourism business requires strong planning,
Read More
Dashboard

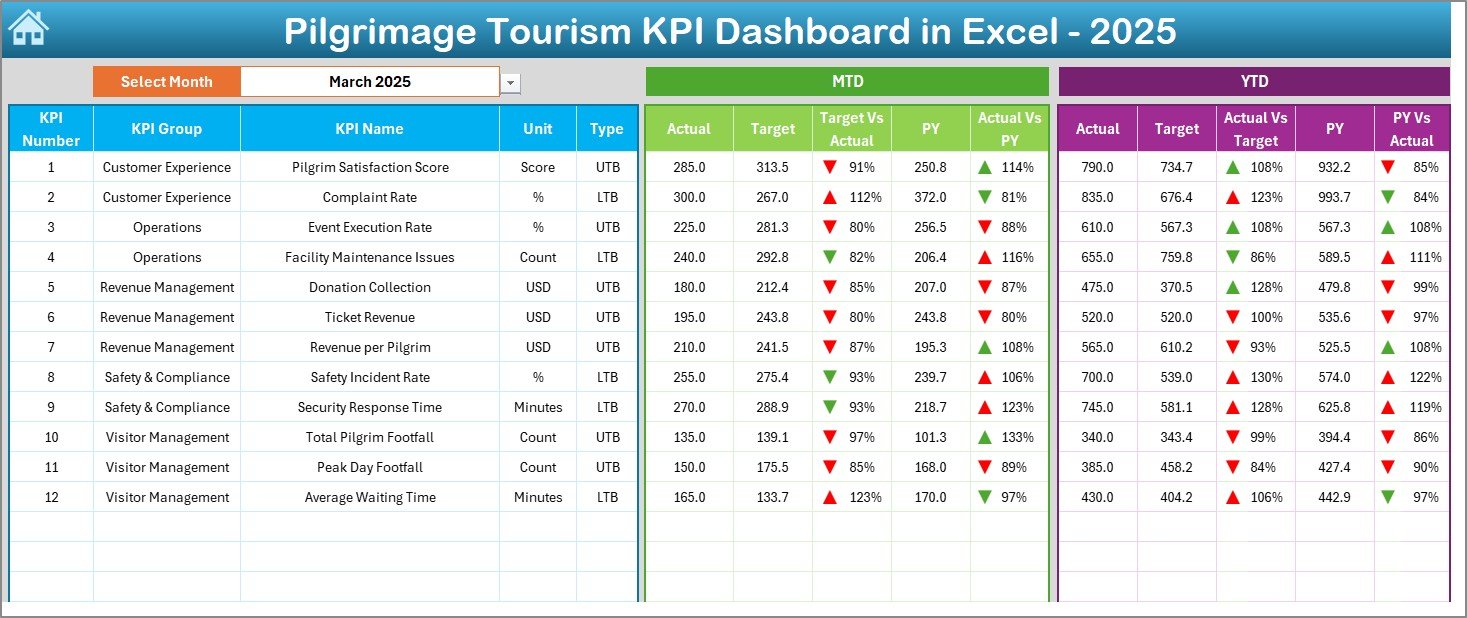
Pilgrimage Tourism KPI Dashboard in Excel

February 6, 2026October 10, 2026 PKComments Off on Pilgrimage Tourism KPI Dashboard in Excel
Pilgrimage tourism continues to grow across the world. Millions of visitors travel every year to sacred destinations like Mecca, Vatican City, Varanasi, and Tirupati Balaji Temple. As a result, pilgrimage
Read More
Dashboard

Power Distribution KPI Dashboard in Excel

December 13, 2025December 13, 2025 PKComments Off on Power Distribution KPI Dashboard in Excel
In today’s fast-changing energy and utility environment, power distribution companies must track performance continuously. However, when data sits across multiple spreadsheets, reports, and systems, decision-making becomes slow and inefficient. Therefore,
Read More
Dashboard

Smart Cities Development KPI Dashboard in Excel

December 12, 2025December 12, 2025 PKComments Off on Smart Cities Development KPI Dashboard in Excel
The Smart Cities Development KPI Dashboard in Excel is a powerful, ready-to-use analytics template designed to help city planners, government agencies, and urban development teams monitor key performance metrics with
Read More

Posts pagination

Previous 1 2
  • Learn Excel (Free Course)
    • 1. Shortcut Keys
    • 2. Fill & Flash Fill
    • 3. Find & Replace
    • 4. Sort & Filter
    • 5. Formulas & Functions
    • 6. Data Validation
    • 7. Conditional Formatting
    • 8. Basic Charts
    • 9. Advanced Charts
    • 10. Pivot Tables
    • 11. Excel Dashboards
    • 12. VBA Course
    • 13. Excel Formulas with AI
  • Templates
  • Tutorials
    • Charts and Visualization
    • VBA
    • Excel Tips and Tricks
    • Excel Dashboards
    • Power Pivot & DAX
  • Power BI
  • Template Store
    • Ready to Use Templates
  • Courses
  • Academy
    • Excel + AI Mastery: 100 Formulas
    • Excel Pivot Tables & Dashboards
  • About Us
  • Contact Us
Copyright © 2023 PK-AnExcelExpert.com - Privacy Policy