New: NextGenTemplates Academy - video courses on Excel formulas with AI and Pivot Tables & dashboards. Early-bird: 20% off with code EARLYBIRD20 - first 20 orders only. See the courses →
  • Learn Excel (Free Course)
    • 1. Shortcut Keys
    • 2. Fill & Flash Fill
    • 3. Find & Replace
    • 4. Sort & Filter
    • 5. Formulas & Functions
    • 6. Data Validation
    • 7. Conditional Formatting
    • 8. Basic Charts
    • 9. Advanced Charts
    • 10. Pivot Tables
    • 11. Excel Dashboards
    • 12. VBA Course
    • 13. Excel Formulas with AI
  • Templates
  • Tutorials
    • Charts and Visualization
    • VBA
    • Excel Tips and Tricks
    • Excel Dashboards
    • Power Pivot & DAX
  • Power BI
  • Template Store
    • Ready to Use Templates
  • Courses
  • Academy
    • Excel + AI Mastery: 100 Formulas
    • Excel Pivot Tables & Dashboards
  • About Us
  • Contact Us

PK: An Excel Expert

Transforming Data into Decisions

Tag: MTD YTD dashboard

Dashboard Power BI

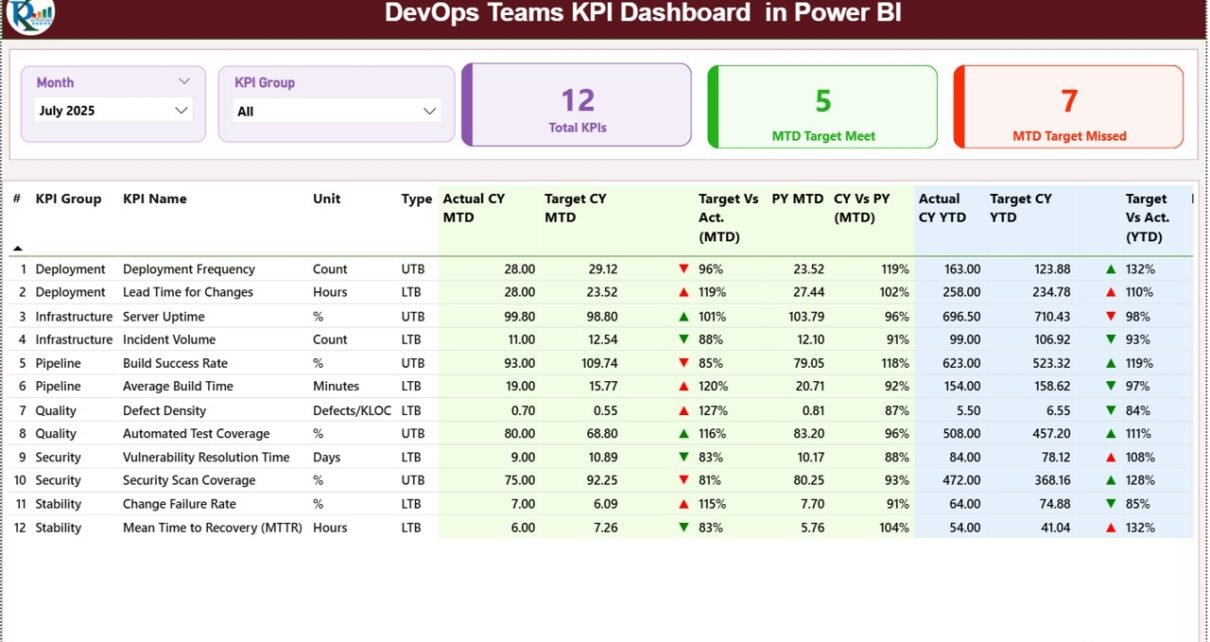
DevOps Teams KPI Dashboard in Power BI

February 16, 2026February 16, 2026 PKComments Off on DevOps Teams KPI Dashboard in Power BI
DevOps teams move fast. They deploy code daily, fix issues instantly, and automate processes continuously. However, without structured measurement, speed can hide problems. Therefore, every DevOps team needs a powerful
Read More
Dashboard

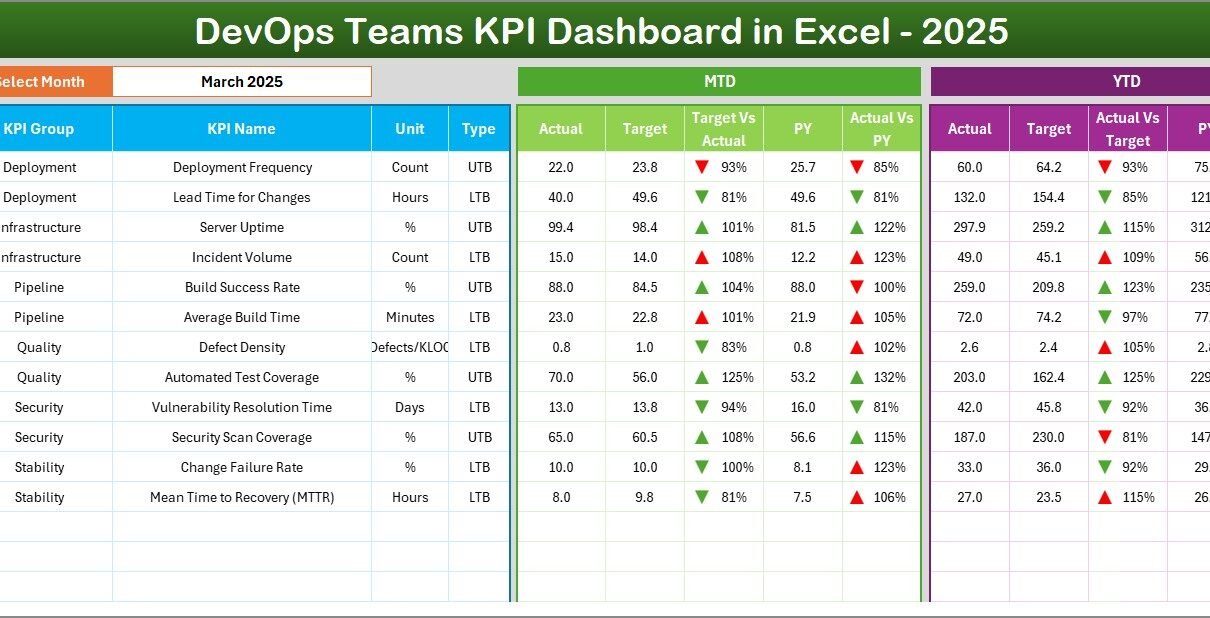
DevOps Teams KPI Dashboard in Excel

February 16, 2026February 16, 2026 PKComments Off on DevOps Teams KPI Dashboard in Excel
In today’s fast-moving tech world, DevOps teams cannot rely on guesswork. They must track deployment speed, system stability, defect trends, and operational efficiency in real time. However, many teams still
Read More
Dashboard

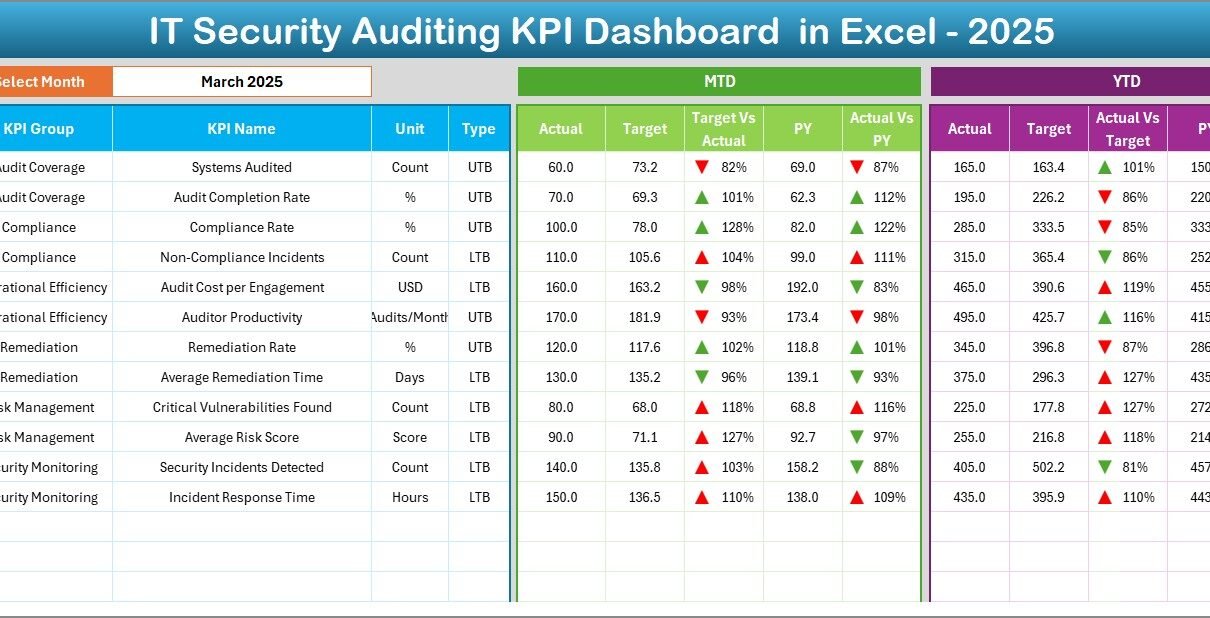
IT Security Auditing KPI Dashboard in Excel

February 15, 2026February 15, 2026 PKComments Off on IT Security Auditing KPI Dashboard in Excel
Cyber threats grow every day. Meanwhile, regulations become stricter. At the same time, organizations face constant pressure to protect sensitive data. So, how do you measure whether your IT security
Read More
Dashboard Power BI

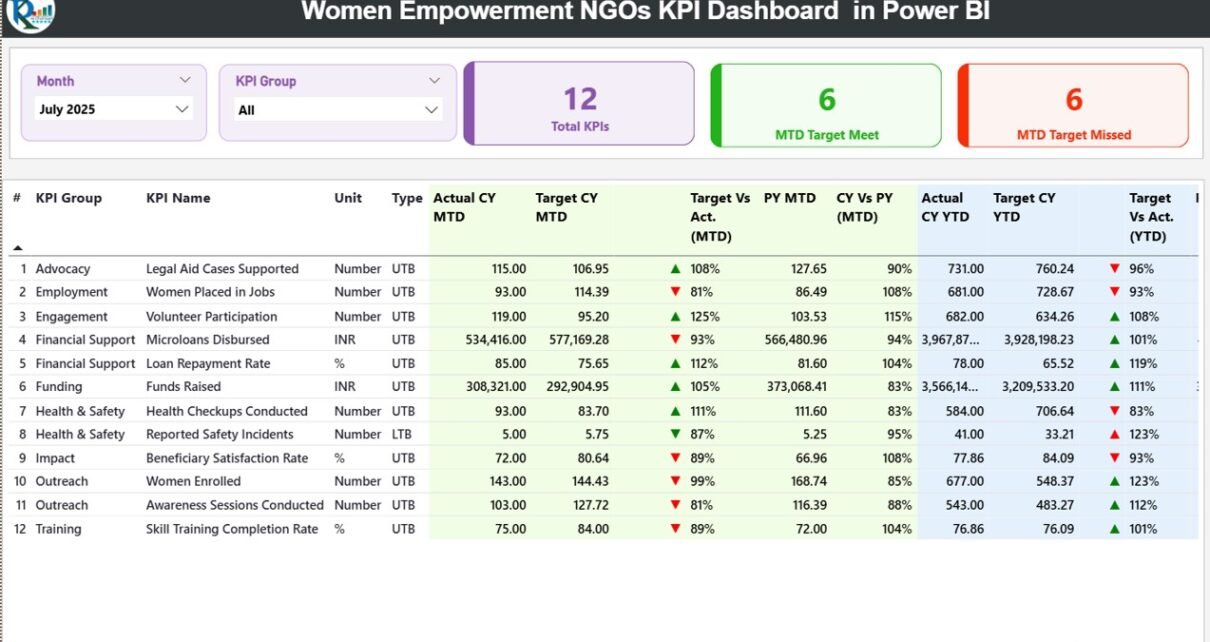
Women Empowerment NGOs KPI Dashboard in Power BI

February 13, 2026February 13, 2026 PKComments Off on Women Empowerment NGOs KPI Dashboard in Power BI
Women empowerment NGOs work tirelessly to create opportunities, protect rights, and build stronger communities. They train women, support education, promote entrepreneurship, and improve healthcare access. However, while the mission drives
Read More
Dashboard

Postal Services KPI Dashboard in Excel

February 13, 2026February 13, 2026 PKComments Off on Postal Services KPI Dashboard in Excel
Postal services connect businesses, governments, and citizens every single day. However, managing thousands of deliveries, parcels, customer complaints, and operational targets requires strong performance tracking. Without a structured system, managers
Read More
Dashboard

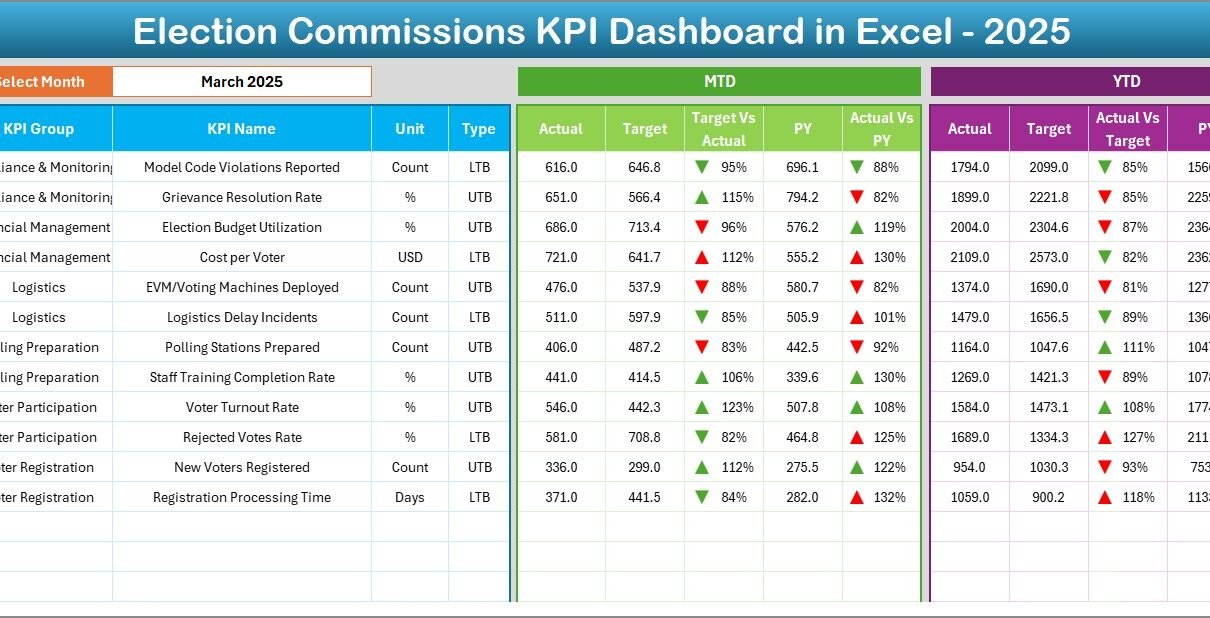
Election Commissions KPI Dashboard in Excel

February 13, 2026February 13, 2026 PKComments Off on Election Commissions KPI Dashboard in Excel
Election management demands accuracy, transparency, and real-time monitoring. However, many election offices still rely on scattered sheets and manual reports. As a result, leaders struggle to track voter turnout, polling
Read More
Dashboard

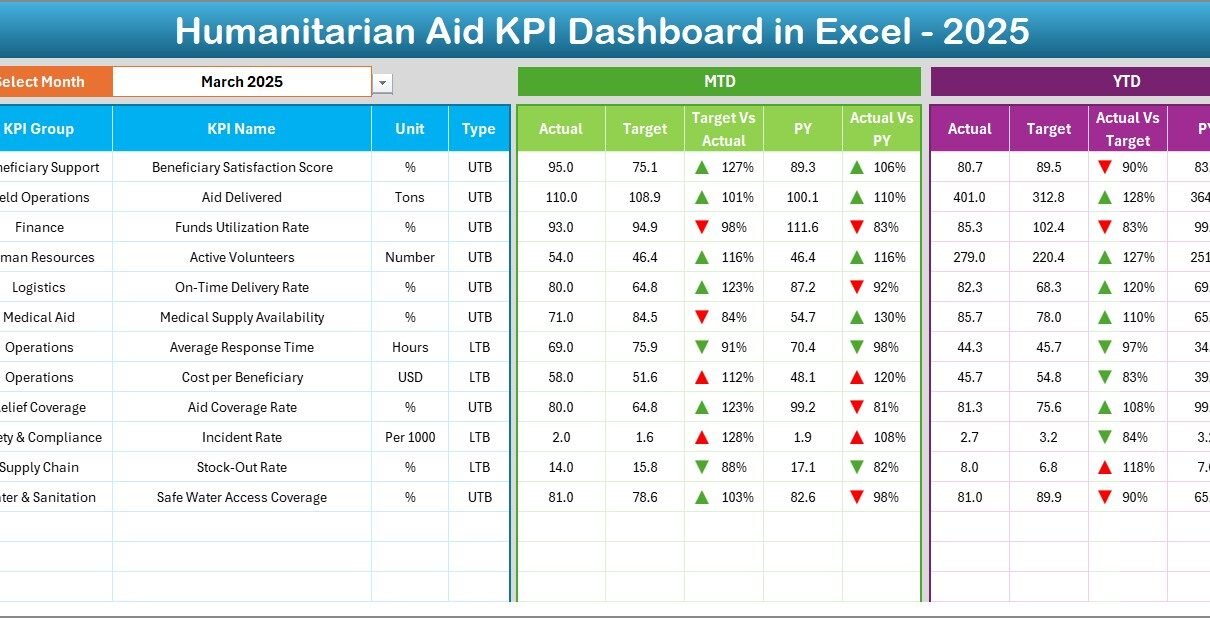
Humanitarian Aid KPI Dashboard in Excel

February 12, 2026February 12, 2026 PKComments Off on Humanitarian Aid KPI Dashboard in Excel
Humanitarian organizations operate in complex and high-pressure environments. They deliver food, medical support, shelter, education, and emergency relief across regions. However, without proper tracking, leaders struggle to measure impact clearly.
Read More
Dashboard

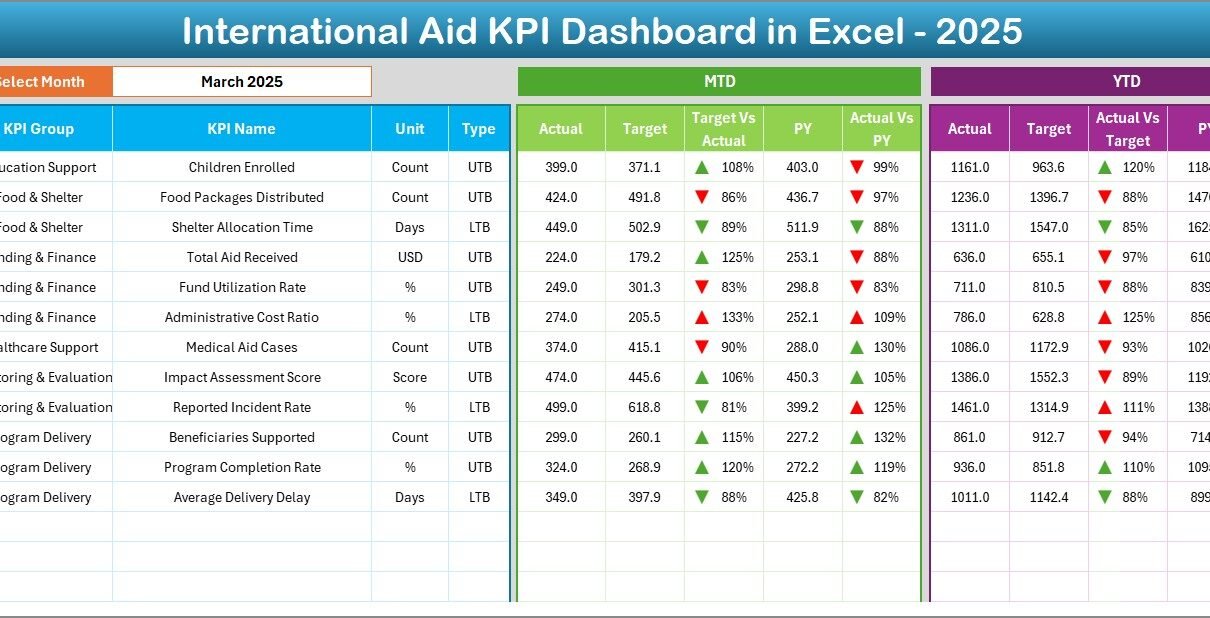
International Aid KPI Dashboard in Excel

February 12, 2026February 12, 2026 PKComments Off on International Aid KPI Dashboard in Excel
International aid organizations handle complex projects. They manage funds, monitor field activities, track beneficiaries, and report impact to donors. However, many teams still use scattered spreadsheets. As a result, leaders
Read More
Dashboard

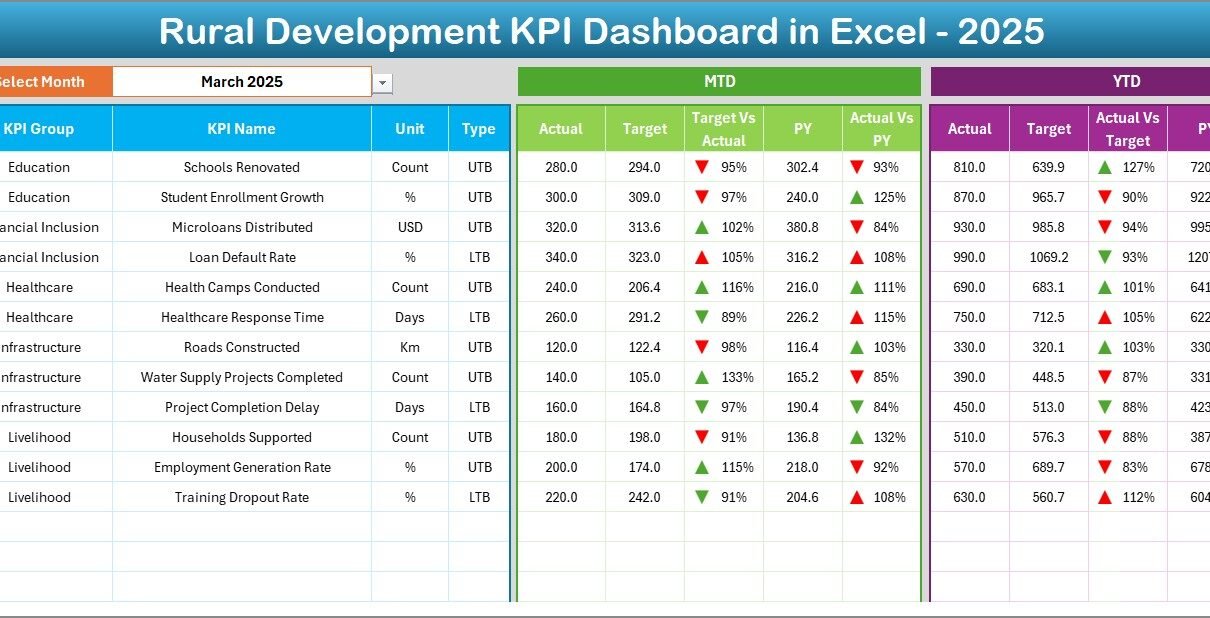
Rural Development KPI Dashboard in Excel

February 12, 2026February 12, 2026 PKComments Off on Rural Development KPI Dashboard in Excel
Rural development drives economic growth, improves livelihoods, and strengthens communities. However, many development teams still track progress in scattered spreadsheets. As a result, leaders struggle to monitor targets, compare yearly
Read More
Dashboard Power BI

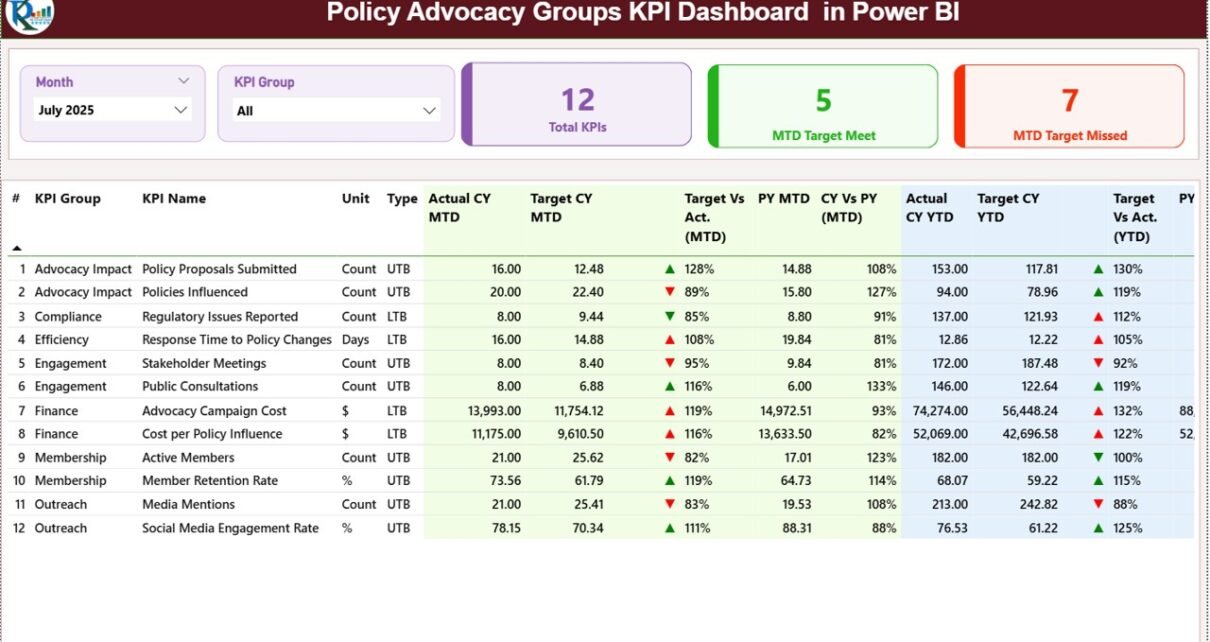
Policy Advocacy Groups KPI Dashboard in Power BI

February 11, 2026February 11, 2026 PKComments Off on Policy Advocacy Groups KPI Dashboard in Power BI
Policy advocacy groups work to create change. They run campaigns, influence decision-makers, mobilize communities, and track outcomes. However, many organizations still rely on manual Excel summaries or scattered reports. As
Read More

Posts pagination

Previous 1 2 3 … 8 Next
  • Learn Excel (Free Course)
    • 1. Shortcut Keys
    • 2. Fill & Flash Fill
    • 3. Find & Replace
    • 4. Sort & Filter
    • 5. Formulas & Functions
    • 6. Data Validation
    • 7. Conditional Formatting
    • 8. Basic Charts
    • 9. Advanced Charts
    • 10. Pivot Tables
    • 11. Excel Dashboards
    • 12. VBA Course
    • 13. Excel Formulas with AI
  • Templates
  • Tutorials
    • Charts and Visualization
    • VBA
    • Excel Tips and Tricks
    • Excel Dashboards
    • Power Pivot & DAX
  • Power BI
  • Template Store
    • Ready to Use Templates
  • Courses
  • Academy
    • Excel + AI Mastery: 100 Formulas
    • Excel Pivot Tables & Dashboards
  • About Us
  • Contact Us
Copyright © 2023 PK-AnExcelExpert.com - Privacy Policy