New: NextGenTemplates Academy - video courses on Excel formulas with AI and Pivot Tables & dashboards. Early-bird: 20% off with code EARLYBIRD20 - first 20 orders only. See the courses →
  • Learn Excel (Free Course)
    • 1. Shortcut Keys
    • 2. Fill & Flash Fill
    • 3. Find & Replace
    • 4. Sort & Filter
    • 5. Formulas & Functions
    • 6. Data Validation
    • 7. Conditional Formatting
    • 8. Basic Charts
    • 9. Advanced Charts
    • 10. Pivot Tables
    • 11. Excel Dashboards
    • 12. VBA Course
    • 13. Excel Formulas with AI
  • Templates
  • Tutorials
    • Charts and Visualization
    • VBA
    • Excel Tips and Tricks
    • Excel Dashboards
    • Power Pivot & DAX
  • Power BI
  • Template Store
    • Ready to Use Templates
  • Courses
  • Academy
    • Excel + AI Mastery: 100 Formulas
    • Excel Pivot Tables & Dashboards
  • About Us
  • Contact Us

PK: An Excel Expert

Transforming Data into Decisions

Tag: MTD YTD dashboard

Dashboard

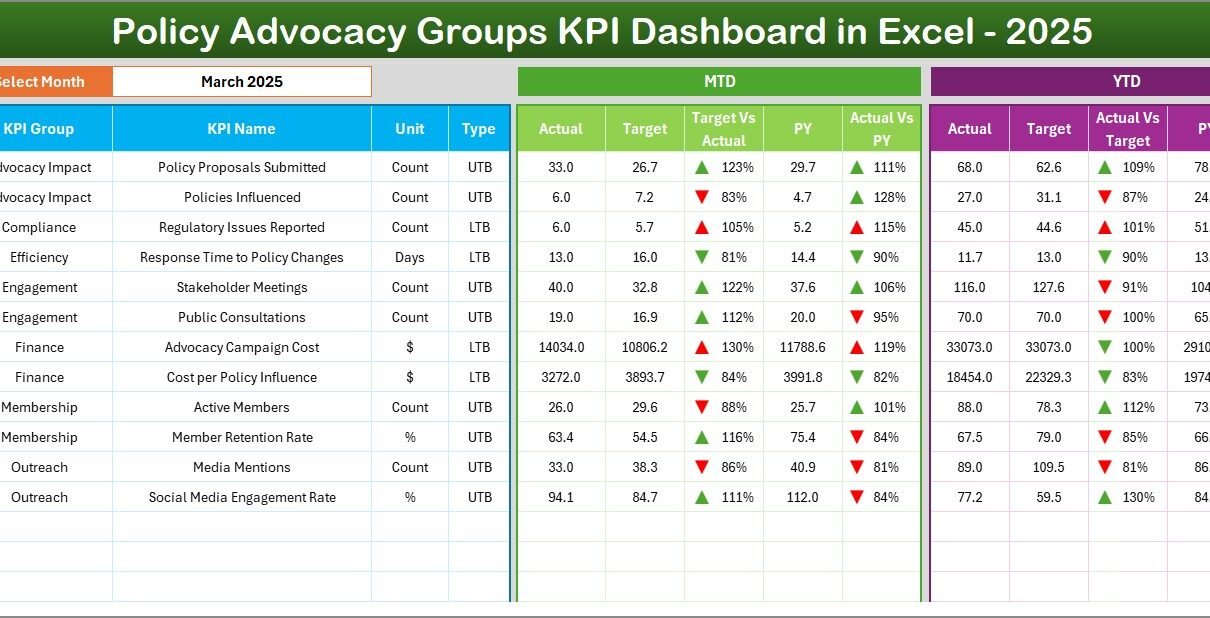
Policy Advocacy Groups KPI Dashboard in Excel

February 11, 2026February 11, 2026 PKComments Off on Policy Advocacy Groups KPI Dashboard in Excel
Policy advocacy groups work hard to influence change. They organize campaigns, engage stakeholders, conduct research, and mobilize communities. However, many organizations still track performance using scattered spreadsheets. As a result,
Read More
Dashboard Power BI

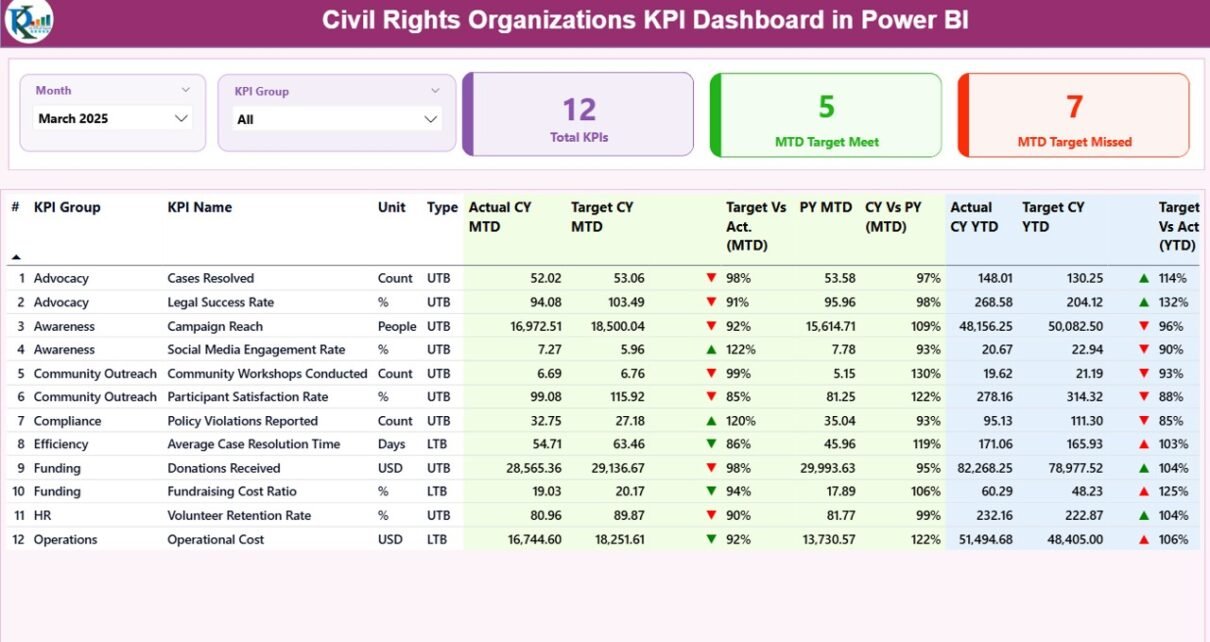
Civil Rights Organizations KPI Dashboard in Power BI

February 11, 2026February 11, 2026 PKComments Off on Civil Rights Organizations KPI Dashboard in Power BI
Civil rights organizations fight for justice, equality, and human dignity every single day. However, passion alone does not create measurable impact. Data creates impact. Clear reporting builds trust. Strong monitoring
Read More
Dashboard Power BI

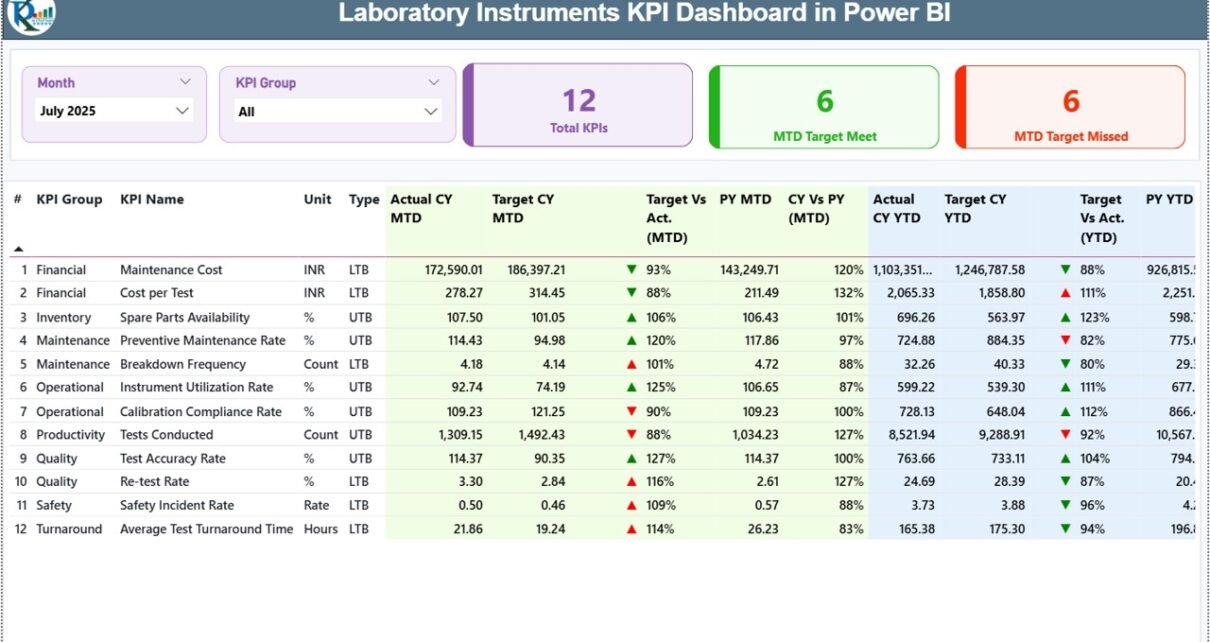
Laboratory Instruments KPI Dashboard in Power BI

February 11, 2026February 11, 2026 PKComments Off on Laboratory Instruments KPI Dashboard in Power BI
Laboratories depend on precision, speed, and compliance. However, many labs still track instrument performance manually. As a result, teams spend hours compiling reports. Moreover, managers struggle to monitor downtime, utilization
Read More
Dashboard Power BI

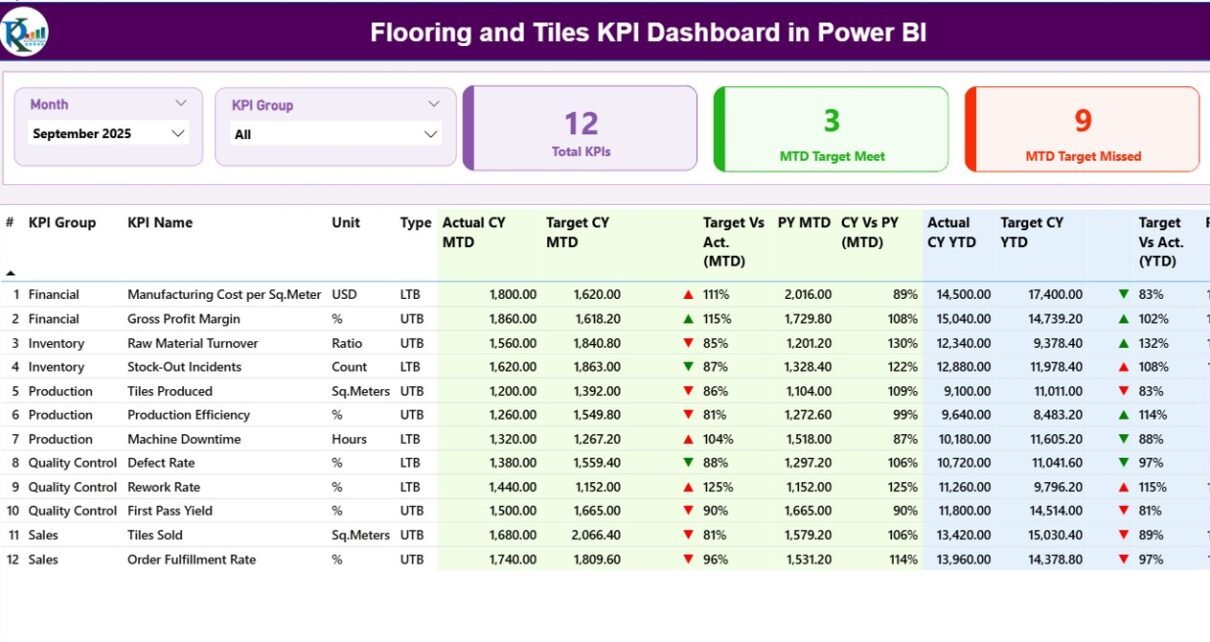
Flooring and Tiles KPI Dashboard in Power BI

February 9, 2026February 9, 2026 PKComments Off on Flooring and Tiles KPI Dashboard in Power BI
The Flooring and Tiles KPI Dashboard changes fast. Customer taste shifts quickly. Moreover, builders demand faster delivery. At the same time, raw material costs move up and down. Therefore, flooring
Read More
Dashboard Power BI

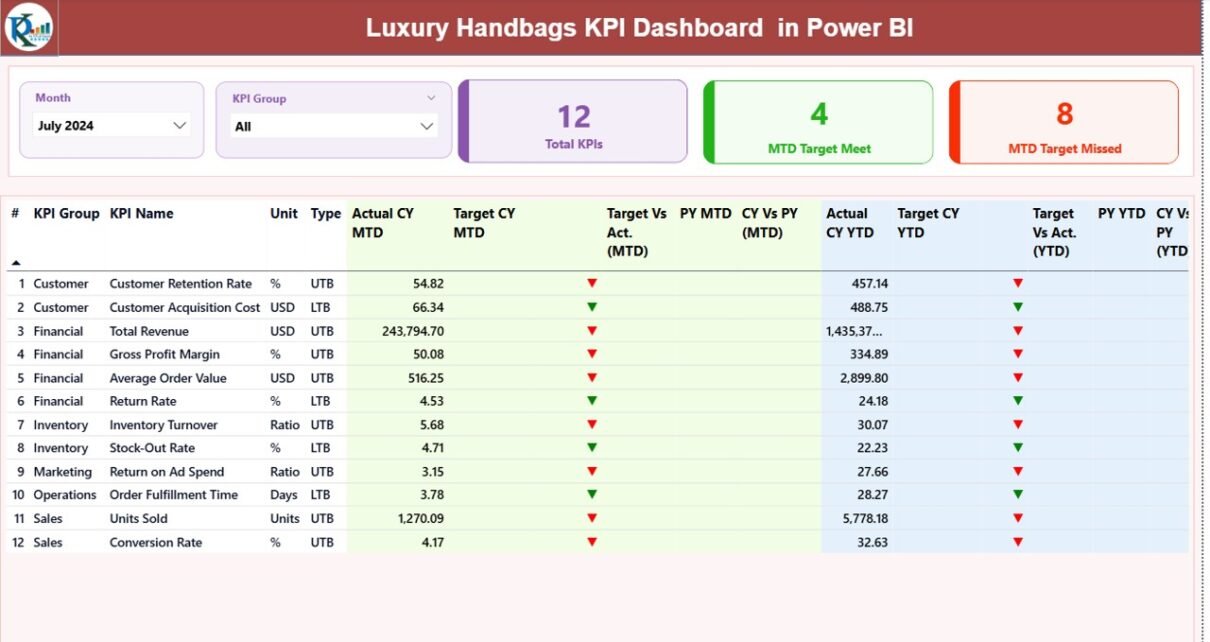
Luxury Handbags KPI Dashboard in Power BI

February 9, 2026February 9, 2026 PKComments Off on Luxury Handbags KPI Dashboard in Power BI
The luxury handbag industry moves fast. Trends change quickly. Customer taste shifts with seasons. Moreover, global fashion weeks, celebrity endorsements, and festive campaigns directly impact sales. Therefore, luxury handbag brands
Read More
Dashboard

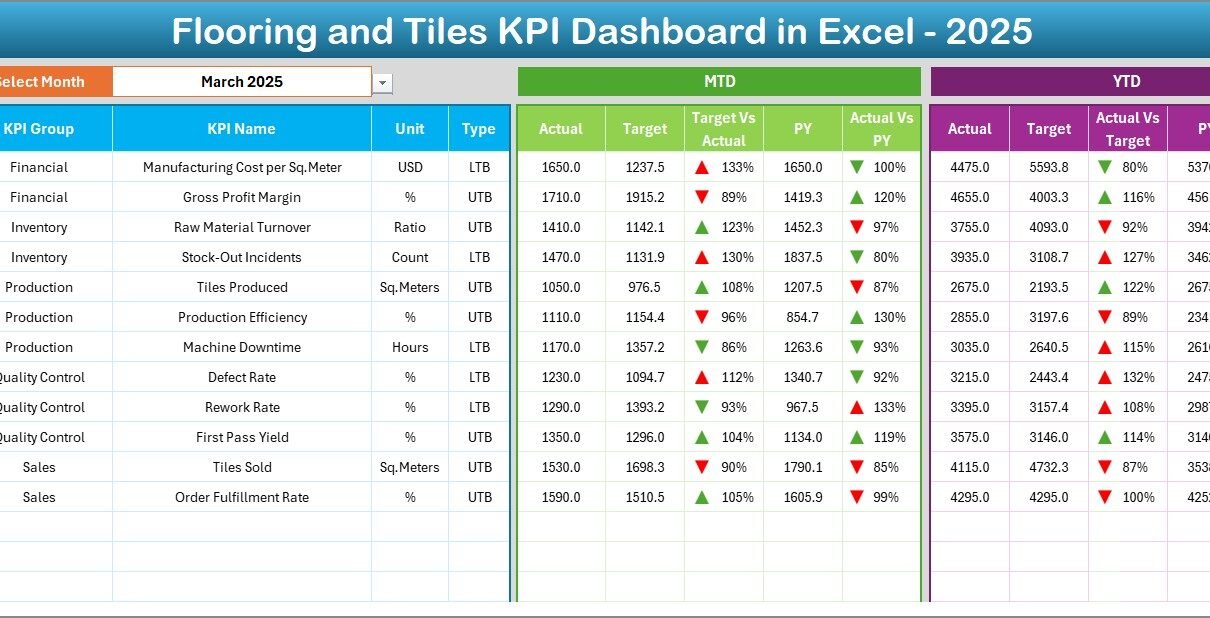
Flooring and Tiles KPI Dashboard in Excel

February 9, 2026February 9, 2026 PKComments Off on Flooring and Tiles KPI Dashboard in Excel
The flooring and tiles industry moves fast. Customer taste changes quickly. Moreover, builders demand faster delivery. At the same time, raw material prices rise and fall. Therefore, business owners must
Read More
Templates

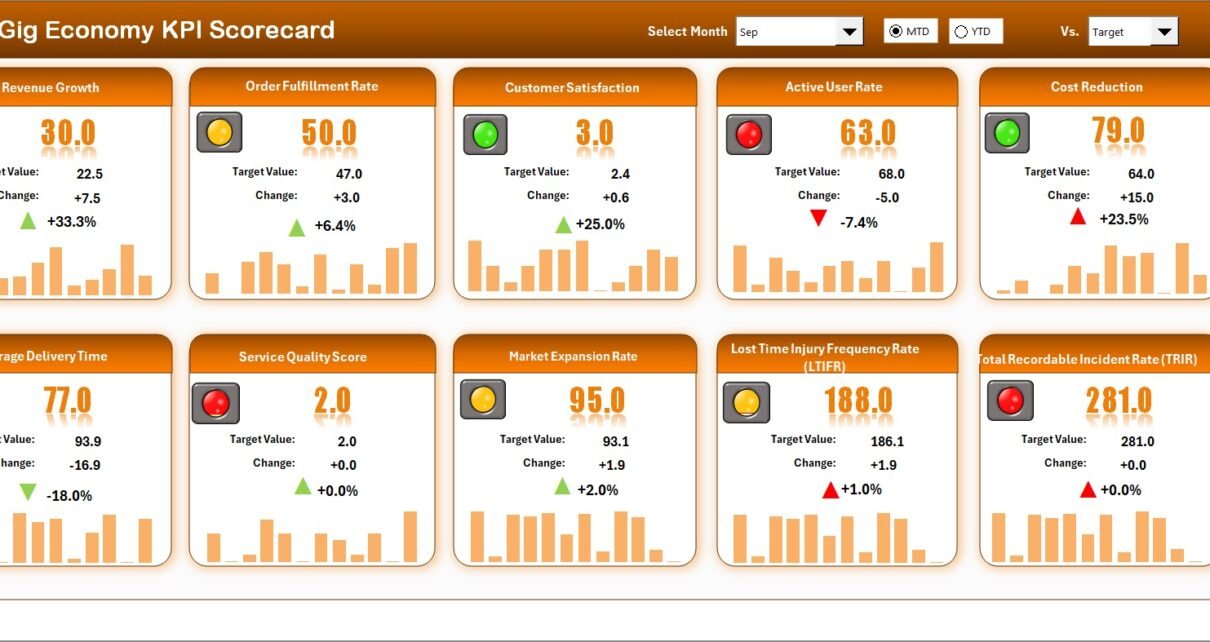
Gig Economy KPI Scorecard in Excel

February 9, 2026February 9, 2026 PKComments Off on Gig Economy KPI Scorecard in Excel
The gig economy continues to grow rapidly. Millions of freelancers, delivery partners, ride-share drivers, digital creators, and independent contractors now earn through flexible work models. However, flexibility alone does not
Read More
Dashboard

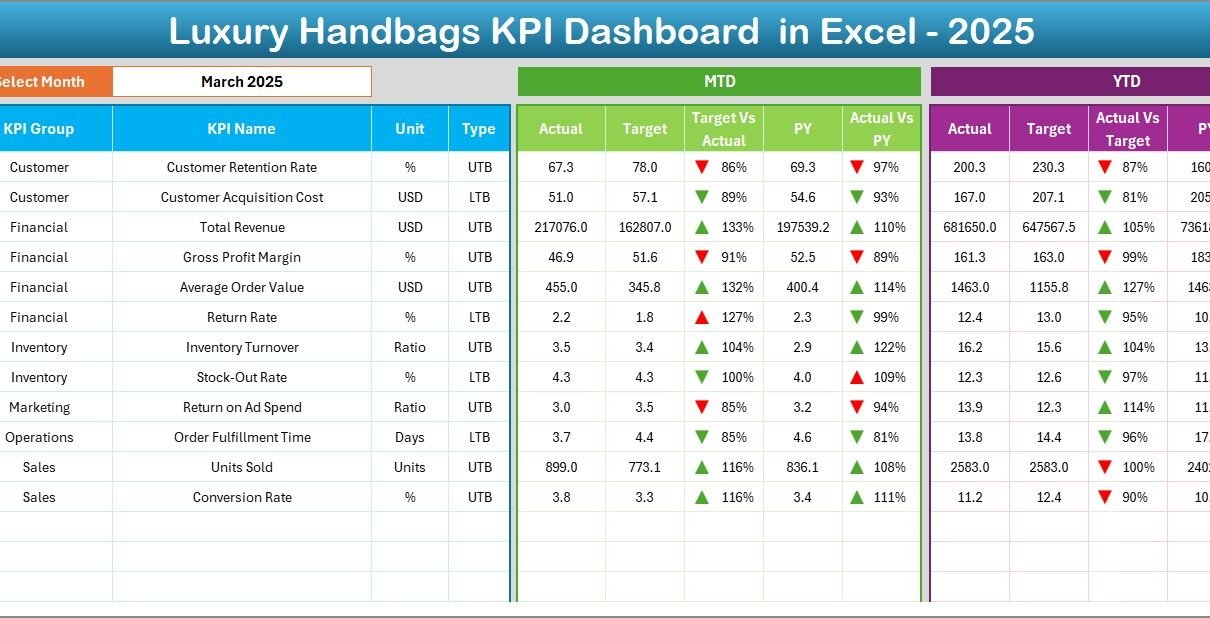
Luxury Handbags KPI Dashboard in Excel

February 9, 2026February 9, 2026 PKComments Off on Luxury Handbags KPI Dashboard in Excel
The luxury handbags industry moves with elegance. However, behind every premium brand, strong numbers drive real growth. Trends shift quickly. Customer preferences change with seasons. Influencers impact demand overnight. Moreover,
Read More
Dashboard

Firearms Manufacturing KPI Dashboard in Excel

February 8, 2026February 8, 2026 PKComments Off on Firearms Manufacturing KPI Dashboard in Excel
Manufacturing demands precision. Firearms manufacturing demands even more precision. Production must meet strict quality standards. Compliance rules must remain tight. Safety checks must stay consistent. Therefore, manufacturers must track performance
Read More
Dashboard Power BI

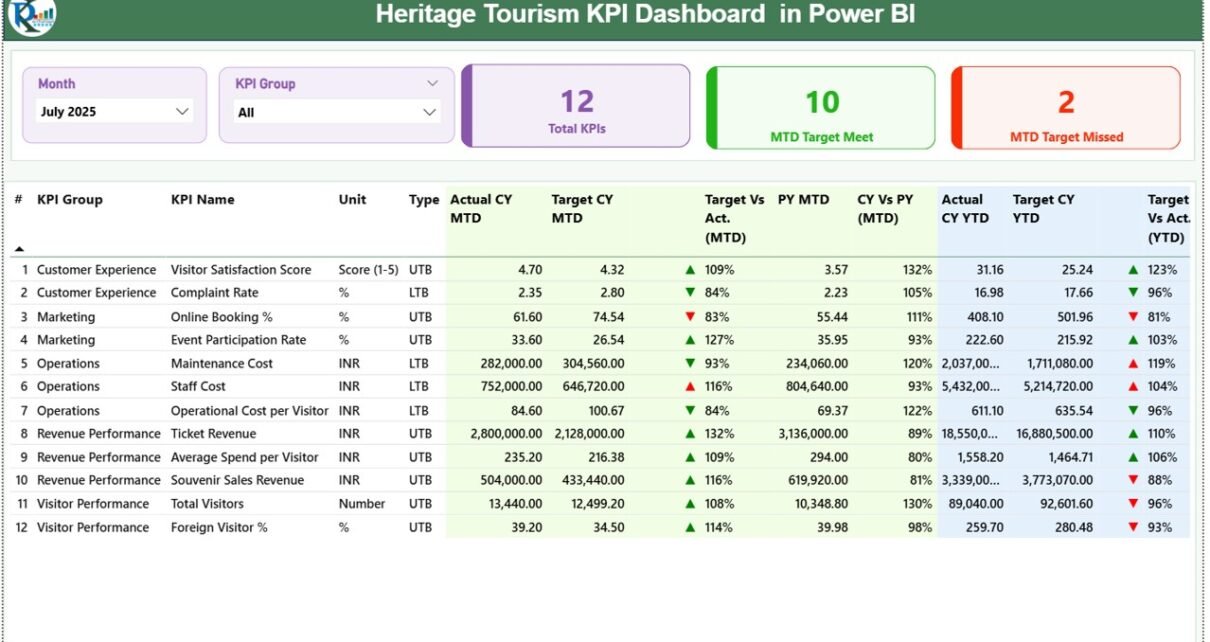
Heritage Tourism KPI Dashboard in Power BI

February 8, 2026February 8, 2026 PKComments Off on Heritage Tourism KPI Dashboard in Power BI
Heritage tourism plays a powerful role in protecting culture, generating employment, and strengthening local economies. Historical monuments attract visitors daily. Cultural events increase seasonal revenue. Government funding supports conservation projects.
Read More

Posts pagination

Previous 1 2 3 4 … 8 Next
  • Learn Excel (Free Course)
    • 1. Shortcut Keys
    • 2. Fill & Flash Fill
    • 3. Find & Replace
    • 4. Sort & Filter
    • 5. Formulas & Functions
    • 6. Data Validation
    • 7. Conditional Formatting
    • 8. Basic Charts
    • 9. Advanced Charts
    • 10. Pivot Tables
    • 11. Excel Dashboards
    • 12. VBA Course
    • 13. Excel Formulas with AI
  • Templates
  • Tutorials
    • Charts and Visualization
    • VBA
    • Excel Tips and Tricks
    • Excel Dashboards
    • Power Pivot & DAX
  • Power BI
  • Template Store
    • Ready to Use Templates
  • Courses
  • Academy
    • Excel + AI Mastery: 100 Formulas
    • Excel Pivot Tables & Dashboards
  • About Us
  • Contact Us
Copyright © 2023 PK-AnExcelExpert.com - Privacy Policy