New: NextGenTemplates Academy - video courses on Excel formulas with AI and Pivot Tables & dashboards. Early-bird: 20% off with code EARLYBIRD20 - first 20 orders only. See the courses →
  • Learn Excel (Free Course)
    • 1. Shortcut Keys
    • 2. Fill & Flash Fill
    • 3. Find & Replace
    • 4. Sort & Filter
    • 5. Formulas & Functions
    • 6. Data Validation
    • 7. Conditional Formatting
    • 8. Basic Charts
    • 9. Advanced Charts
    • 10. Pivot Tables
    • 11. Excel Dashboards
    • 12. VBA Course
    • 13. Excel Formulas with AI
  • Templates
  • Tutorials
    • Charts and Visualization
    • VBA
    • Excel Tips and Tricks
    • Excel Dashboards
    • Power Pivot & DAX
  • Power BI
  • Template Store
    • Ready to Use Templates
  • Courses
  • Academy
    • Excel + AI Mastery: 100 Formulas
    • Excel Pivot Tables & Dashboards
  • About Us
  • Contact Us

PK: An Excel Expert

Transforming Data into Decisions

Tag: MTD YTD dashboard

Dashboard

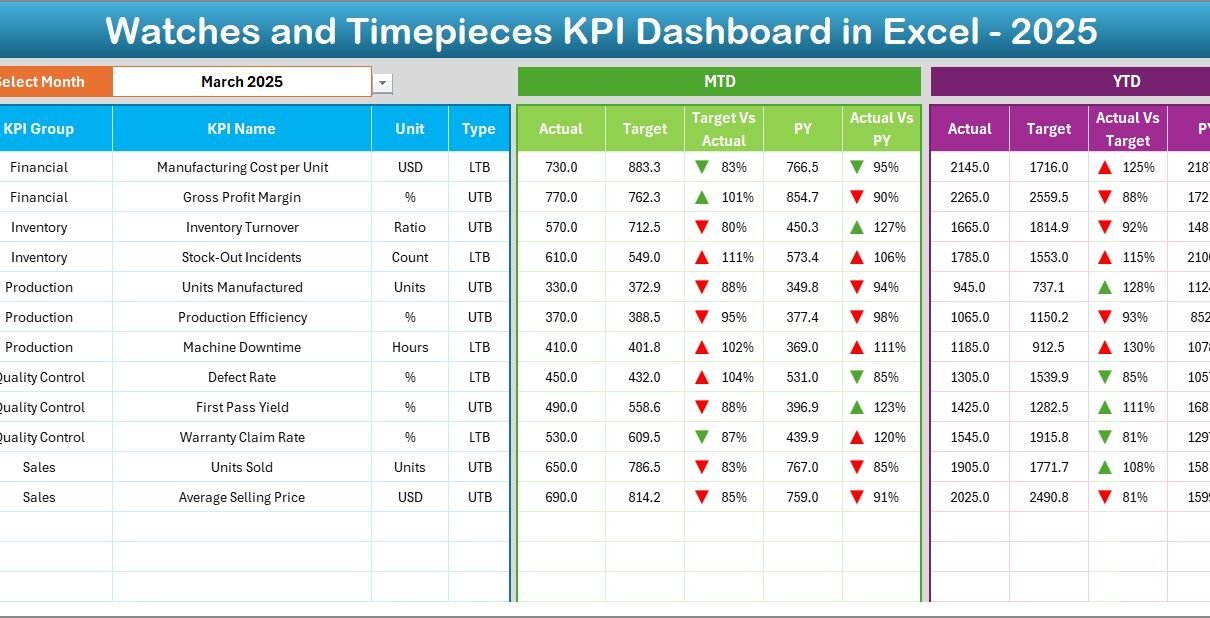
Watches and Timepieces KPI Dashboard in Excel

February 8, 2026February 8, 2026 PKComments Off on Watches and Timepieces KPI Dashboard in Excel
The watches and timepieces industry moves with precision. Trends change fast. Luxury demand rises during festive seasons. Smartwatch sales grow with technology launches. Meanwhile, inventory costs increase if you fail
Read More
Dashboard

Sporting Goods KPI Dashboard in Excel

February 8, 2026February 8, 2026 PKComments Off on Sporting Goods KPI Dashboard in Excel
The sporting goods industry moves fast. Trends change quickly. Customer demand shifts with seasons. Moreover, sales fluctuate during tournaments, holidays, and fitness campaigns. Therefore, sporting goods retailers, wholesalers, and manufacturers
Read More
Dashboard Power BI

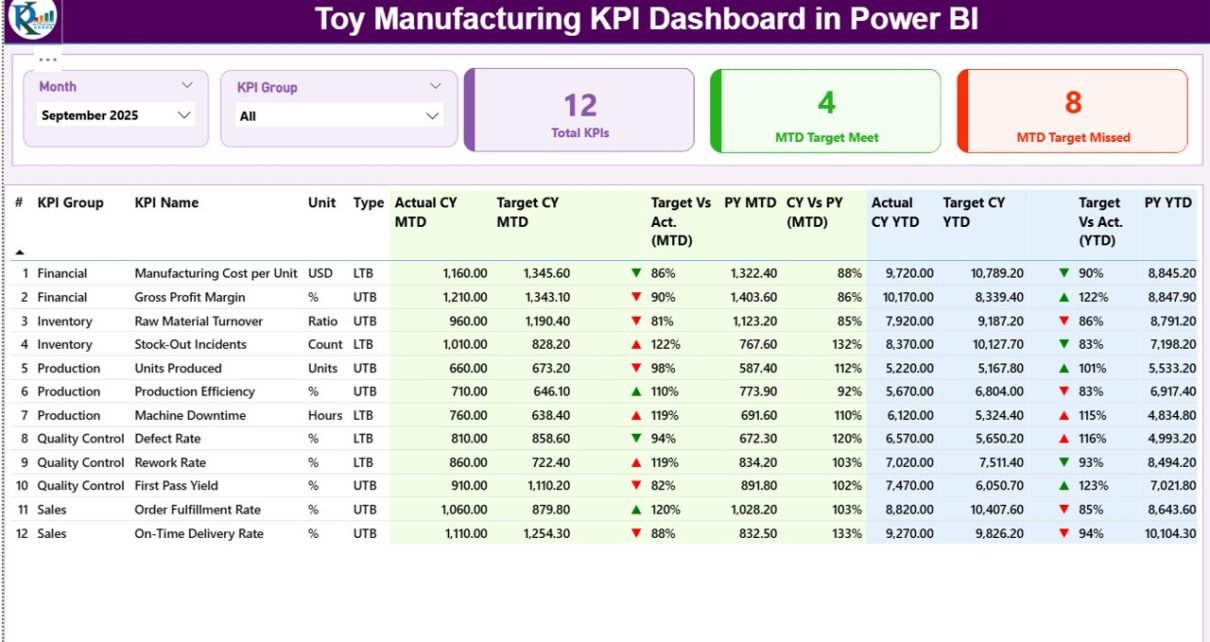
Toy Manufacturing KPI Dashboard in Power BI

February 7, 2026February 7, 2026 PKComments Off on Toy Manufacturing KPI Dashboard in Power BI
The toy industry moves fast. Trends change quickly. Seasonal demand rises sharply. Retail pressure increases daily. Therefore, toy manufacturers must track production, quality, sales, and delivery metrics in real time.
Read More
Dashboard

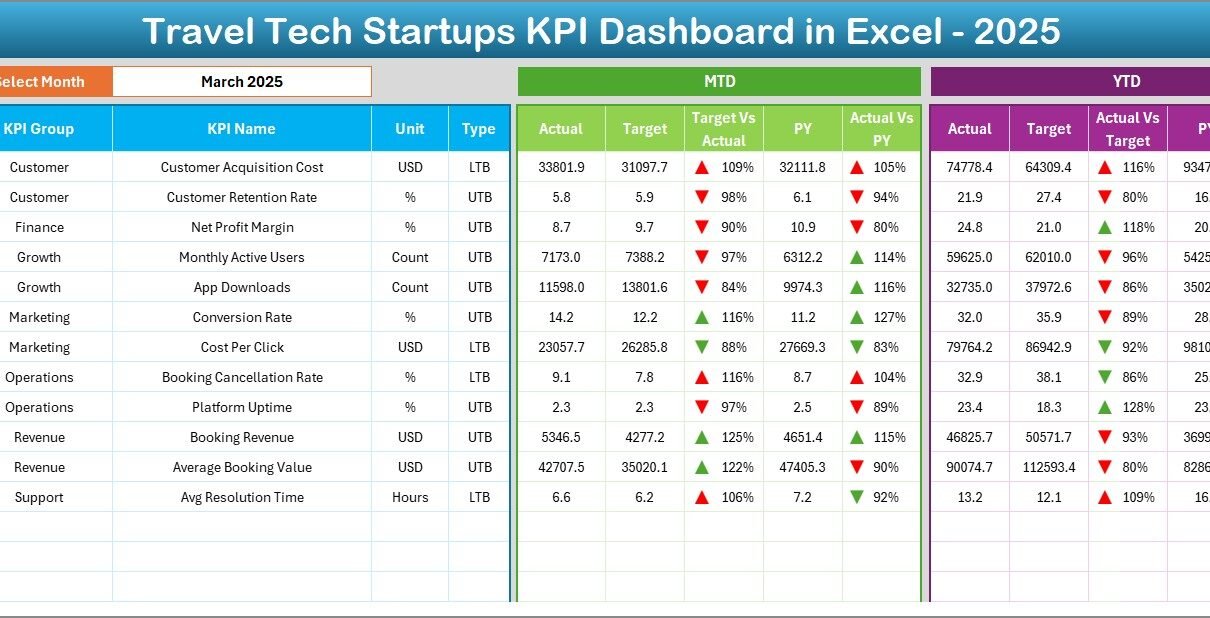
Travel Tech Startups KPI Dashboard in Excel

February 5, 2026October 10, 2026 PKComments Off on Travel Tech Startups KPI Dashboard in Excel
Travel tech startups operate in a fast-moving and highly competitive environment. While innovation drives success, data-driven decision-making sustains growth. However, many founders and operations teams still rely on scattered spreadsheets,
Read More
Dashboard

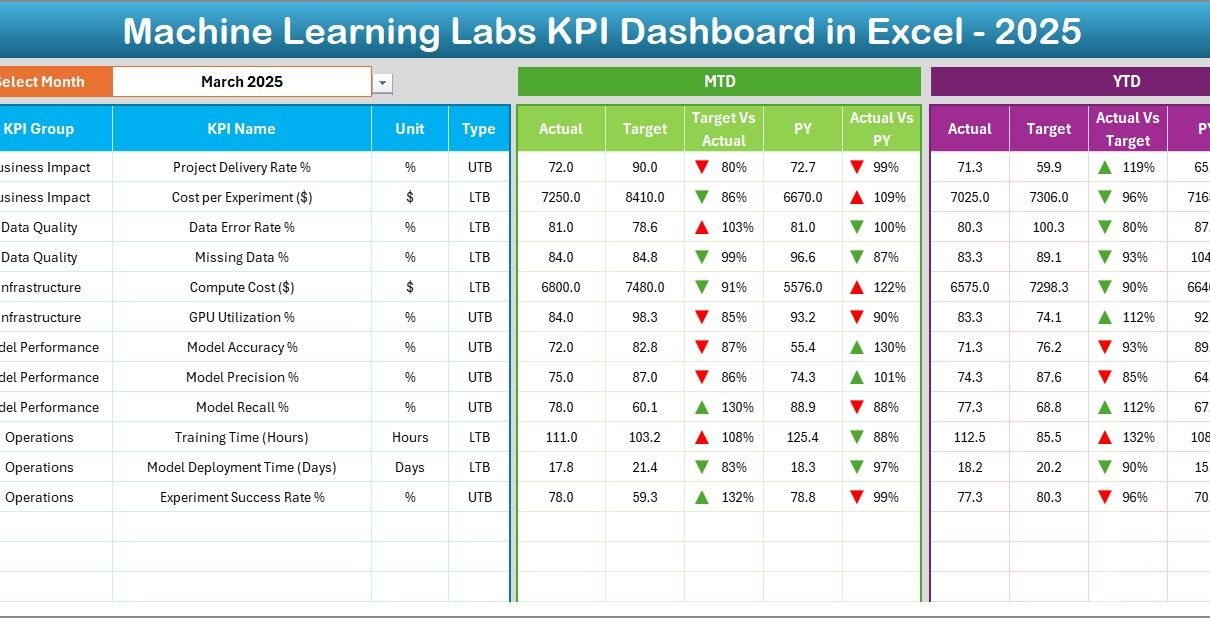
Machine Learning Labs KPI Dashboard in Excel

January 18, 2026January 18, 2026 PKComments Off on Machine Learning Labs KPI Dashboard in Excel
Running a machine learning lab means managing data experiments, models, infrastructure, costs, timelines, and research outcomes—all at the same time. However, when KPIs remain scattered across spreadsheets, tracking performance becomes
Read More
Dashboard

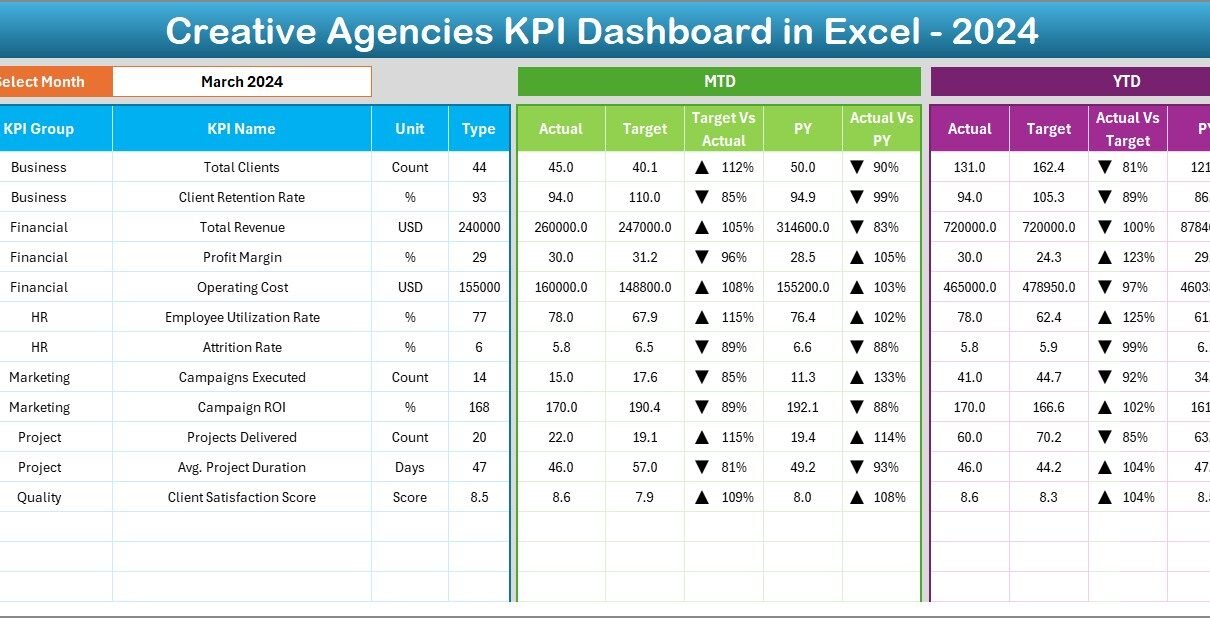
Creative Agencies KPI Dashboard in Excel

January 9, 2026January 9, 2026 PKComments Off on Creative Agencies KPI Dashboard in Excel
Creative agencies work in a fast-moving and highly competitive environment. Therefore, agencies must track performance carefully to stay profitable, productive, and client-focused. However, when data remains scattered across multiple Excel
Read More
Dashboard

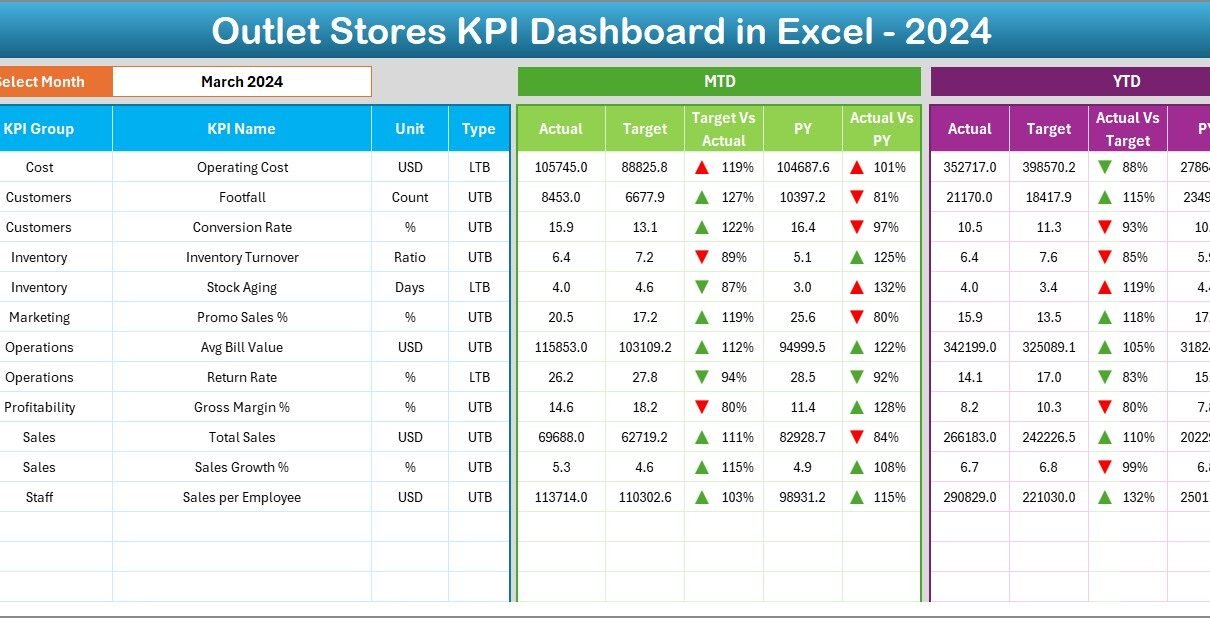
Outlet Stores KPI Dashboard in Excel

January 2, 2026October 10, 2026 PKComments Off on Outlet Stores KPI Dashboard in Excel
Running outlet stores successfully requires much more than selling products at discounted prices. You must constantly monitor sales performance, inventory movement, customer behavior, margins, and operational efficiency. However, when data
Read More
Dashboard Power BI

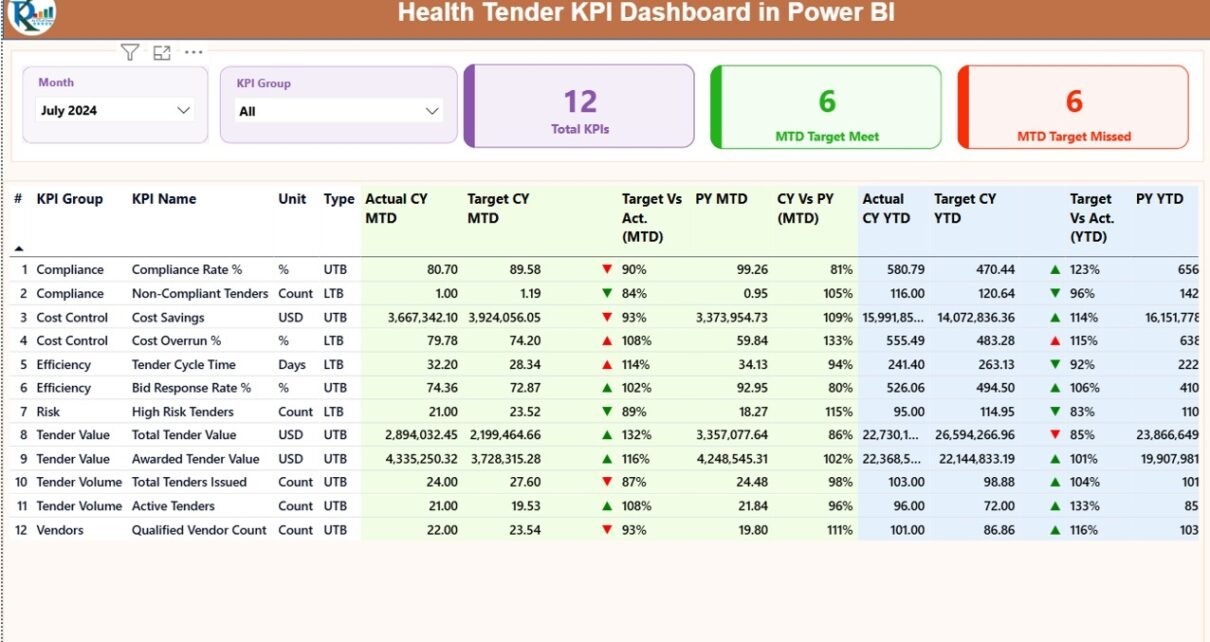
Health Tender KPI Dashboard in Power BI

December 25, 2025December 25, 2025 PKComments Off on Health Tender KPI Dashboard in Power BI
Managing health tenders involves strict compliance, detailed evaluation, and continuous monitoring. Therefore, healthcare organizations need a reliable and data-driven system to track tender performance accurately. A Health Tender KPI Dashboard
Read More
Dashboard Power BI

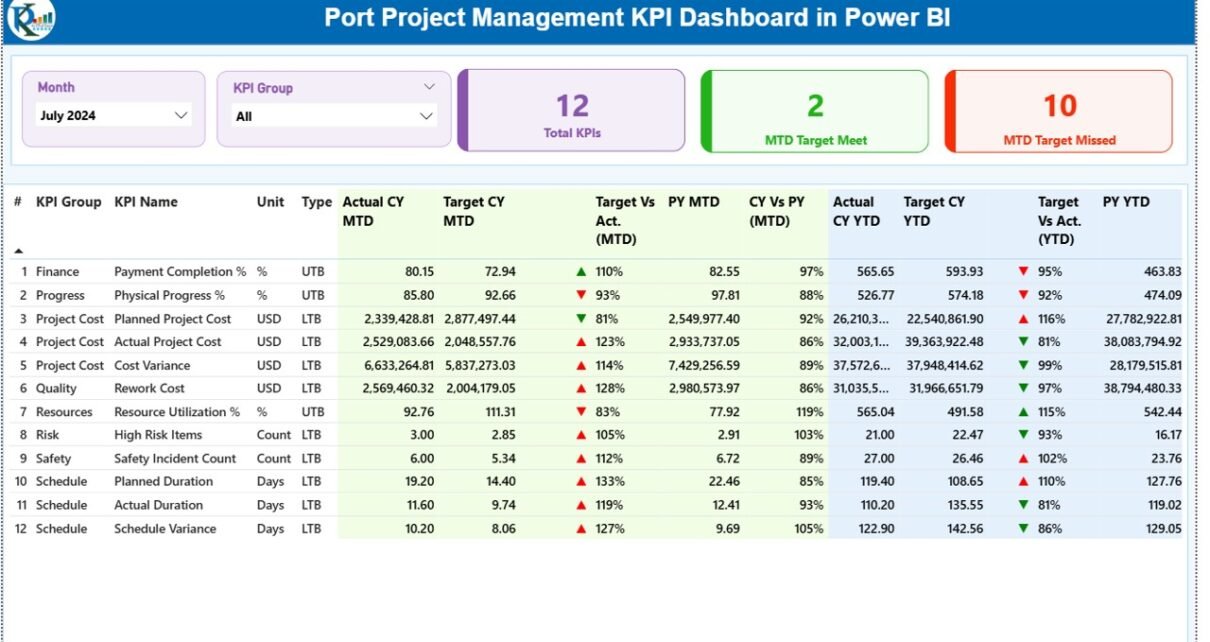
Port Project Management KPI Dashboard in Power BI

December 25, 2025December 25, 2025 PKComments Off on Port Project Management KPI Dashboard in Power BI
Managing port projects demands precision, speed, and complete visibility. Since ports operate with complex infrastructure, multiple contractors, strict timelines, and high financial stakes, tracking project performance manually often leads to
Read More
Dashboard

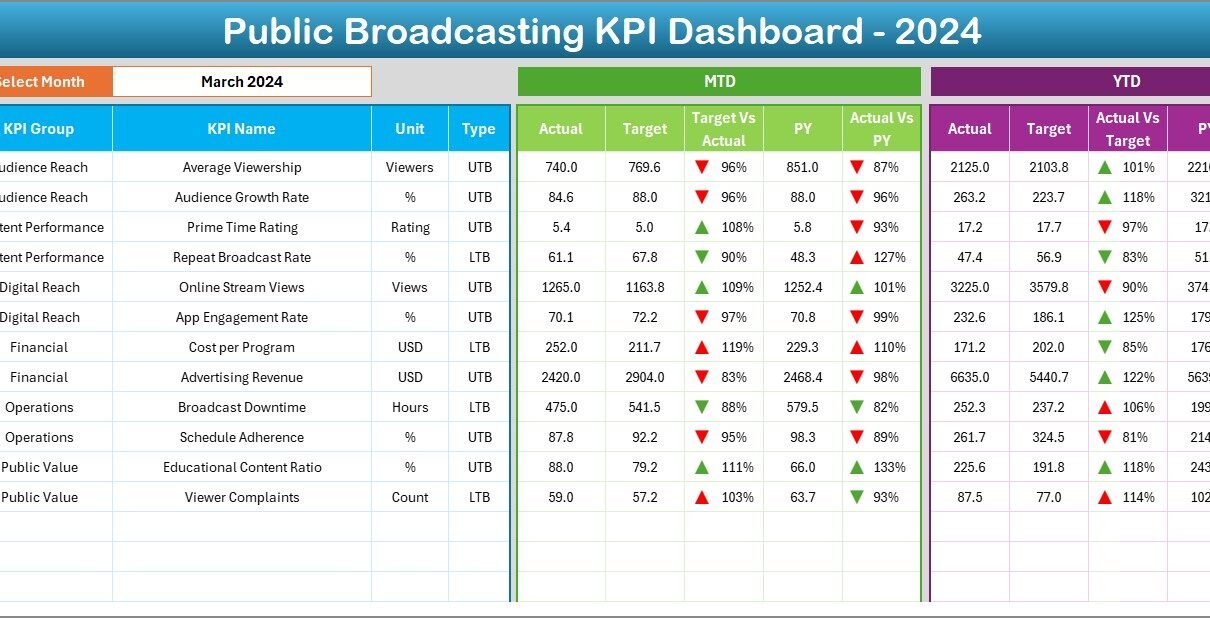
Public Broadcasting KPI Dashboard in Excel

December 20, 2025December 20, 2025 PKComments Off on Public Broadcasting KPI Dashboard in Excel
Public broadcasting plays a vital role in informing, educating, and entertaining audiences. However, public broadcasters face constant pressure to justify funding, improve content reach, manage costs, and demonstrate performance transparency.
Read More

Posts pagination

Previous 1 … 3 4 5 … 8 Next
  • Learn Excel (Free Course)
    • 1. Shortcut Keys
    • 2. Fill & Flash Fill
    • 3. Find & Replace
    • 4. Sort & Filter
    • 5. Formulas & Functions
    • 6. Data Validation
    • 7. Conditional Formatting
    • 8. Basic Charts
    • 9. Advanced Charts
    • 10. Pivot Tables
    • 11. Excel Dashboards
    • 12. VBA Course
    • 13. Excel Formulas with AI
  • Templates
  • Tutorials
    • Charts and Visualization
    • VBA
    • Excel Tips and Tricks
    • Excel Dashboards
    • Power Pivot & DAX
  • Power BI
  • Template Store
    • Ready to Use Templates
  • Courses
  • Academy
    • Excel + AI Mastery: 100 Formulas
    • Excel Pivot Tables & Dashboards
  • About Us
  • Contact Us
Copyright © 2023 PK-AnExcelExpert.com - Privacy Policy