New: NextGenTemplates Academy - video courses on Excel formulas with AI and Pivot Tables & dashboards. Early-bird: 20% off with code EARLYBIRD20 - first 20 orders only. See the courses →
  • Learn Excel (Free Course)
    • 1. Shortcut Keys
    • 2. Fill & Flash Fill
    • 3. Find & Replace
    • 4. Sort & Filter
    • 5. Formulas & Functions
    • 6. Data Validation
    • 7. Conditional Formatting
    • 8. Basic Charts
    • 9. Advanced Charts
    • 10. Pivot Tables
    • 11. Excel Dashboards
    • 12. VBA Course
    • 13. Excel Formulas with AI
  • Templates
  • Tutorials
    • Charts and Visualization
    • VBA
    • Excel Tips and Tricks
    • Excel Dashboards
    • Power Pivot & DAX
  • Power BI
  • Template Store
    • Ready to Use Templates
  • Courses
  • Academy
    • Excel + AI Mastery: 100 Formulas
    • Excel Pivot Tables & Dashboards
  • About Us
  • Contact Us

PK: An Excel Expert

Transforming Data into Decisions

Tag: MTD YTD dashboard

Dashboard Power BI

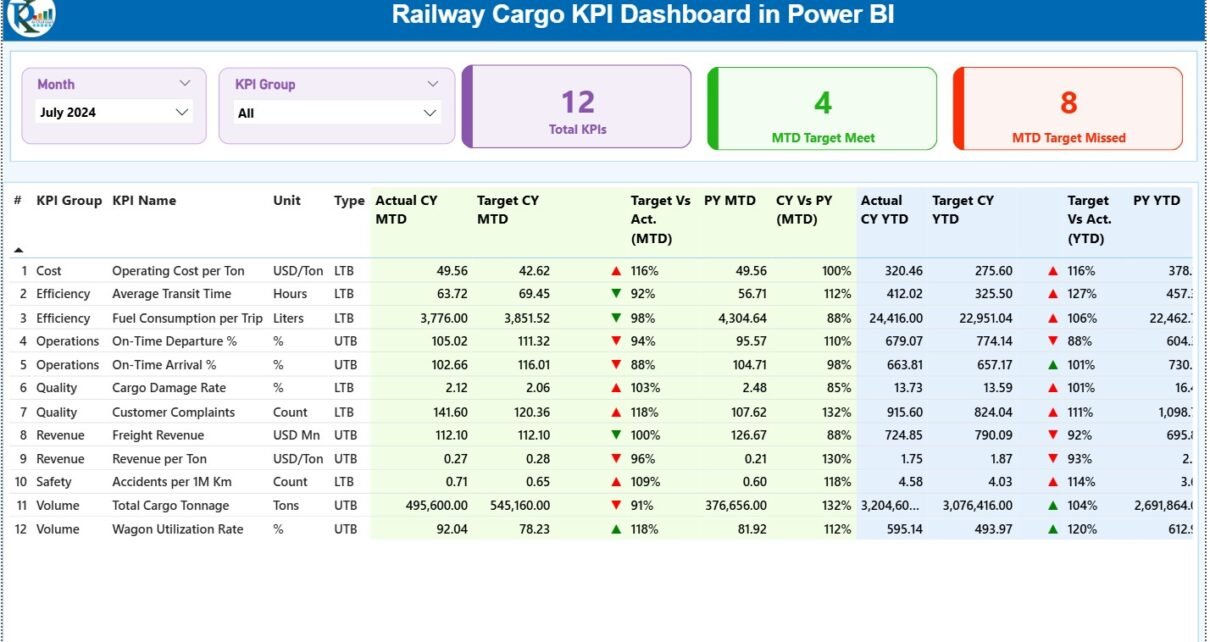
Railway Cargo KPI Dashboard in Power BI

December 20, 2025December 20, 2025 PKComments Off on Railway Cargo KPI Dashboard in Power BI
Railway cargo operations form the backbone of large-scale logistics and national supply chains. Every day, railway authorities, freight operators, and logistics planners move massive volumes of goods across regions and
Read More
Dashboard Power BI

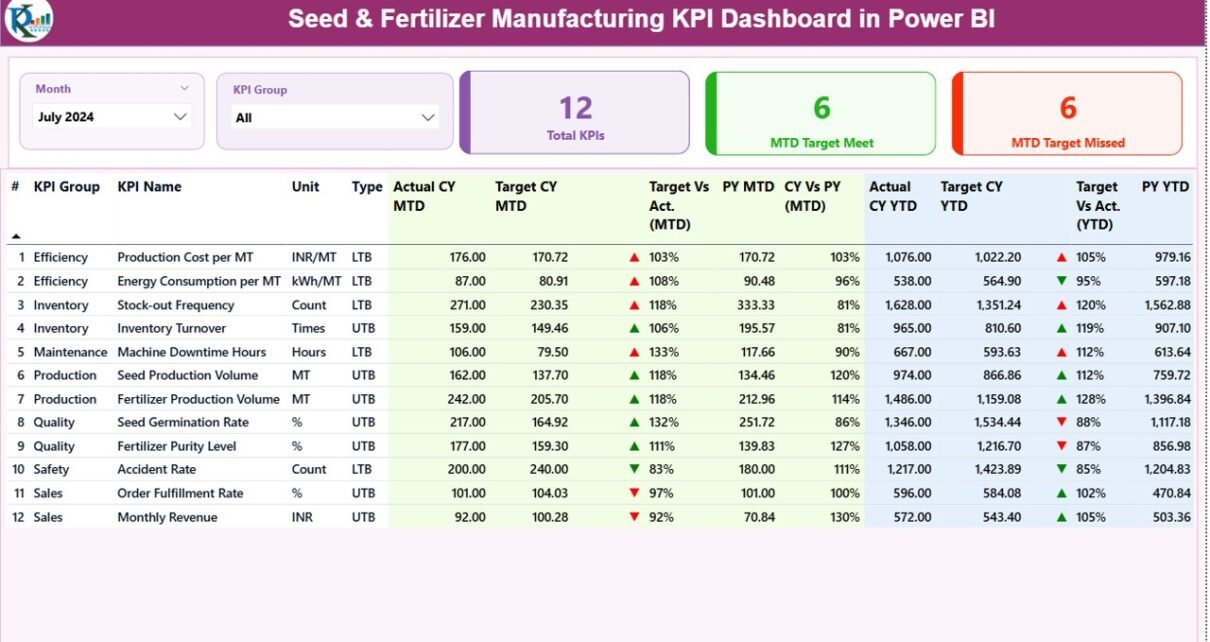
Seed & Fertilizer Manufacturing KPI Dashboard in Power BI

December 16, 2025December 16, 2025 PKComments Off on Seed & Fertilizer Manufacturing KPI Dashboard in Power BI
Seed and fertilizer manufacturing plays a vital role in global agriculture. Every day, manufacturers handle complex production cycles, raw material planning, quality checks, regulatory compliance, inventory control, and timely distribution.
Read More
Power BI

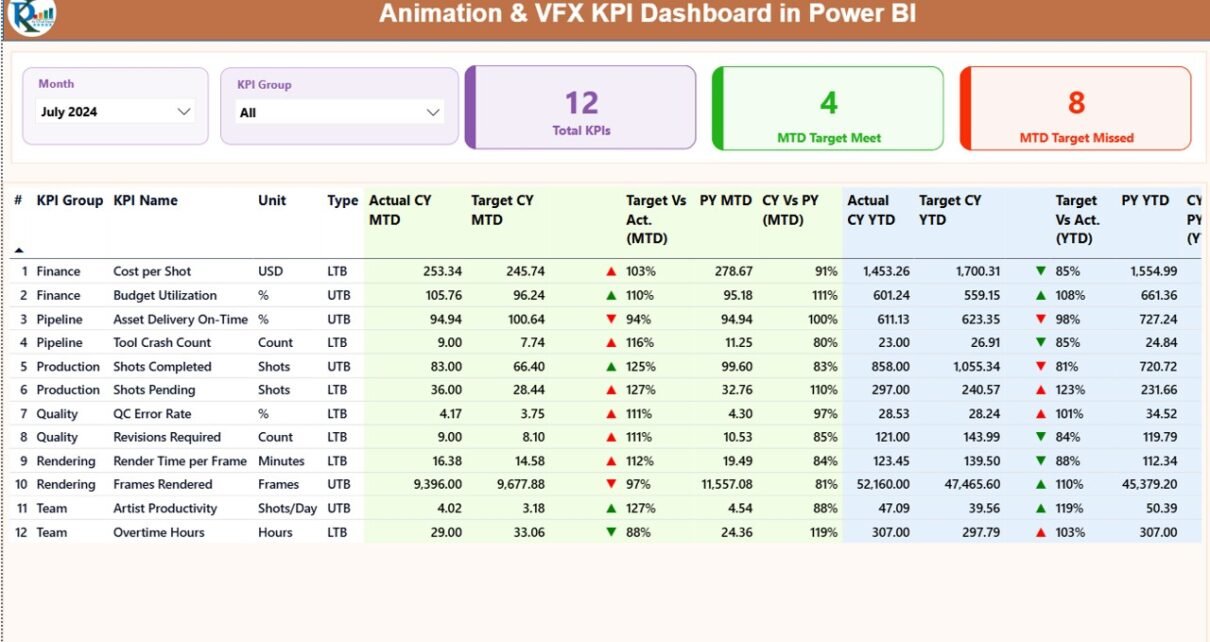
Animation & VFX KPI Dashboard in Power BI

December 13, 2025December 13, 2025 PKComments Off on Animation & VFX KPI Dashboard in Power BI
In today’s fast-moving animation and visual effects industry, studios face constant pressure to deliver high-quality output on time and within budget. At the same time, creative leaders, production managers, and
Read More
Dashboard

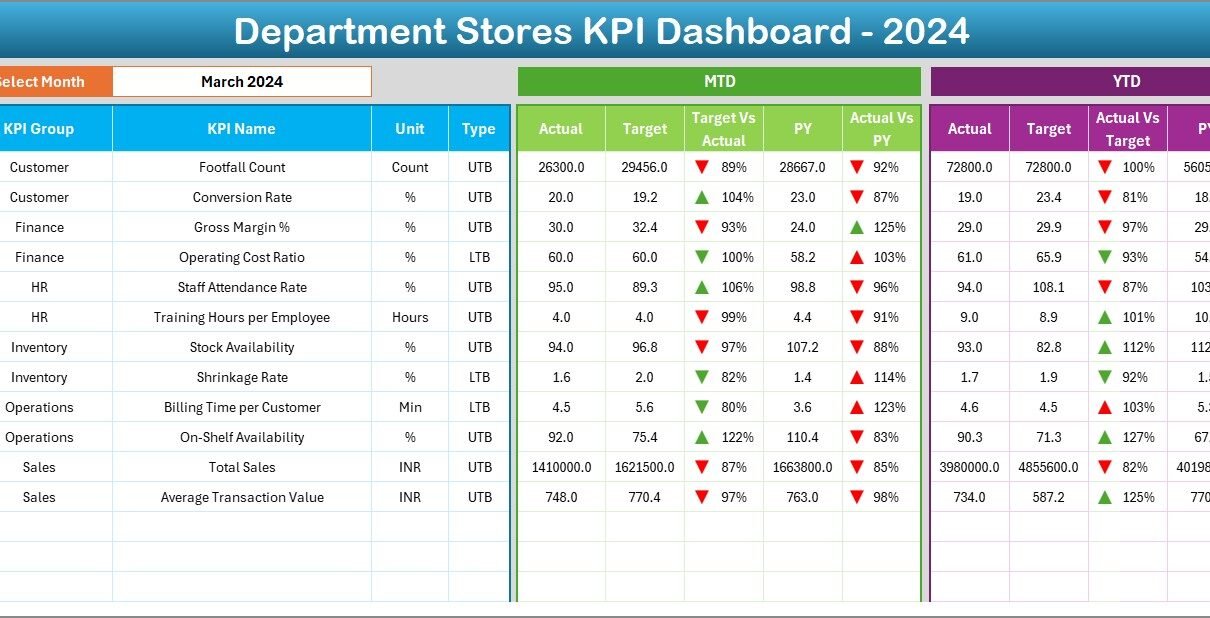
Department Stores KPI Dashboard in Excel

December 12, 2025December 12, 2025 PKComments Off on Department Stores KPI Dashboard in Excel
Department stores operate in one of the most competitive sectors of modern retail. Customers expect excellent service, fresh inventory, fast checkout, clear pricing, and a consistent shopping experience. Because of
Read More
Dashboard

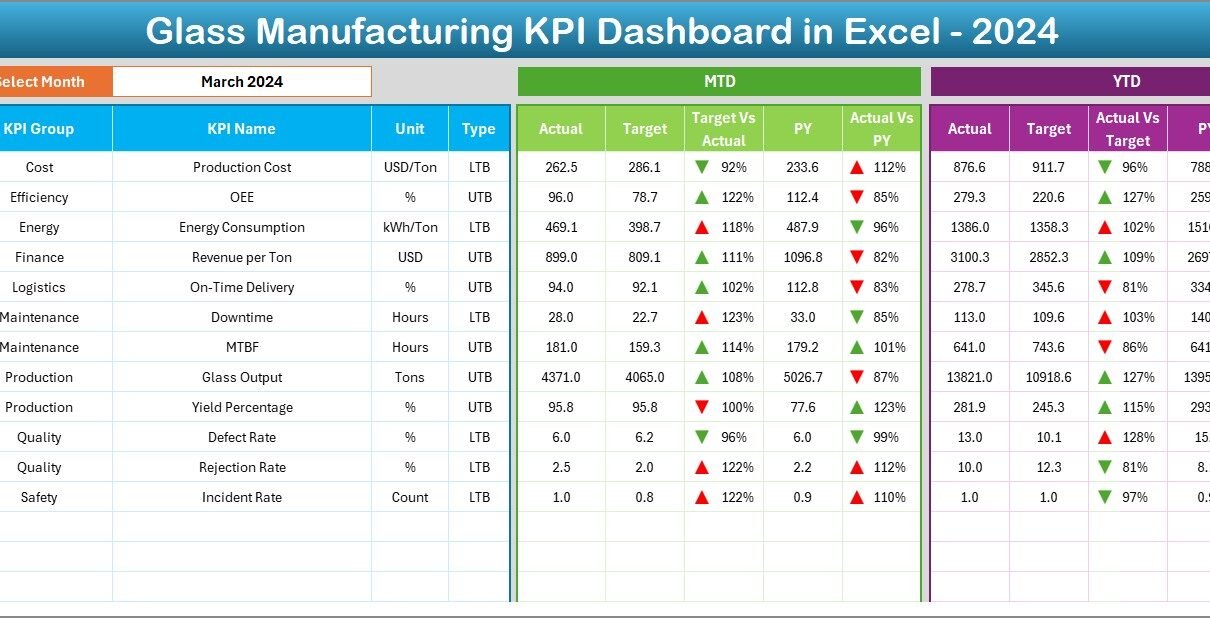
Glass Manufacturing KPI Dashboard in Excel

December 9, 2025December 9, 2025 PKComments Off on Glass Manufacturing KPI Dashboard in Excel
Running a glass manufacturing unit without clear performance visibility often leads to higher waste, increased downtime, missed targets, and delayed decisions. Although production teams generate大量 data every day, many organizations
Read More
Dashboard

Seed & Fertilizer Manufacturing KPI Dashboard in Excel

December 5, 2025December 5, 2025 PKComments Off on Seed & Fertilizer Manufacturing KPI Dashboard in Excel
Seed and fertilizer manufacturing industries face constant pressure to improve productivity, reduce defects, optimize costs, and maintain high product quality. When operational data stays scattered across spreadsheets, emails, and manual
Read More
Dashboard Power BI

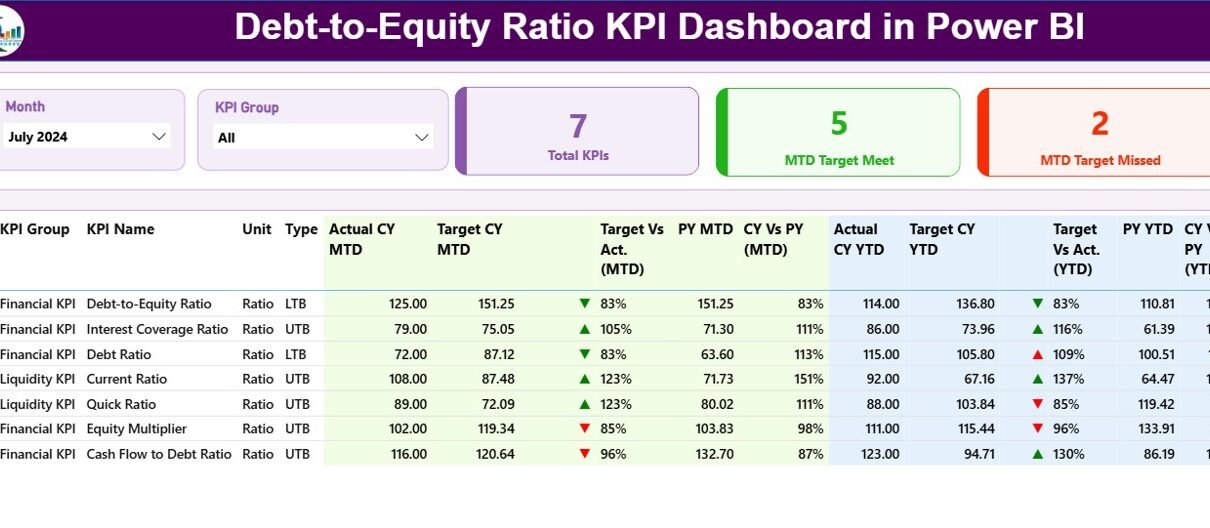
Debt-to-Equity Ratio KPI Dashboard in Power BI

December 4, 2025December 4, 2025 PKComments Off on Debt-to-Equity Ratio KPI Dashboard in Power BI
Financial performance becomes clear when you track the right KPIs. The Debt-to-Equity Ratio is one of the most important financial indicators because it shows the stability and long-term strength of
Read More
Dashboard Power BI

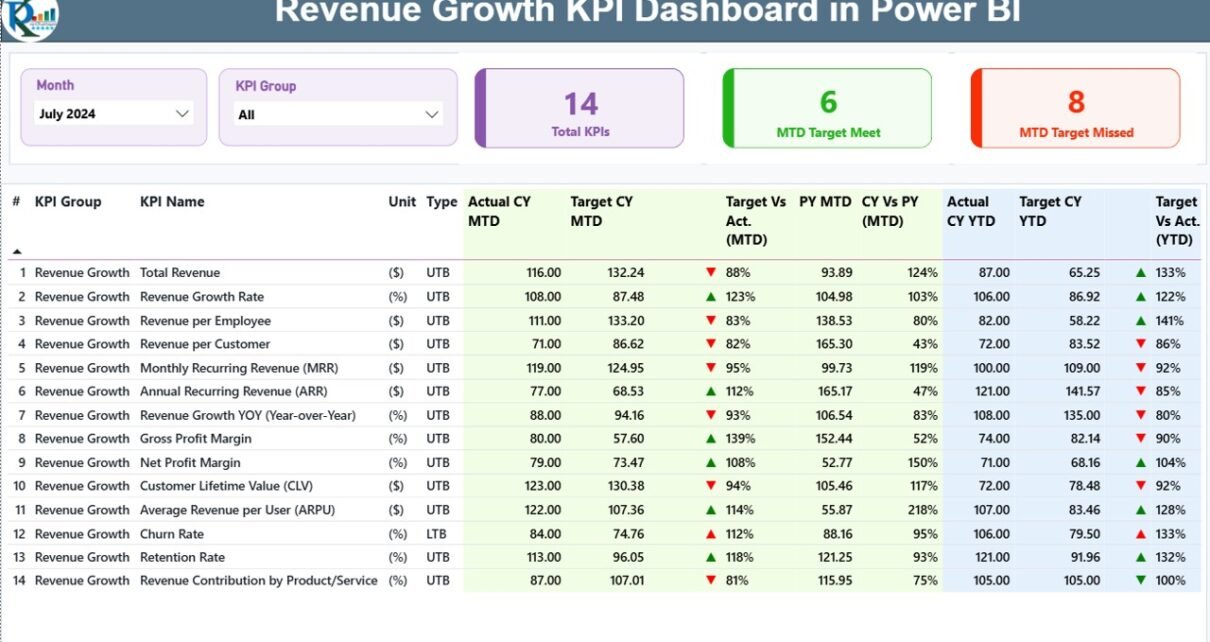
Revenue Growth KPI Dashboard in Power BI

December 3, 2025December 3, 2025 PKComments Off on Revenue Growth KPI Dashboard in Power BI
Businesses need fast and clear insights to grow their revenue. Sales change every month, new products enter the market, customer behaviour shifts often, and marketing teams run many campaigns. Because
Read More
Dashboard Power BI

Water Utilities KPI Dashboard in Power BI

December 3, 2025December 3, 2025 PKComments Off on Water Utilities KPI Dashboard in Power BI
Managing water utilities demands accuracy, speed, and complete visibility. Teams monitor water production, distribution, losses, energy usage, quality, billing, and operational efficiency every day. When the data stays in different
Read More
Templates

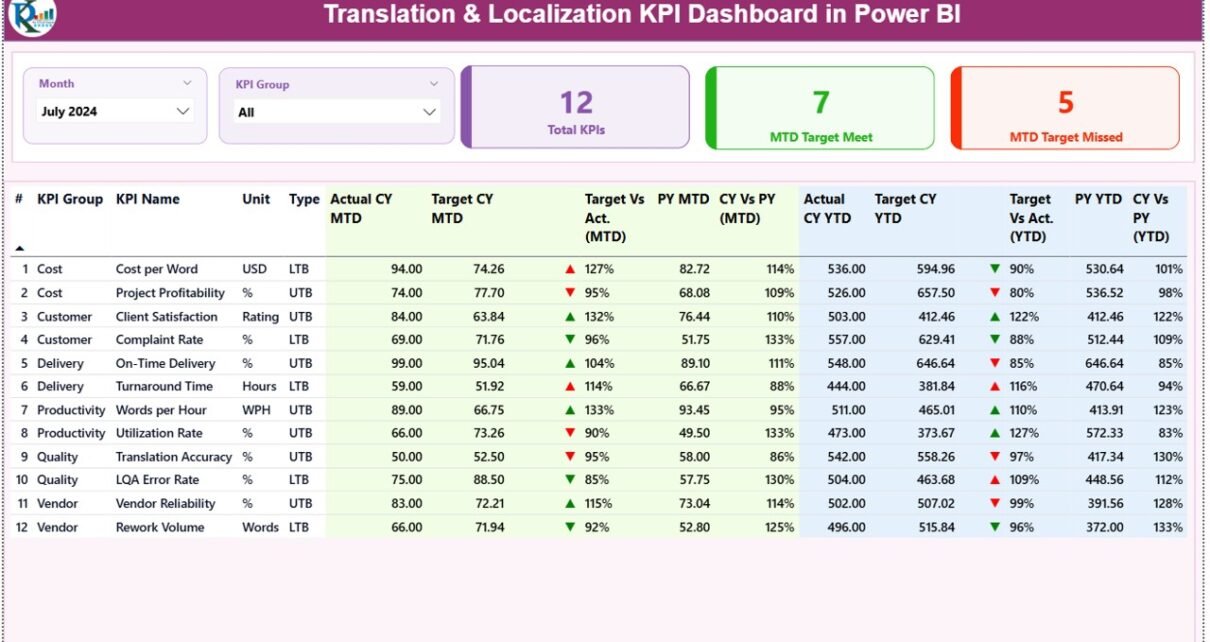
Translation & Localization KPI Dashboard in Power BI

December 1, 2025December 1, 2025 PKComments Off on Translation & Localization KPI Dashboard in Power BI
Managing translation and localization projects becomes easier when you track performance with clarity. Global companies deal with several languages, tight deadlines, skilled translators, quality standards, and fast delivery expectations. Because
Read More

Posts pagination

Previous 1 … 4 5 6 … 8 Next
  • Learn Excel (Free Course)
    • 1. Shortcut Keys
    • 2. Fill & Flash Fill
    • 3. Find & Replace
    • 4. Sort & Filter
    • 5. Formulas & Functions
    • 6. Data Validation
    • 7. Conditional Formatting
    • 8. Basic Charts
    • 9. Advanced Charts
    • 10. Pivot Tables
    • 11. Excel Dashboards
    • 12. VBA Course
    • 13. Excel Formulas with AI
  • Templates
  • Tutorials
    • Charts and Visualization
    • VBA
    • Excel Tips and Tricks
    • Excel Dashboards
    • Power Pivot & DAX
  • Power BI
  • Template Store
    • Ready to Use Templates
  • Courses
  • Academy
    • Excel + AI Mastery: 100 Formulas
    • Excel Pivot Tables & Dashboards
  • About Us
  • Contact Us
Copyright © 2023 PK-AnExcelExpert.com - Privacy Policy