New: NextGenTemplates Academy - video courses on Excel formulas with AI and Pivot Tables & dashboards. Early-bird: 20% off with code EARLYBIRD20 - first 20 orders only. See the courses →
  • Learn Excel (Free Course)
    • 1. Shortcut Keys
    • 2. Fill & Flash Fill
    • 3. Find & Replace
    • 4. Sort & Filter
    • 5. Formulas & Functions
    • 6. Data Validation
    • 7. Conditional Formatting
    • 8. Basic Charts
    • 9. Advanced Charts
    • 10. Pivot Tables
    • 11. Excel Dashboards
    • 12. VBA Course
    • 13. Excel Formulas with AI
  • Templates
  • Tutorials
    • Charts and Visualization
    • VBA
    • Excel Tips and Tricks
    • Excel Dashboards
    • Power Pivot & DAX
  • Power BI
  • Template Store
    • Ready to Use Templates
  • Courses
  • Academy
    • Excel + AI Mastery: 100 Formulas
    • Excel Pivot Tables & Dashboards
  • About Us
  • Contact Us

PK: An Excel Expert

Transforming Data into Decisions
Tag: MTD YTD dashboard

Dashboard Power BI

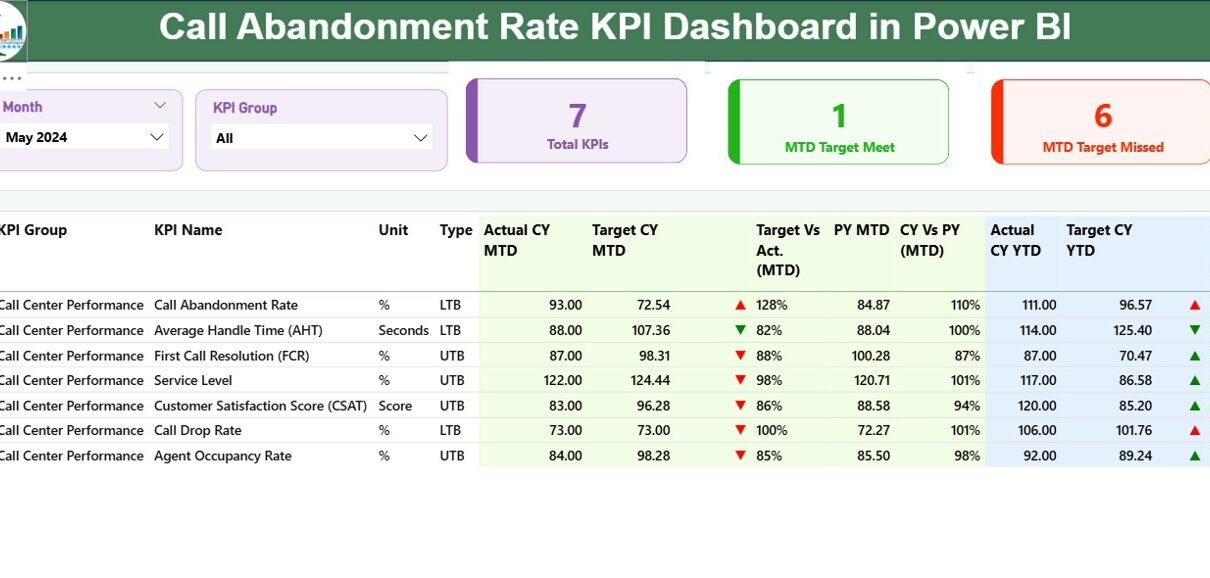
Call Abandonment Rate KPI Dashboard in Power BI

December 1, 2025December 1, 2025 PKComments Off on Call Abandonment Rate KPI Dashboard in Power BI
Call centers deal with hundreds or even thousands of customer calls every day. When the workload increases, many callers hang up before they reach an agent. This impacts customer satisfaction,
Read More
Templates

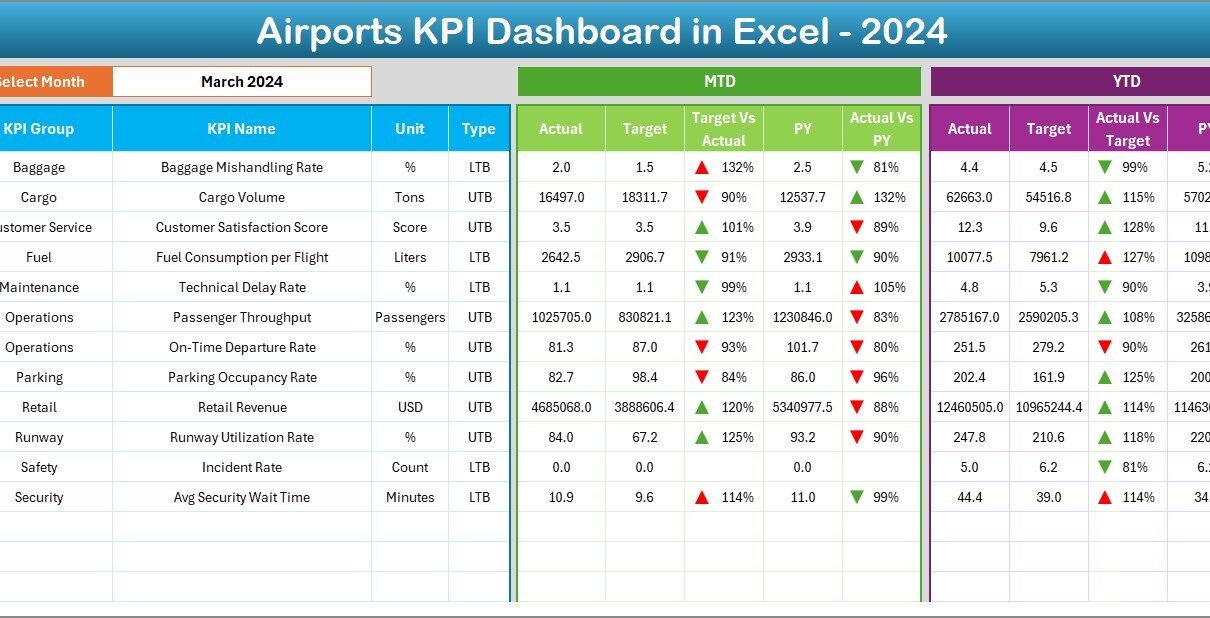
Airports KPI Dashboard in Excel

November 29, 2025November 29, 2025 PKComments Off on Airports KPI Dashboard in Excel
Efficient airport management depends on clear insights, accurate metrics, and real-time visibility. Airports handle thousands of passengers, flights, and operational processes every single day. Because of this high level of
Read More
Dashboard Power BI

Tech Support Efficiency KPI Dashboard in Power BI

November 26, 2025November 26, 2025 PKComments Off on Tech Support Efficiency KPI Dashboard in Power BI
Managing a tech support team demands speed, accuracy, and clear visibility. Businesses receive hundreds of support requests every day, and leaders must track performance continuously. When teams respond fast, resolve
Read More
Dashboard Power BI

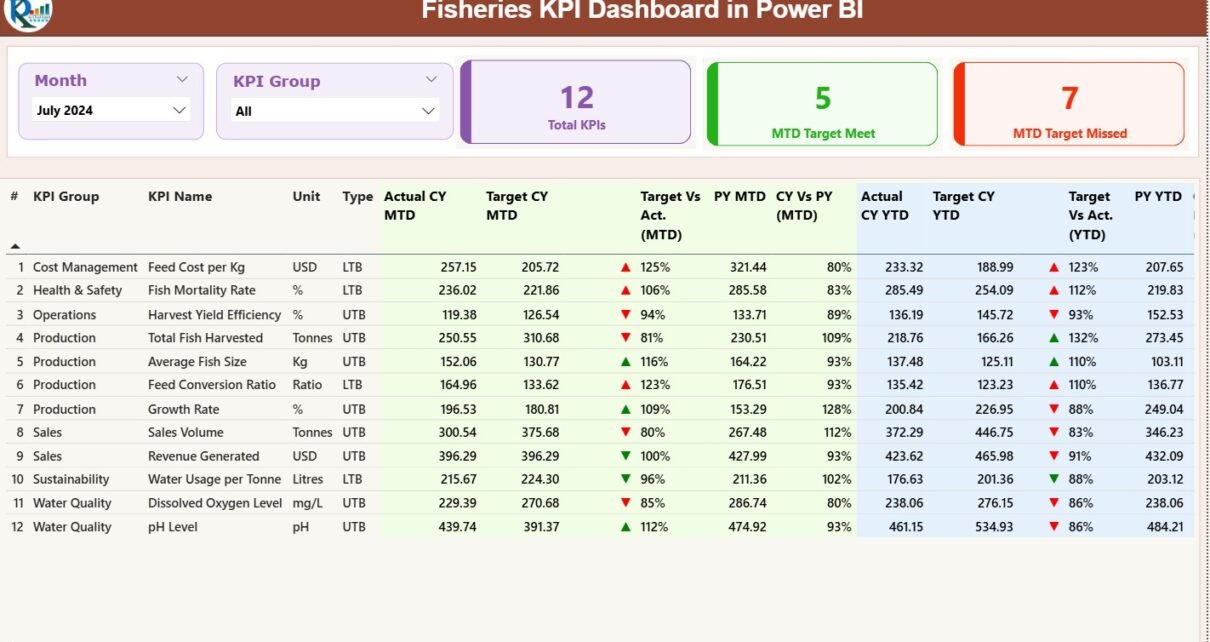
Fisheries KPI Dashboard in Power BI

November 25, 2025November 25, 2025 PKComments Off on Fisheries KPI Dashboard in Power BI
The fisheries sector depends on accurate tracking, daily monitoring, and fast decision-making. From fish stock levels and catch volumes to operational costs and production efficiency, every detail influences sustainability and
Read More
Dashboard Power BI

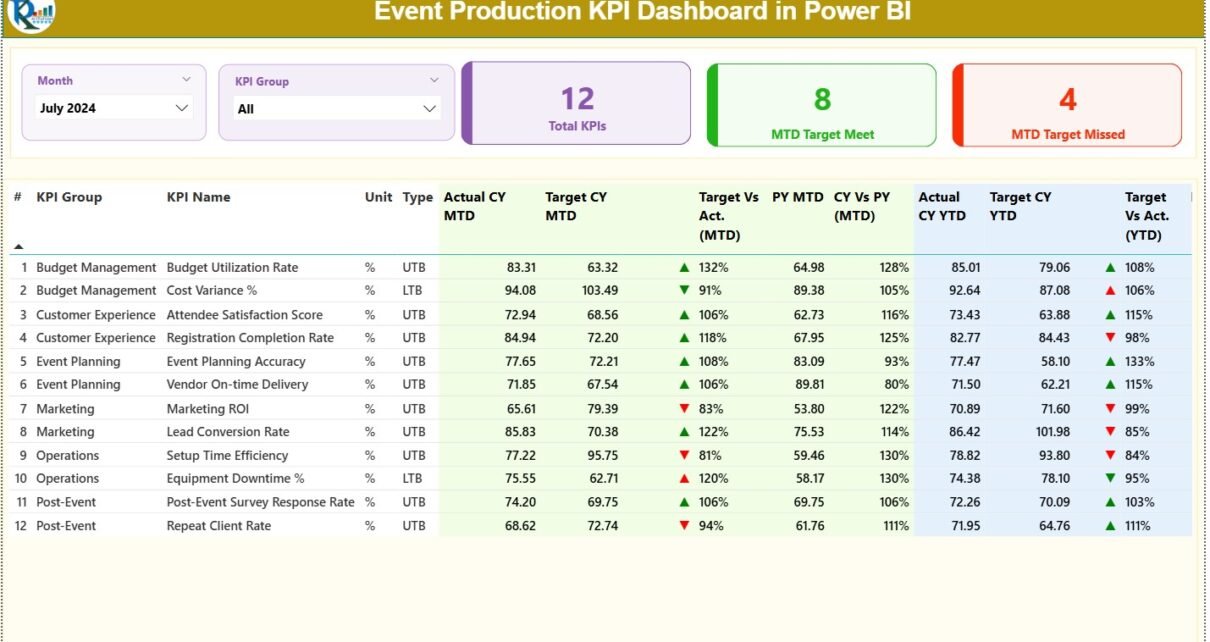
Event Production KPI Dashboard in Power BI

November 25, 2025November 25, 2025 PKComments Off on Event Production KPI Dashboard in Power BI
Event production requires speed, planning, and real-time performance tracking. Every event brings many moving parts—venue operations, logistics, staffing, budgeting, timelines, and vendor coordination. Because of this, event managers need timely
Read More
Templates

Tax Advisory KPI Dashboard in Excel

November 24, 2025November 24, 2025 PKComments Off on Tax Advisory KPI Dashboard in Excel
In today’s fast-moving business world, tax departments deal with strict deadlines, complex regulations, and the growing need for accuracy. Because of this, tax professionals must monitor their Key Performance Indicators
Read More
Dashboard

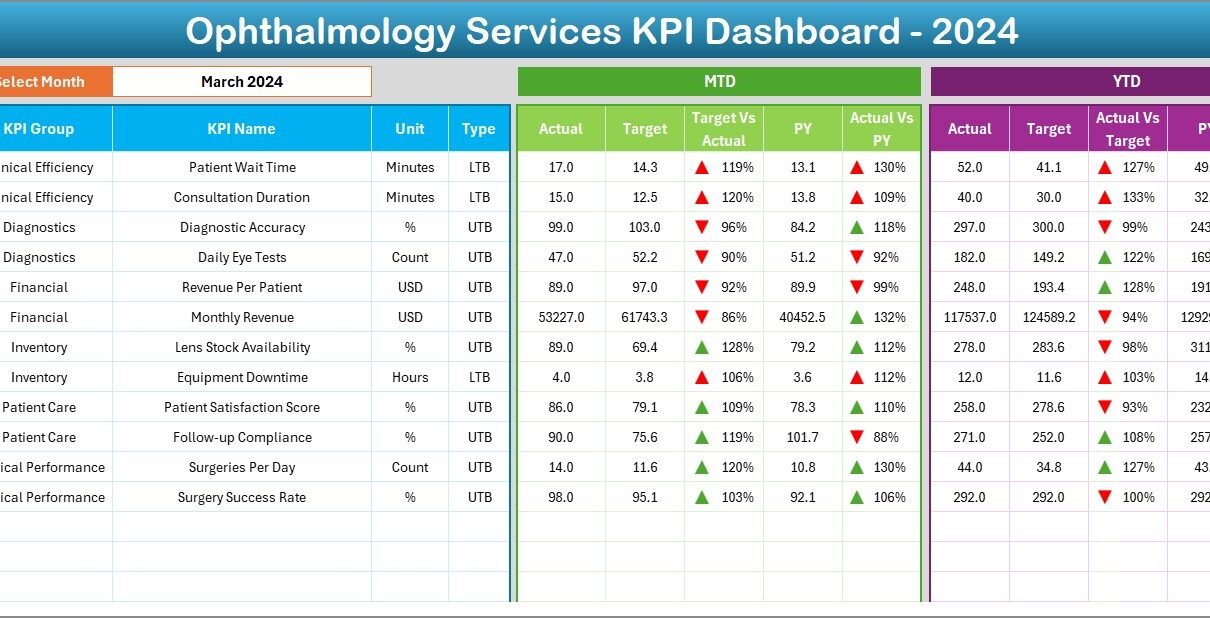
Ophthalmology Services KPI Dashboard in Excel

November 23, 2025November 23, 2025 PKComments Off on Ophthalmology Services KPI Dashboard in Excel
Ophthalmology is one of the fastest-growing specialties in healthcare. As patient demand rises and diagnostic technologies evolve, eye-care providers need accurate, real-time insights to track performance, improve services, and maintain
Read More
Dashboard Power BI

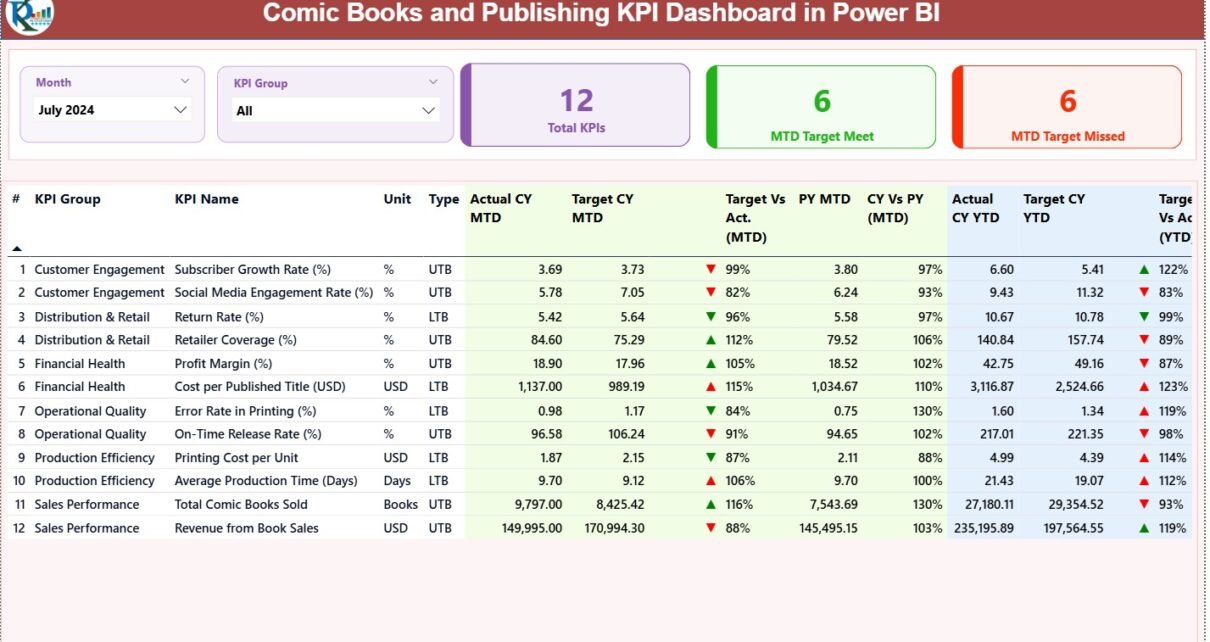
Comic Books and Publishing KPI Dashboard in Power BI

November 23, 2025November 23, 2025 PKComments Off on Comic Books and Publishing KPI Dashboard in Power BI
The comic book and publishing industry grows every year, and so does the need for clear insights, fast decision-making, and accurate performance tracking. Because competition increases each day, publishers, comic
Read More
Templates

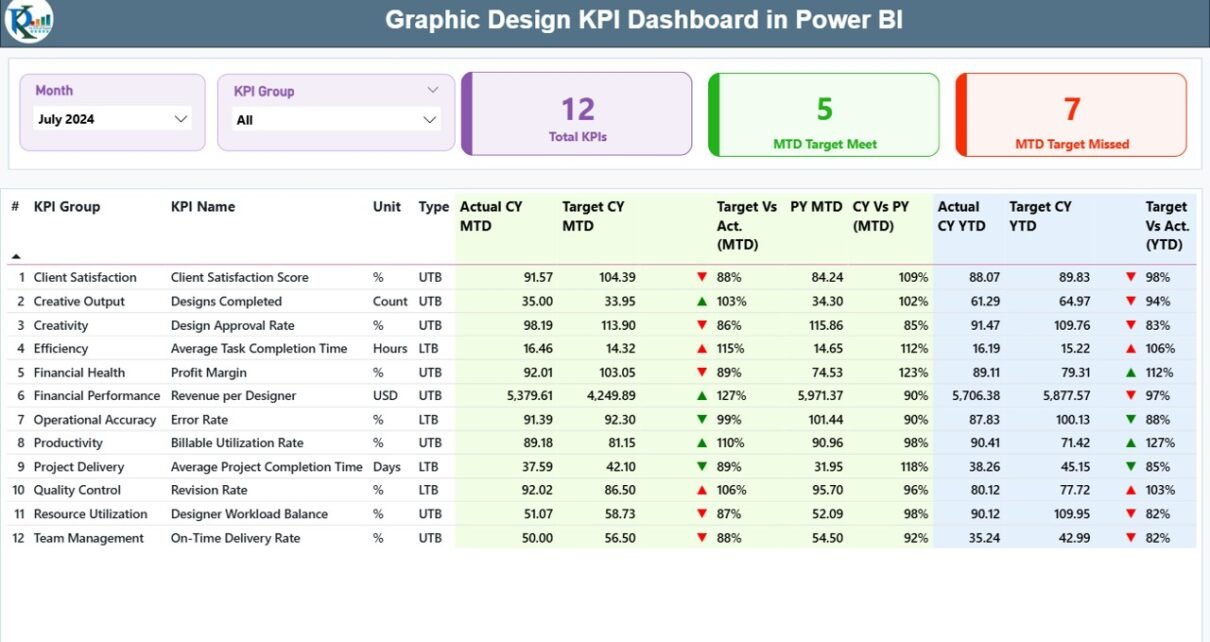
Graphic Design KPI Dashboard in Power BI

November 22, 2025November 22, 2025 PKComments Off on Graphic Design KPI Dashboard in Power BI
Graphic design teams handle many activities at the same time. They work on branding, advertising, social media, UI/UX assets, packaging, and many other design tasks. Because the workload increases every
Read More
Templates

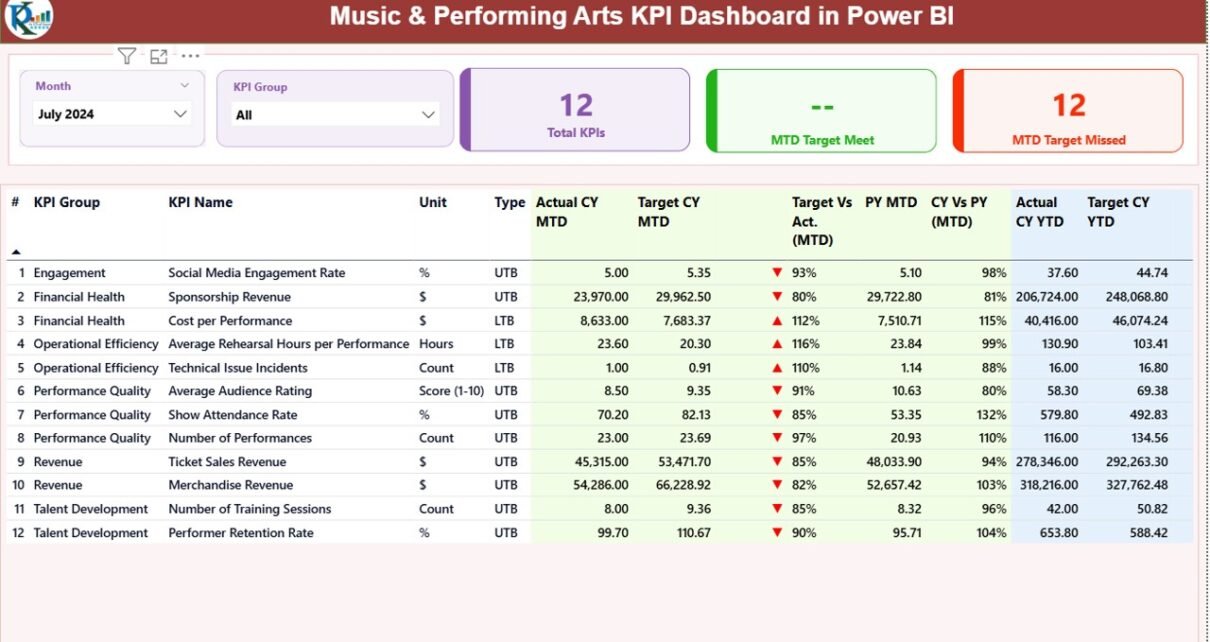
Music & Performing Arts KPI Dashboard in Power BI

November 21, 2025November 21, 2025 PKComments Off on Music & Performing Arts KPI Dashboard in Power BI
Managing music performances, cultural programs, rehearsals, and artist development demands constant attention. Teams handle many tasks at the same time such as event planning, stage setup, rehearsal management, ticket sales,
Read More

Posts pagination

Previous 1 … 5 6 7 8 Next
  • Learn Excel (Free Course)
    • 1. Shortcut Keys
    • 2. Fill & Flash Fill
    • 3. Find & Replace
    • 4. Sort & Filter
    • 5. Formulas & Functions
    • 6. Data Validation
    • 7. Conditional Formatting
    • 8. Basic Charts
    • 9. Advanced Charts
    • 10. Pivot Tables
    • 11. Excel Dashboards
    • 12. VBA Course
    • 13. Excel Formulas with AI
  • Templates
  • Tutorials
    • Charts and Visualization
    • VBA
    • Excel Tips and Tricks
    • Excel Dashboards
    • Power Pivot & DAX
  • Power BI
  • Template Store
    • Ready to Use Templates
  • Courses
  • Academy
    • Excel + AI Mastery: 100 Formulas
    • Excel Pivot Tables & Dashboards
  • About Us
  • Contact Us
Copyright © 2023 PK-AnExcelExpert.com - Privacy Policy