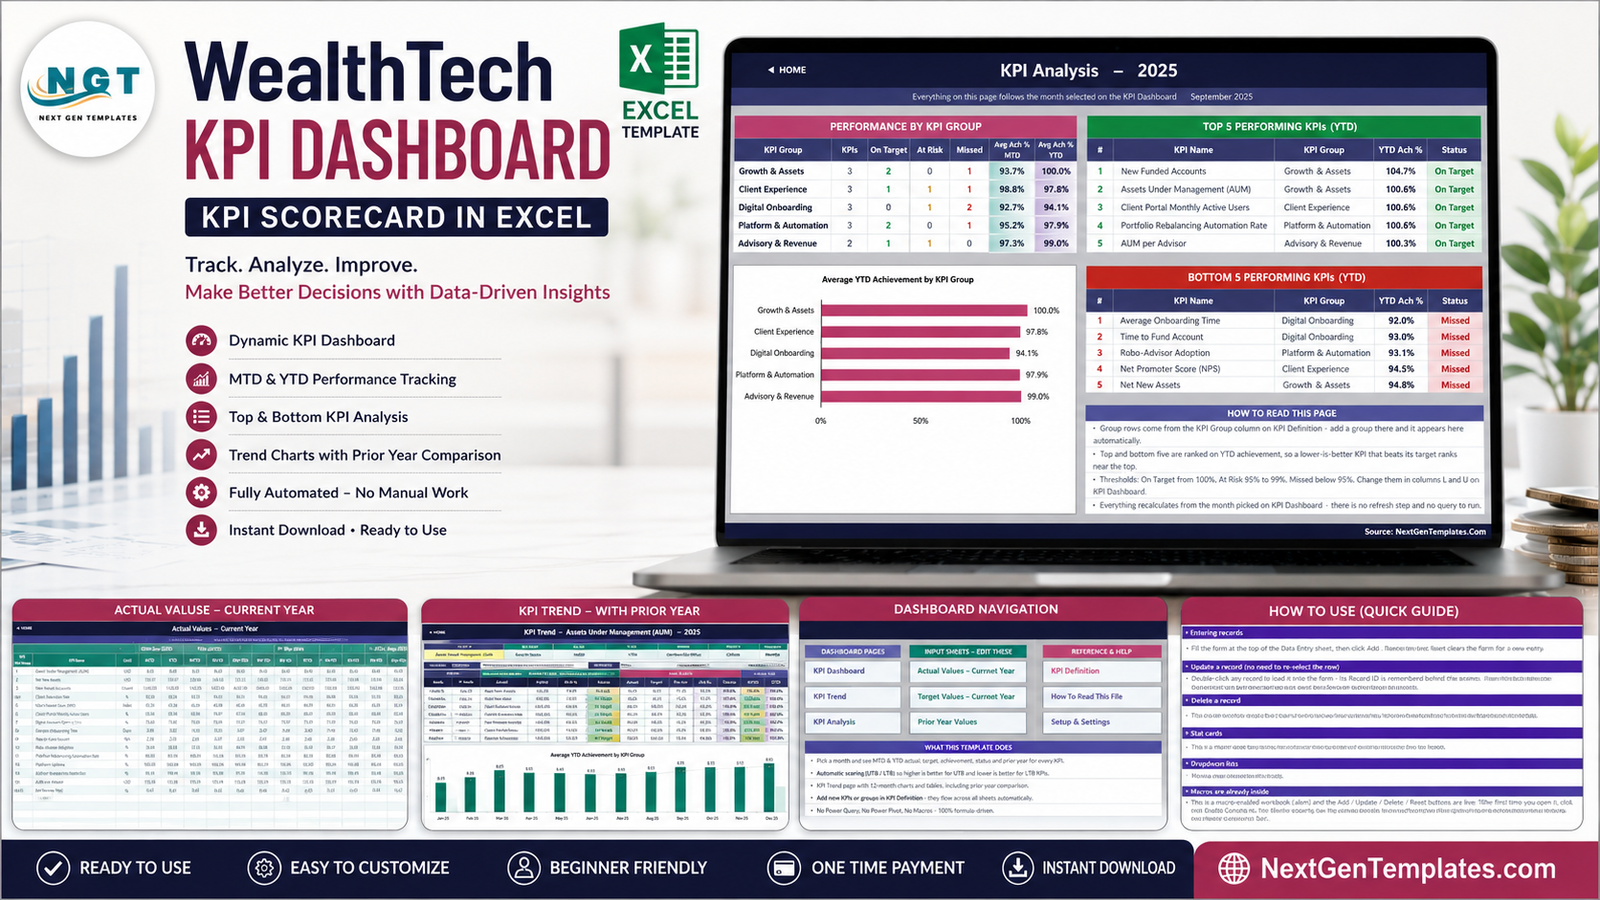
The WealthTech KPI Dashboard in Excel organizes 14 sample indicators across 5 management groups and 12 months. In one workbook, teams can compare MTD and YTD actuals with targets and prior-year values, see 7 headline cards, investigate a selected KPI, and rank the top and bottom five YTD results. The file uses standard Excel formulas rather than Power Query, Power Pivot or macros.
This distinction matters: it is a management scorecard for summarized values that your team enters and validates. It is not a live wealth platform, portfolio-accounting system, return engine, suitability tool, trading application, regulatory filing solution or source of investment advice.
For teams that already use Excel, the template provides a structured starting point without a subscription. You can find general spreadsheet guidance in Microsoft Excel Help & Learning.
Key Features of the WealthTech KPI Dashboard in Excel
- 14 editable KPIs in five groups: Growth & Assets, Client Experience, Digital Onboarding, Platform & Automation, and Advisory & Revenue.
- MTD and YTD views: Actual, Target, Achievement %, Status, Prior Year and year-over-year movement appear side by side.
- Seven summary cards: total KPIs, three YTD status counts, KPIs improving versus prior year, and average MTD/YTD achievement.
- Direction-aware logic: Upper the Better and Lower the Better types prevent a lower cycle time from being treated as poor performance.
- Single-KPI analysis: review the selected metric’s attributes, 12-month table and MTD/YTD charts.
- Group and exception review: compare group-level achievement and rank the top and bottom five KPIs.
- 22 live rows: 14 sample KPIs are filled and eight additional rows are available in the supplied layout.
- No refresh process: plain worksheet formulas recalculate from the entered values and selected month.
Dashboard Pages Explanation
Home and Workbook Map
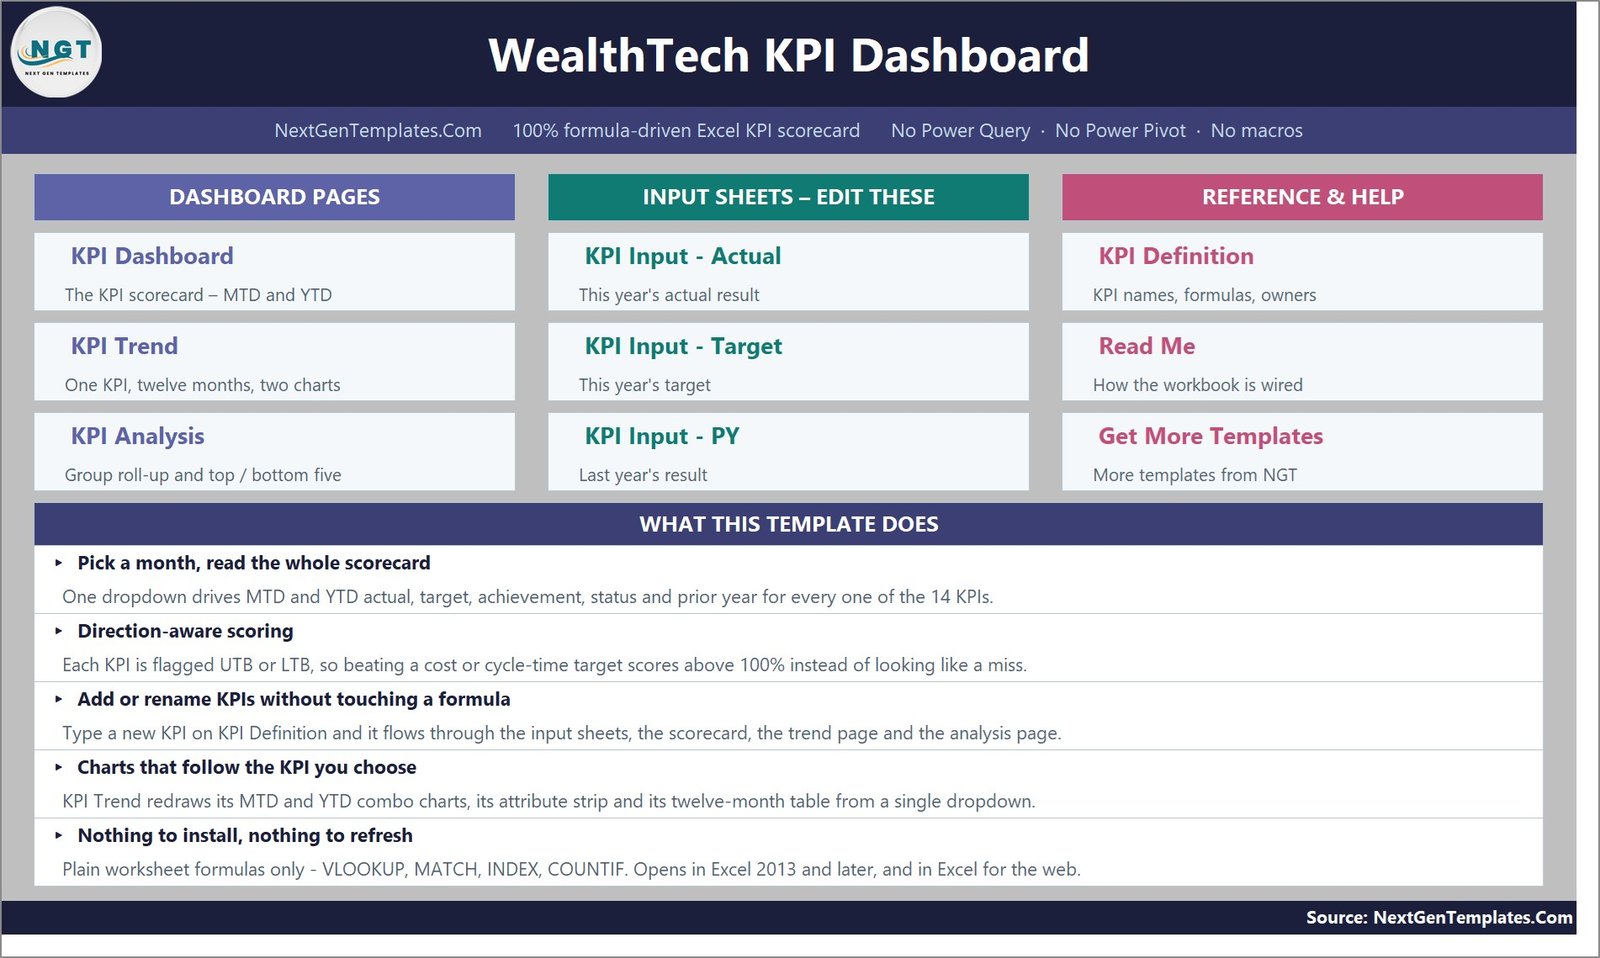
The Home page separates dashboard pages, input sheets and reference/help sheets. It also states the key design choices: a formula-driven workbook with no Power Query, Power Pivot or macros.
KPI Dashboard Scorecard
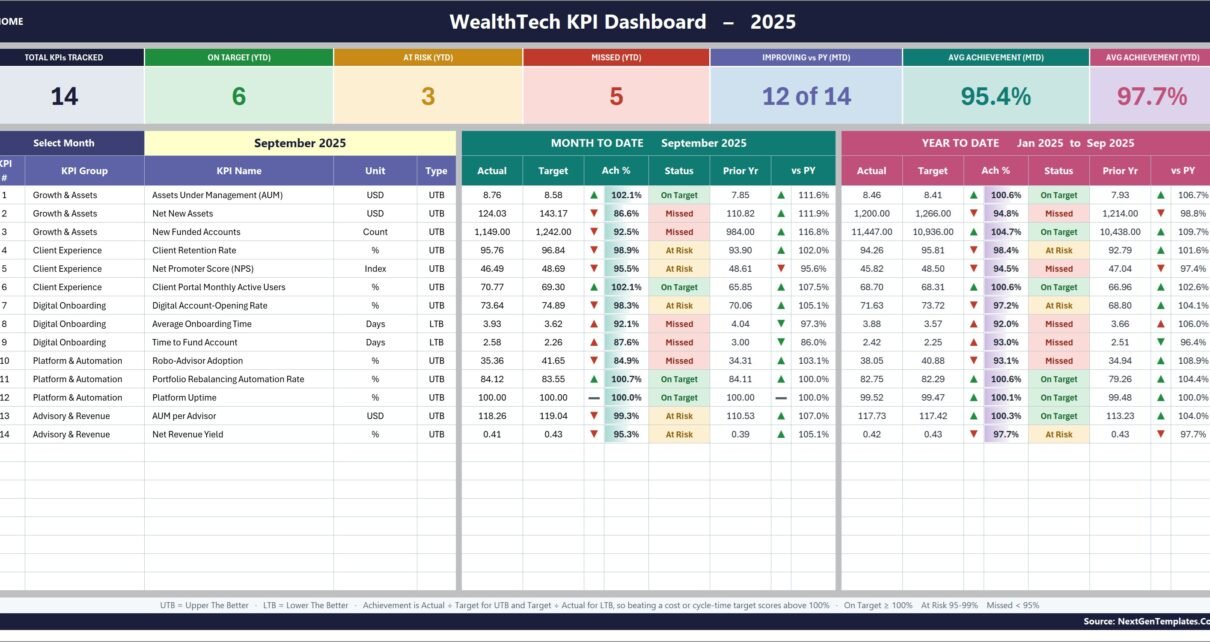
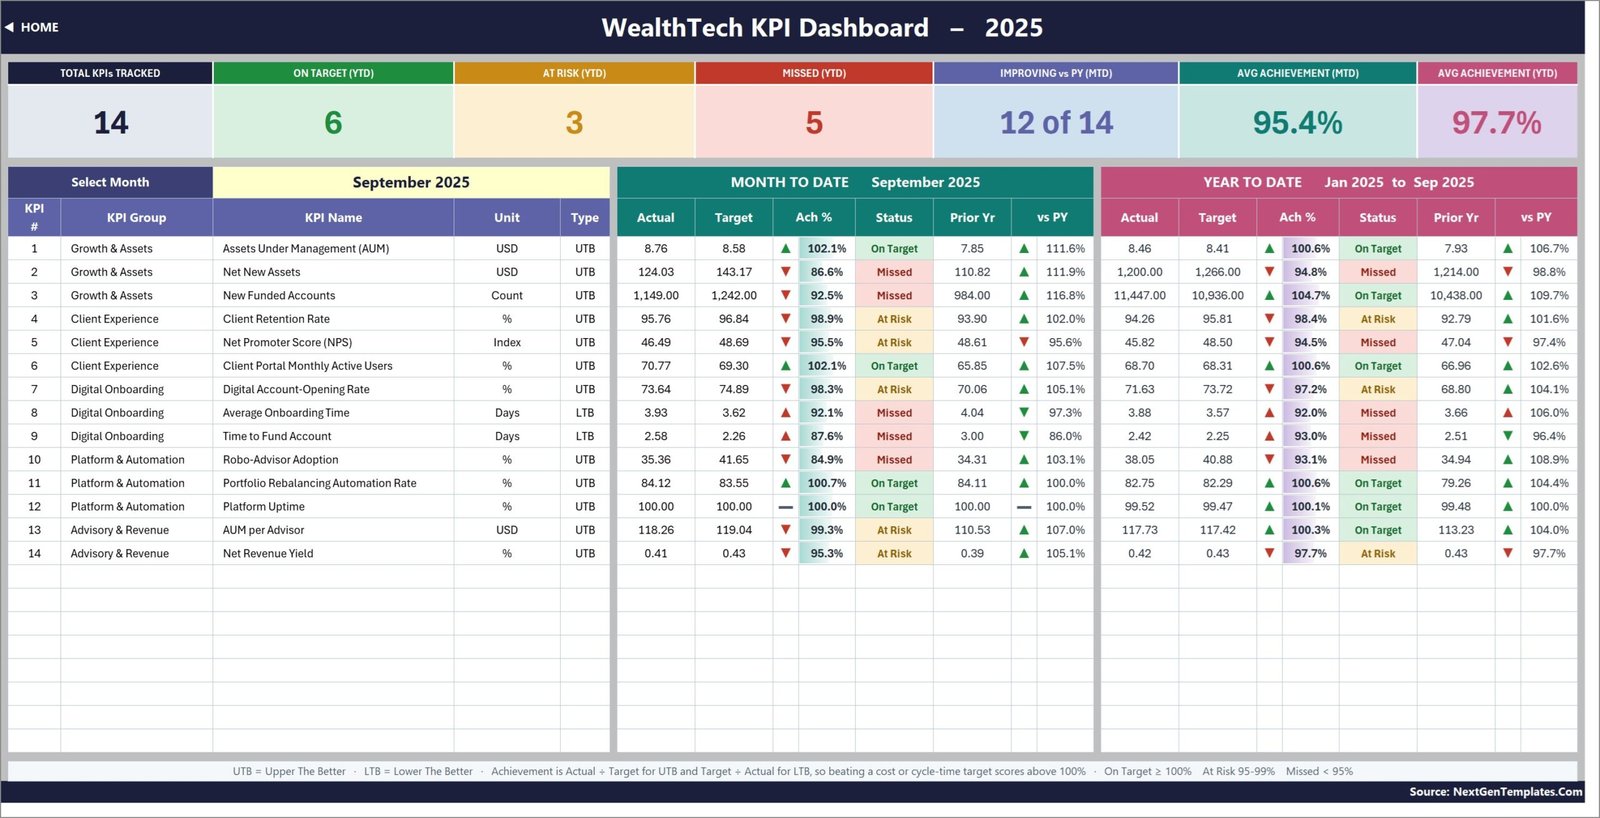
The main page displays all 14 KPIs for the selected month. The September 2025 sample shows six YTD KPIs On Target, three At Risk and five Missed, with MTD average achievement of 95.4% and YTD average achievement of 97.7%. These are demonstration figures, not benchmarks.
Each row identifies group, KPI, unit and UTB/LTB type, followed by MTD and YTD Actual, Target, Achievement, Status, Prior Year and comparison. The layout supports performance conversations without exposing client-level records.
KPI Trend
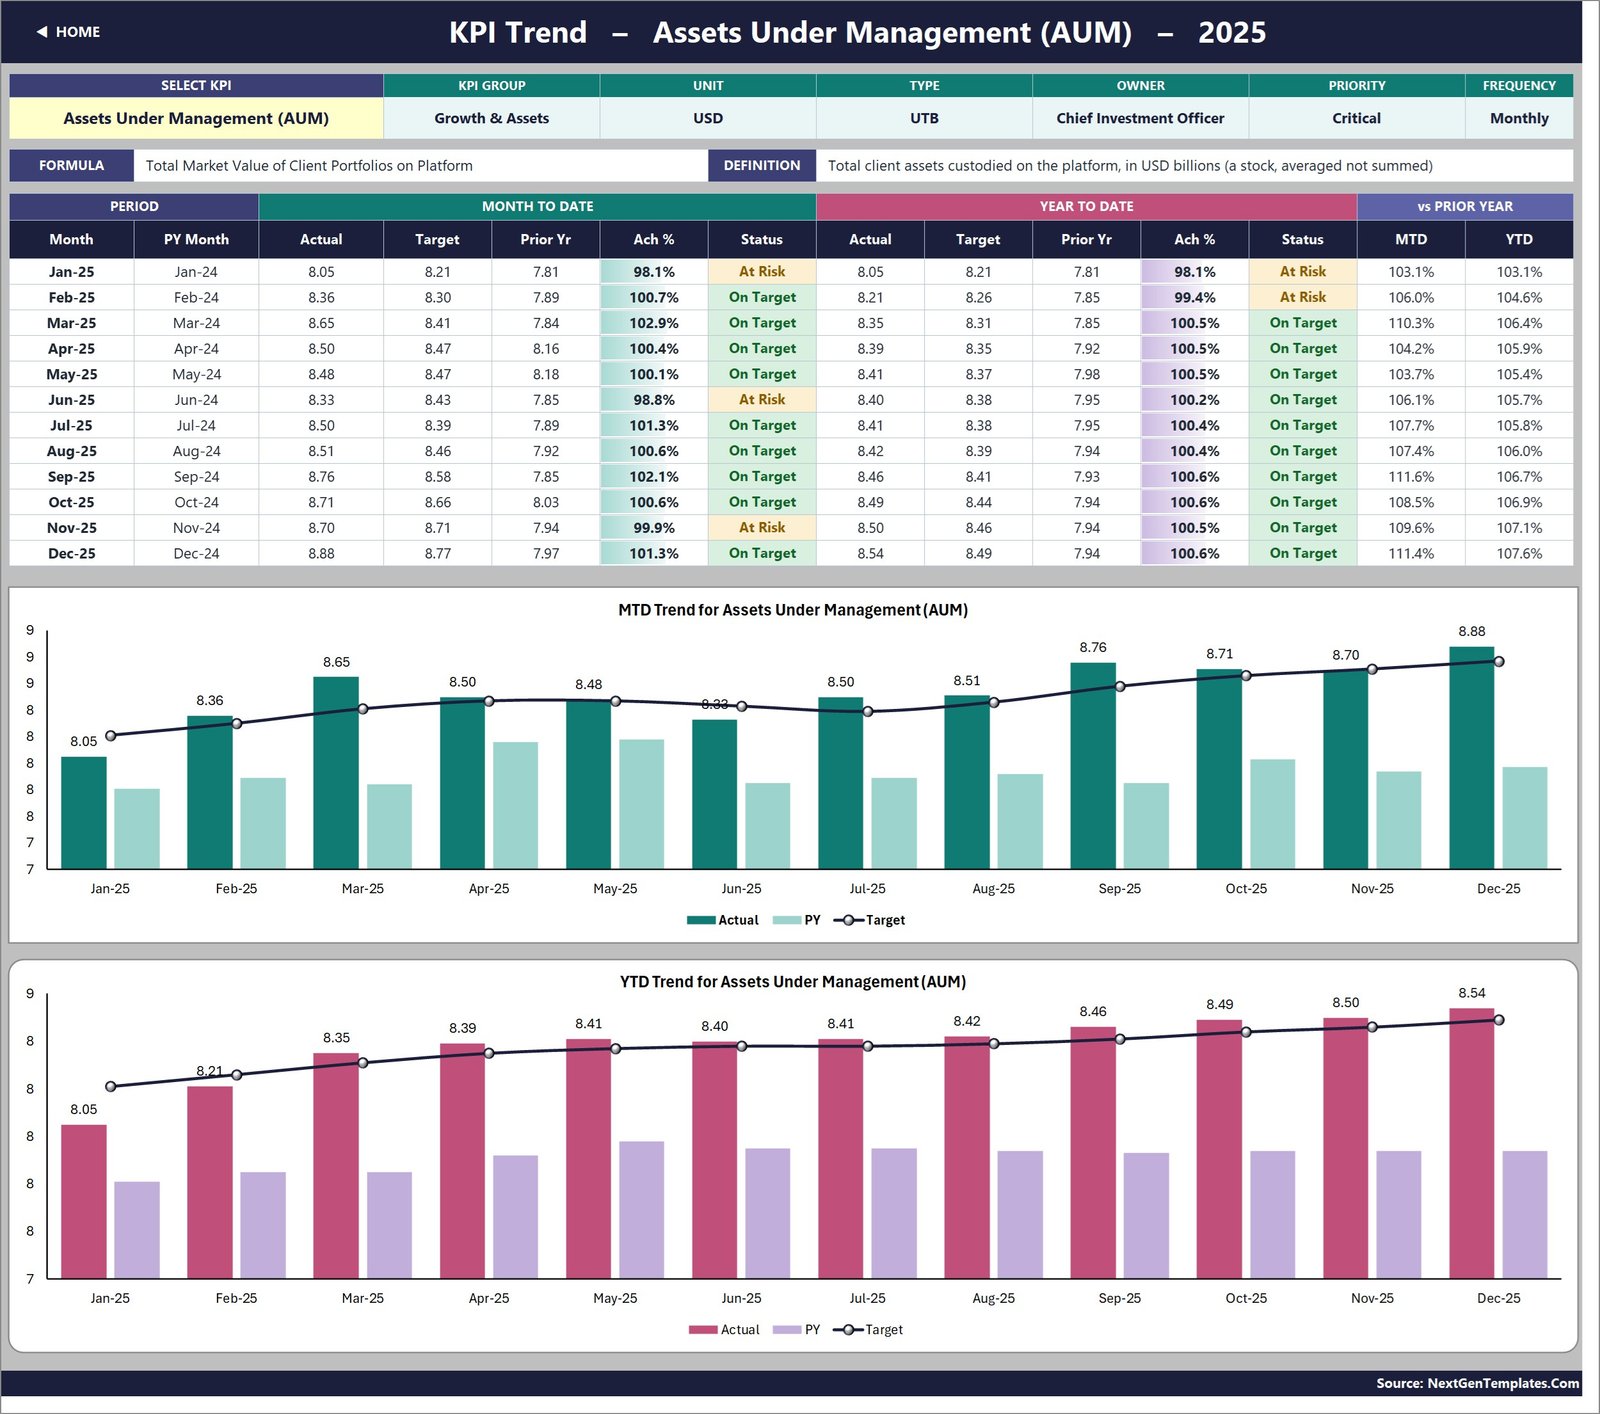
Select a KPI such as Assets Under Management (AUM) to see its group, unit, type, owner, priority, frequency, formula description and definition. A 12-month table and two charts compare current Actual, Prior Year and Target for both MTD and YTD.
KPI Analysis
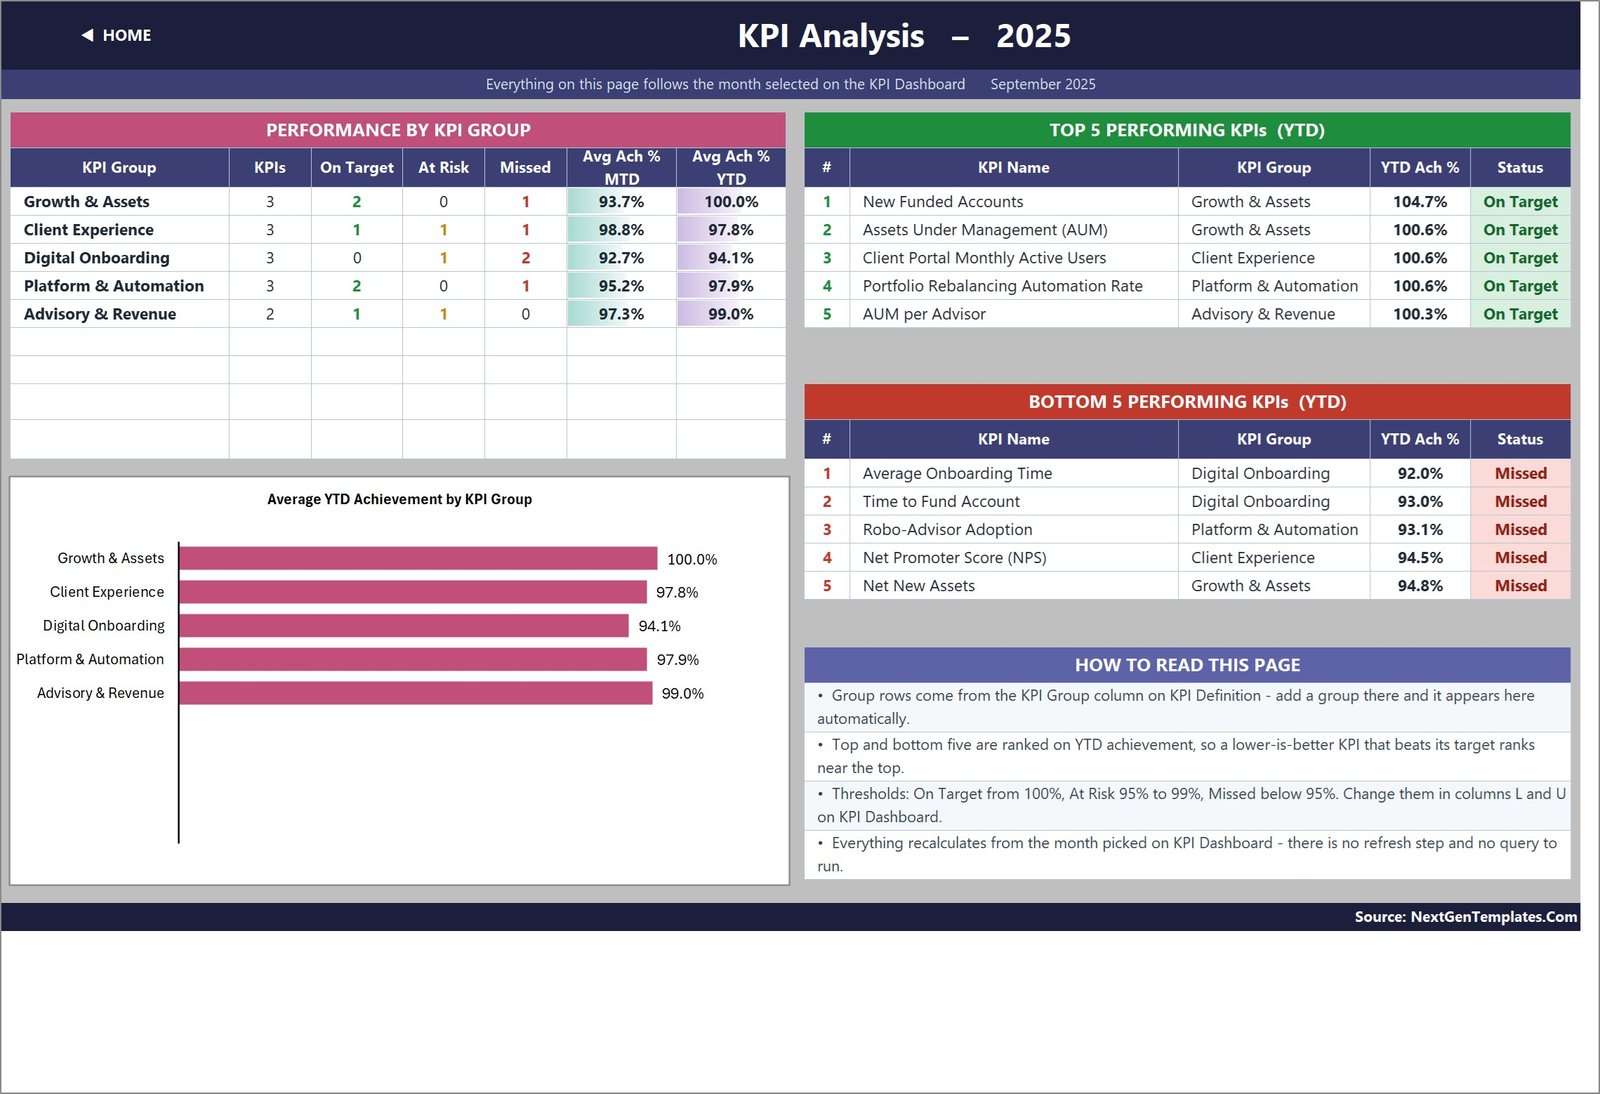
This page aggregates the 14 rows into five KPI groups, showing counts by status and average achievement. It then ranks the top and bottom five YTD metrics. Because the ranking uses achievement, a Lower the Better KPI can rank highly when it beats its target.
Actual Values – Current Year
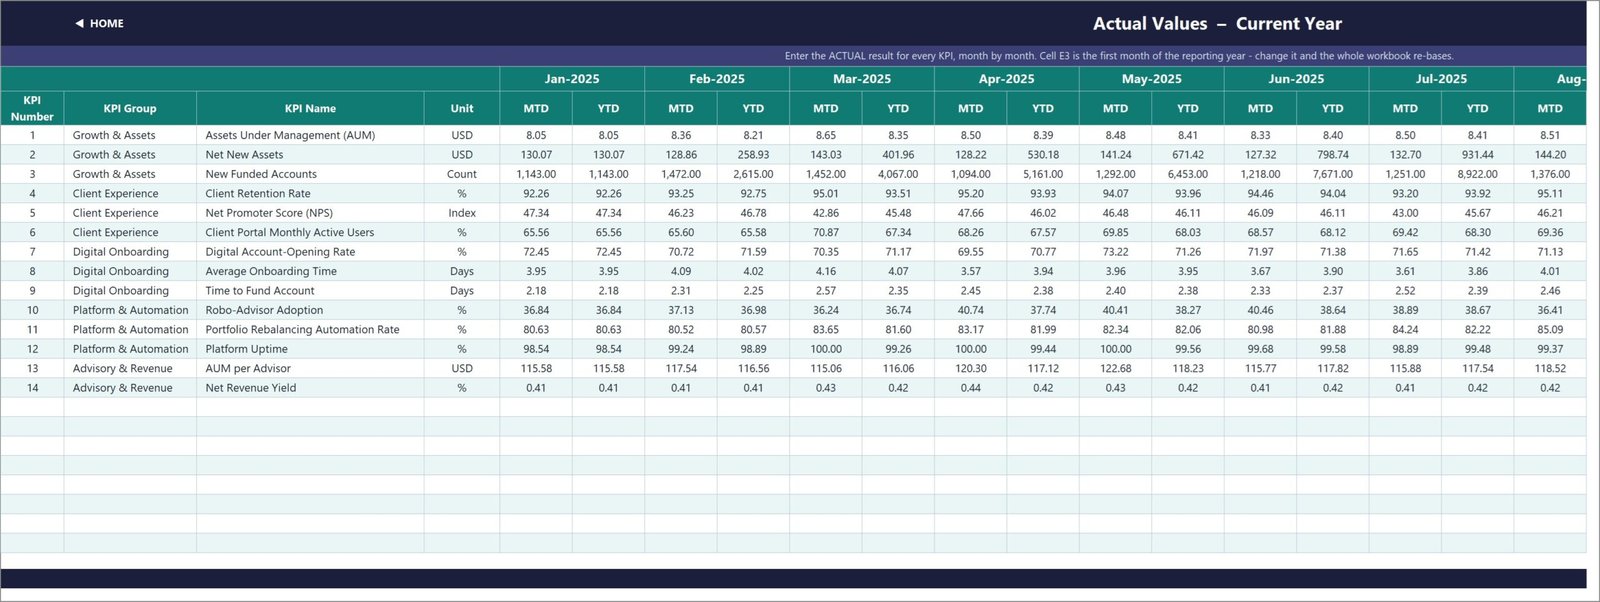
This is the first of the three sheets normally edited each month. Enter MTD and YTD actual values for each KPI. The first month on this sheet establishes the reporting year used throughout the workbook.
Target Values – Current Year
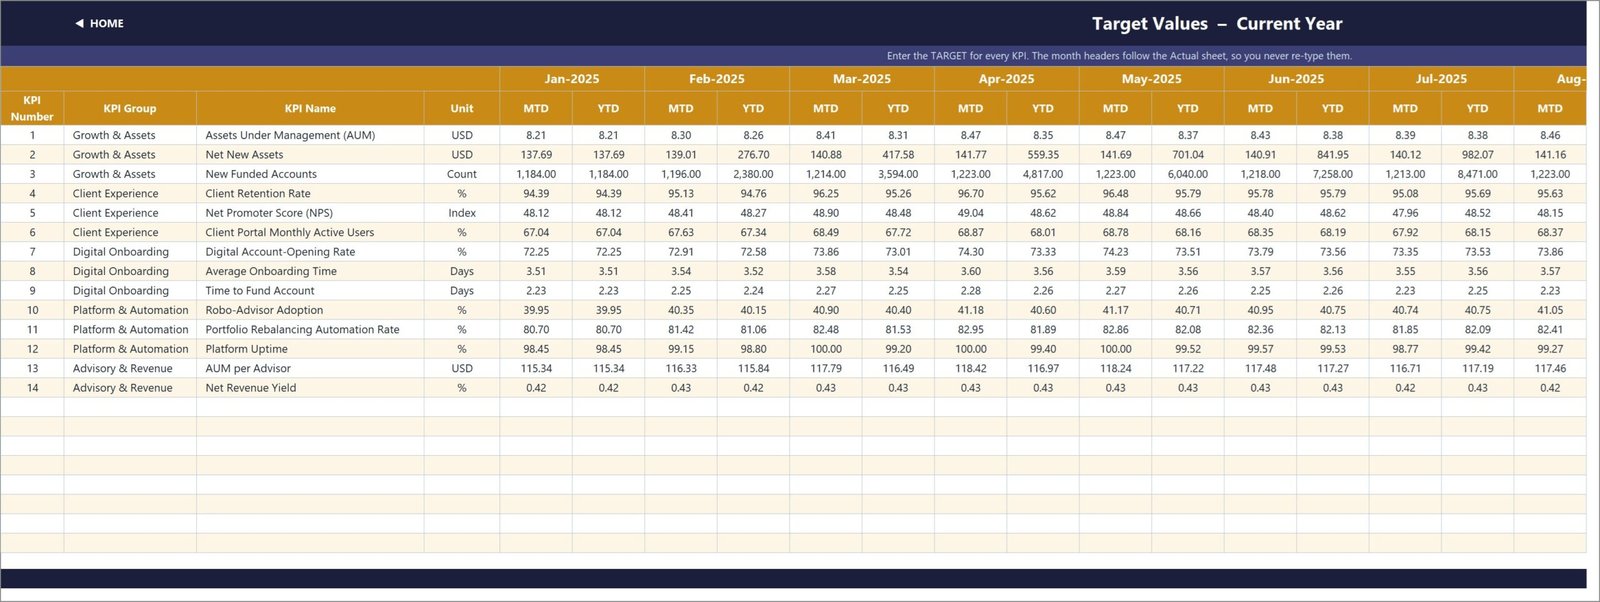
The Target sheet mirrors the KPI list and monthly structure. Targets feed the Achievement % calculations, status labels and target series in the trend charts.
Prior Year Values
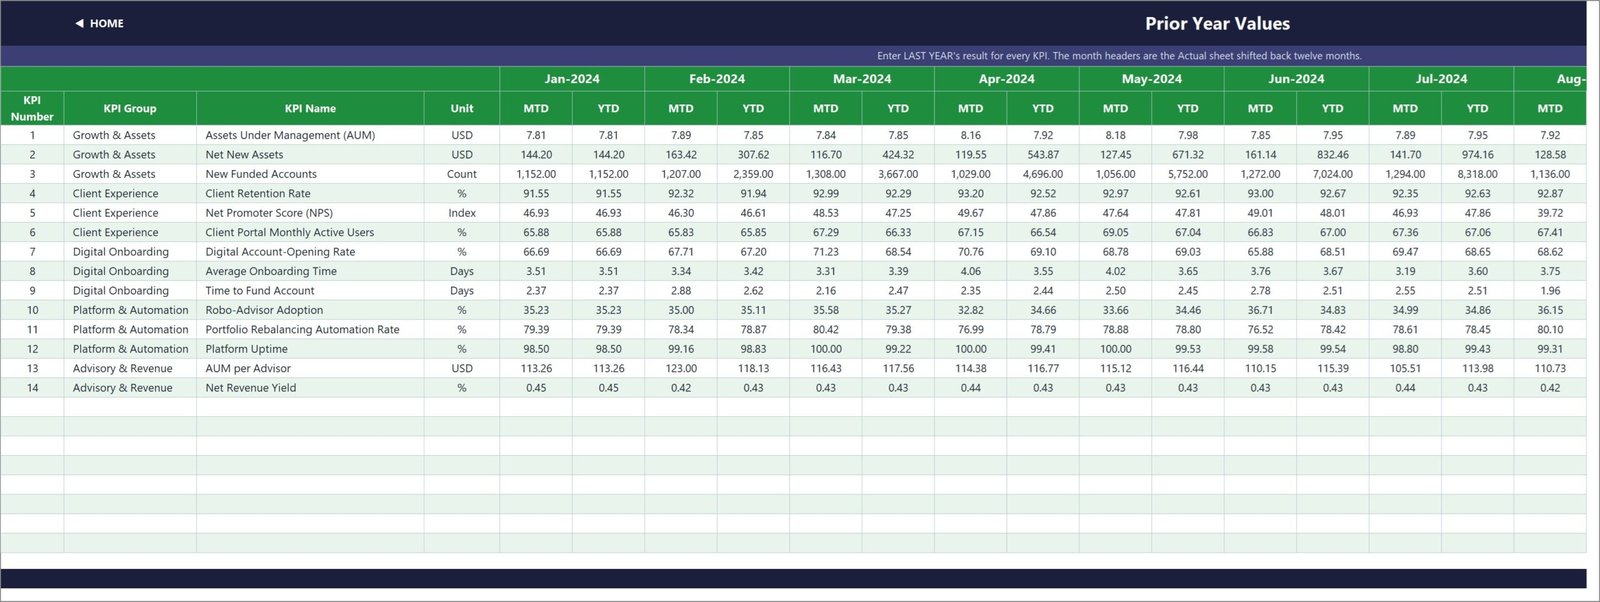
Enter the previous year’s MTD and YTD values here. The workbook uses them for year-over-year arrows, percentages and the prior-year series on KPI Trend.
KPI Definition – Master List
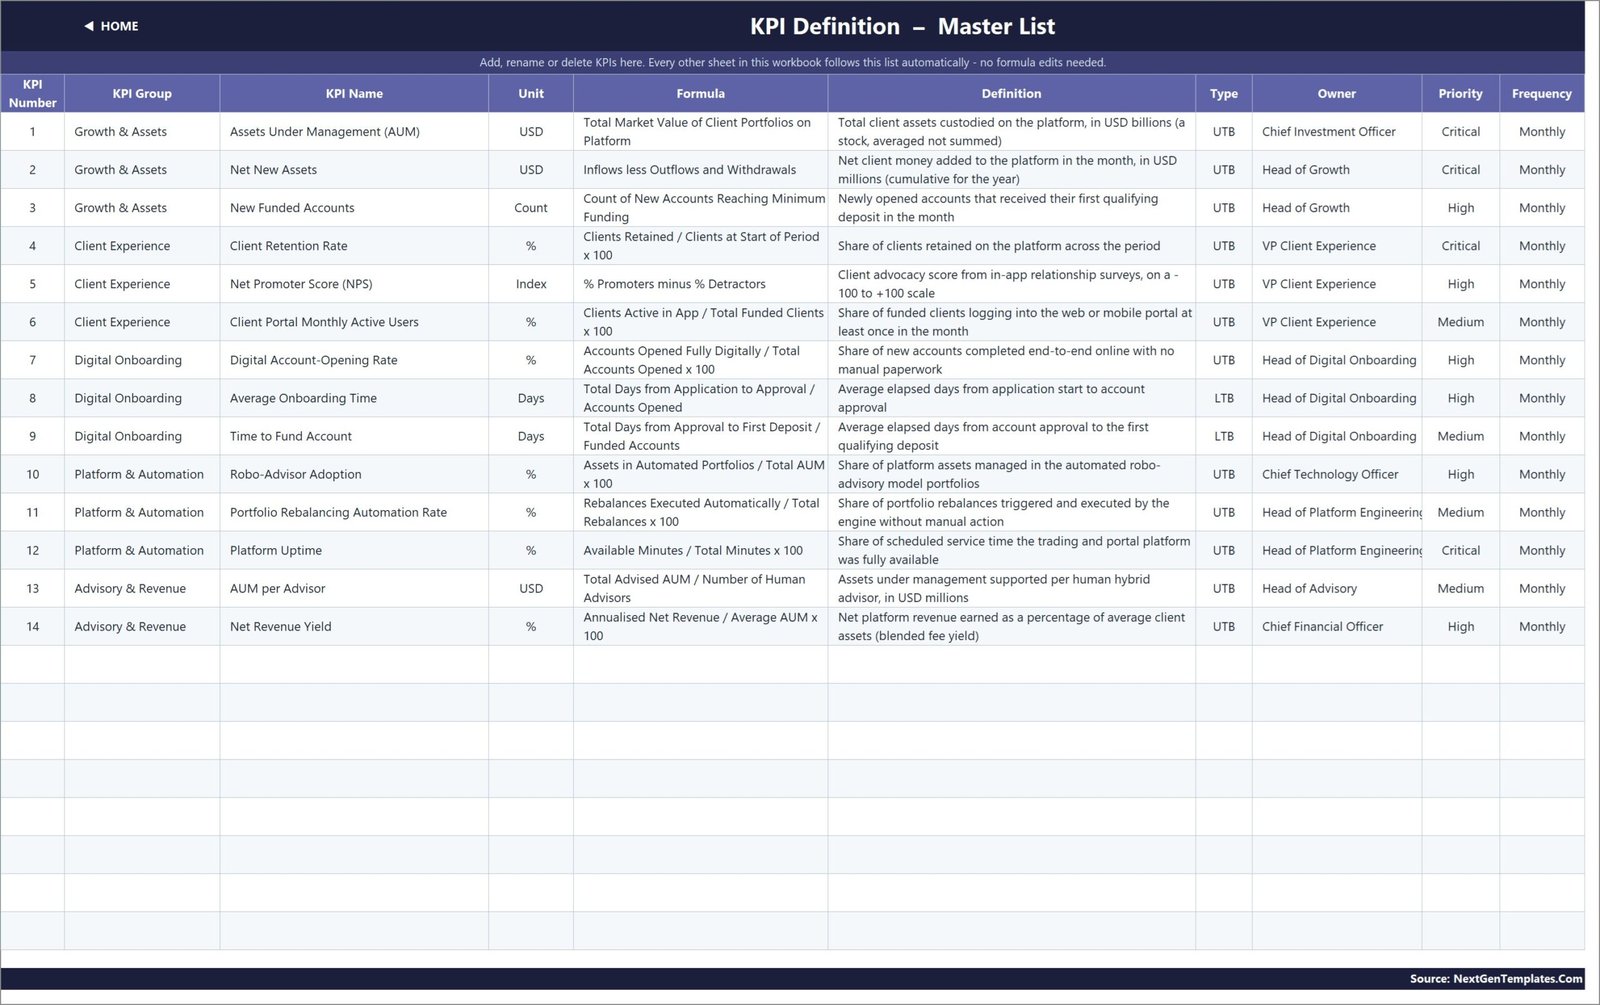
The master list holds KPI number, group, name, unit, formula description, definition, UTB/LTB type, owner, priority and frequency. The sample pack includes AUM, Net New Assets, New Funded Accounts, Client Retention Rate, NPS, Portal Monthly Active Users, Digital Account-Opening Rate, onboarding measures, automation measures, uptime, AUM per Advisor and Net Revenue Yield.
These labels and formulas are examples. Your finance, risk, legal and compliance teams should approve the definitions used in your organization.
Read Me – How the Workbook Is Built
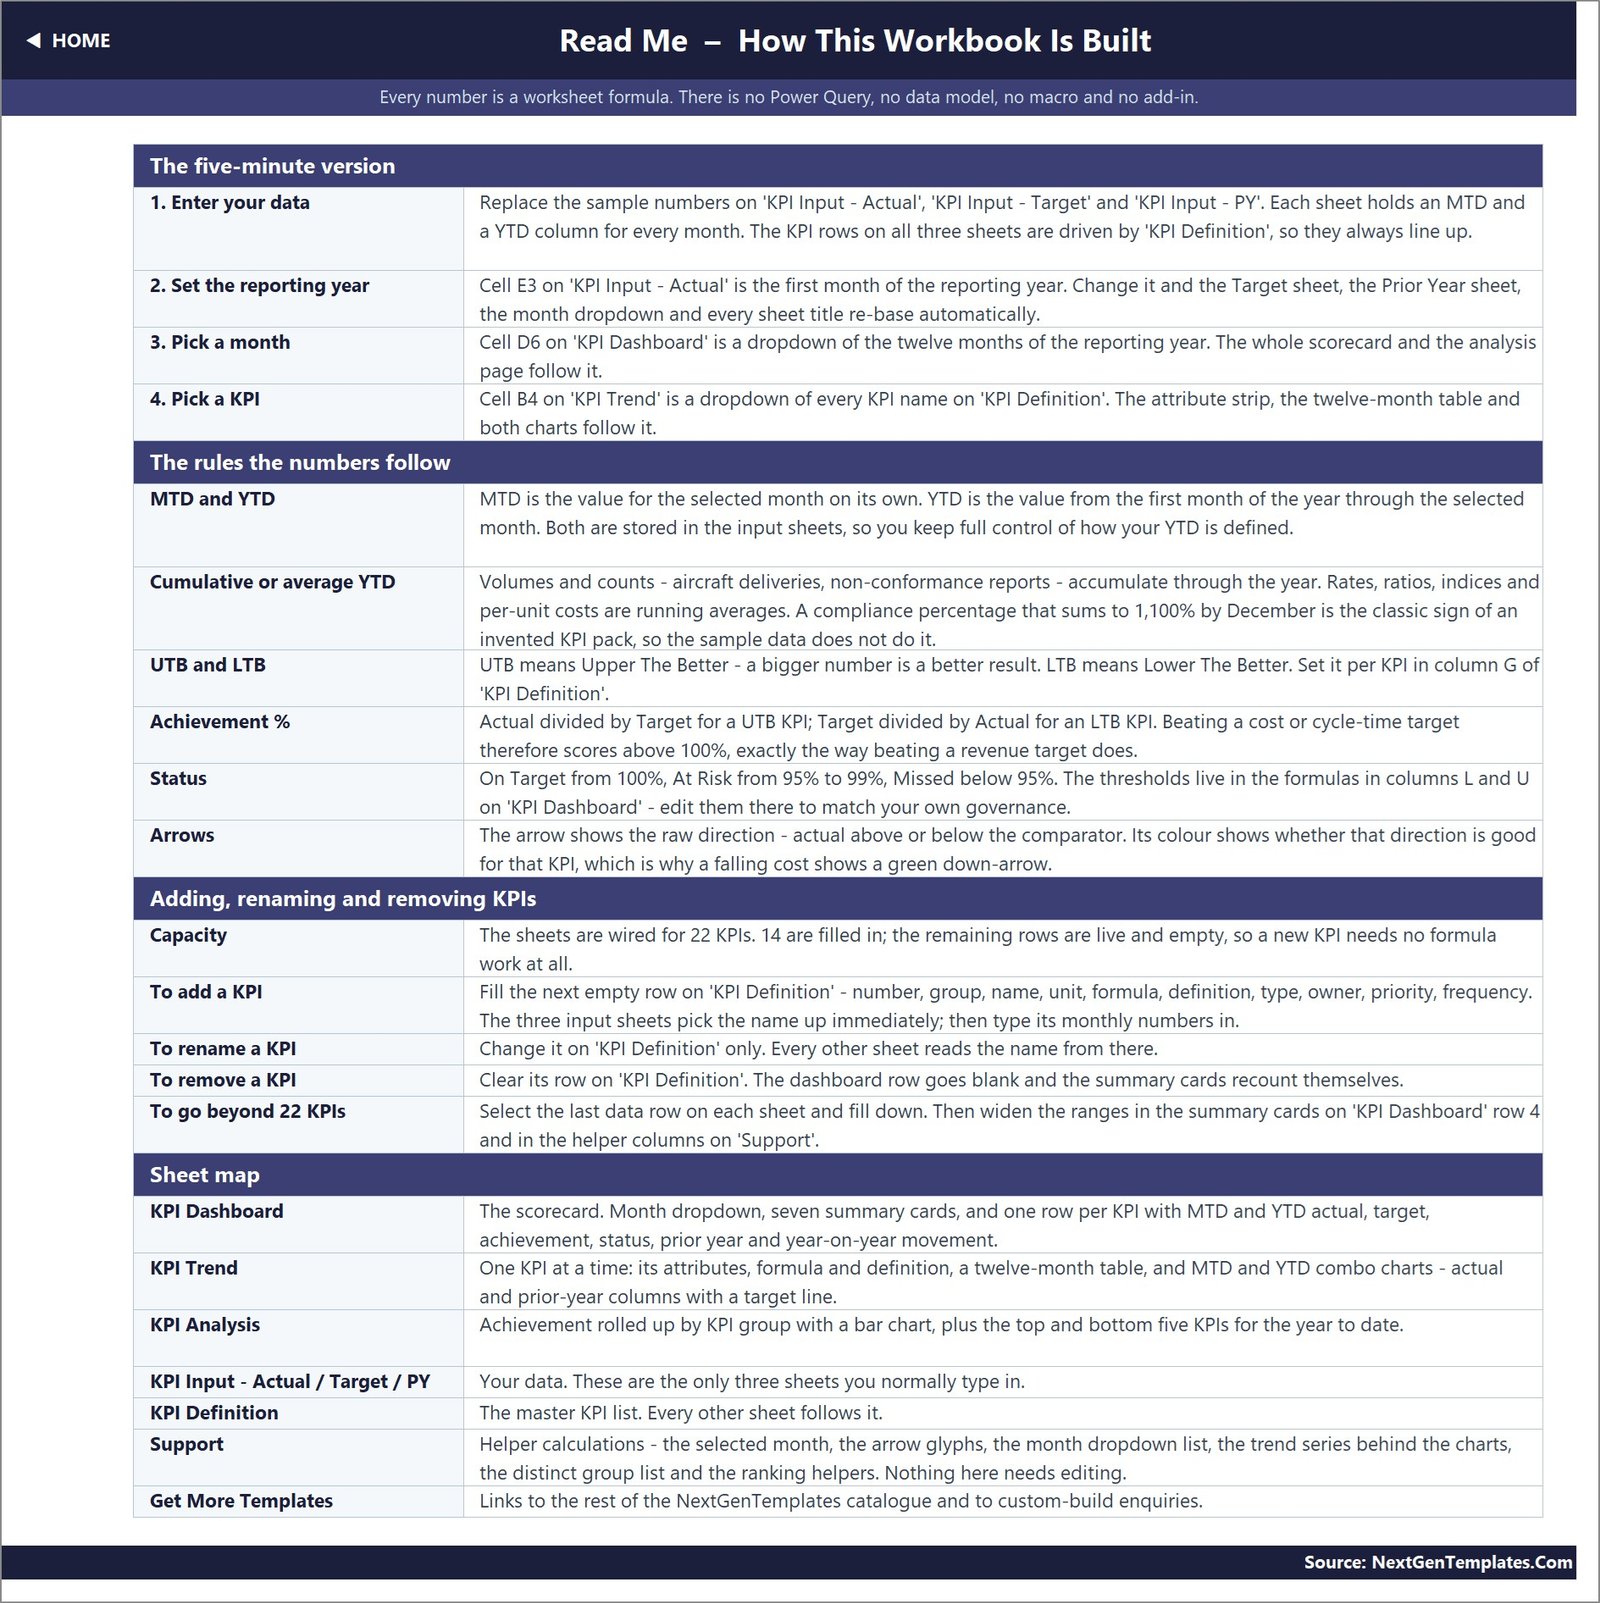
The Read Me explains the four-step setup, MTD/YTD treatment, UTB/LTB rules, achievement thresholds, arrows, row capacity and sheet map. One generic explanatory sentence still uses aircraft deliveries and non-conformance reports as examples; replace those words with domain-specific examples if you customize the guide.
Get More Templates
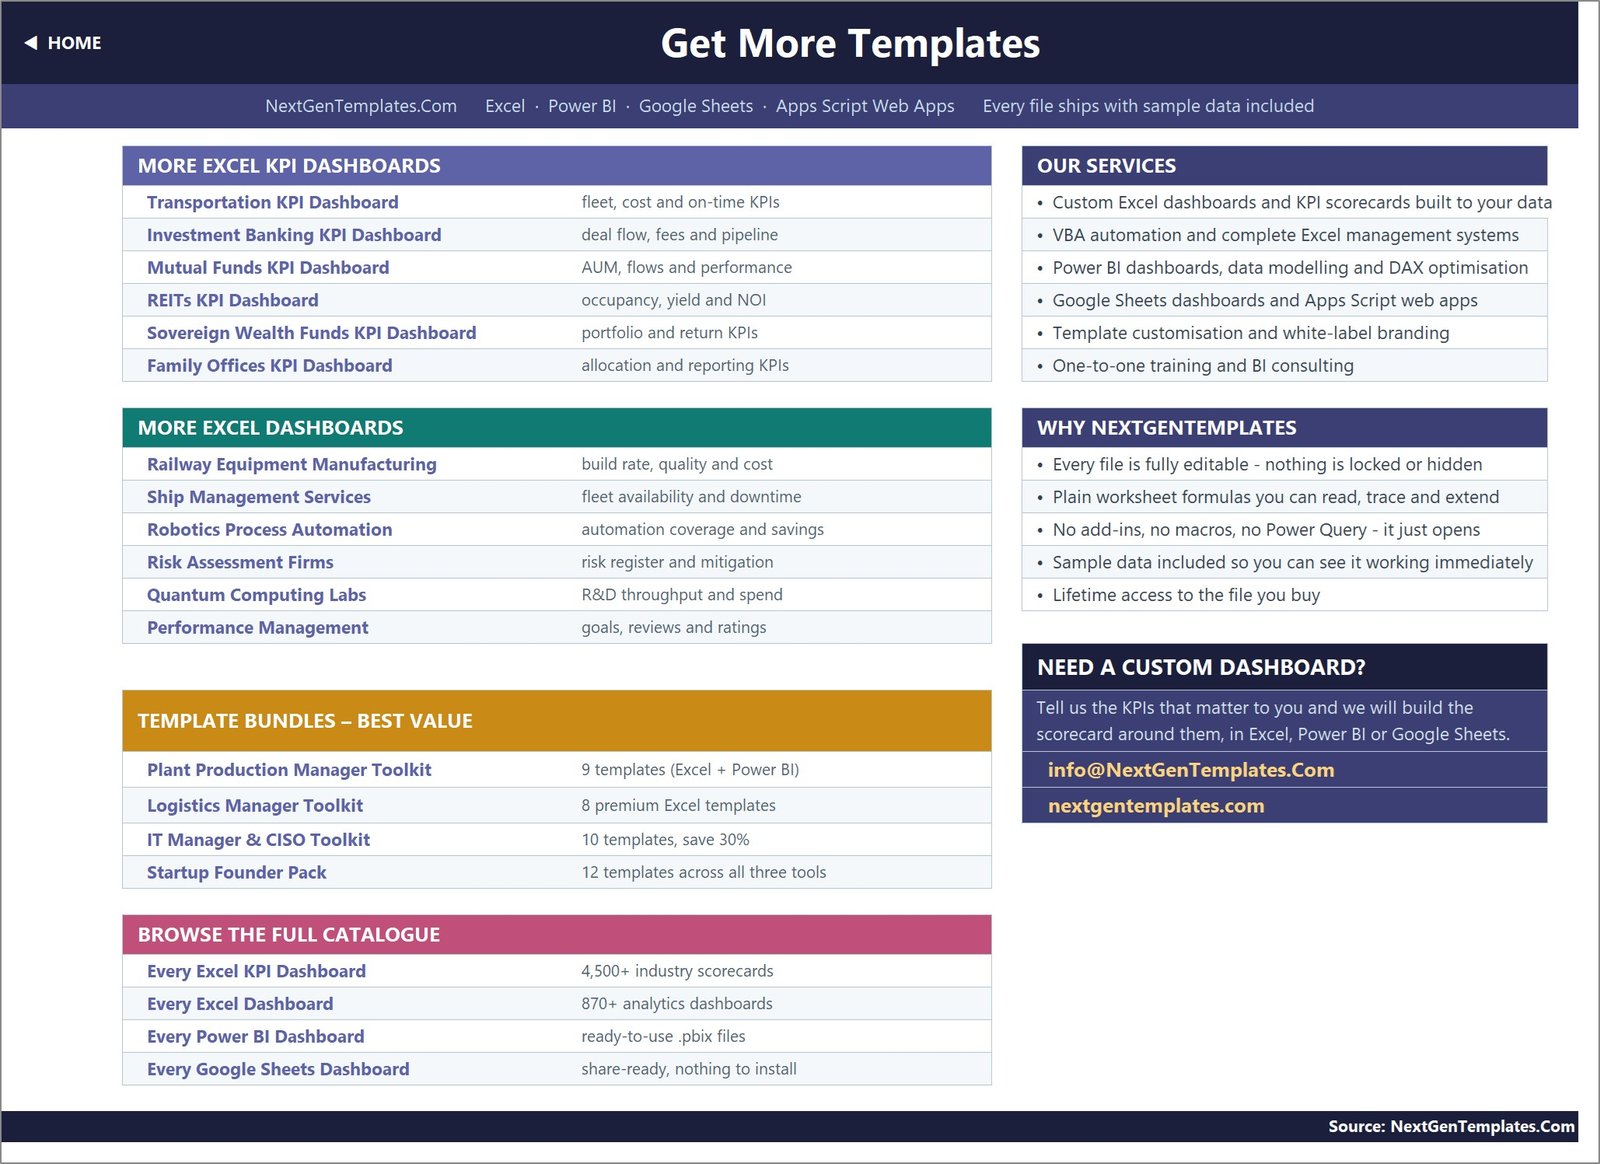
The final worksheet points to related Excel KPI dashboards, analytical dashboards, service options and the wider catalogue. It is a navigation page, not part of KPI calculations.
WealthTech KPI Dashboard in Excel vs. Google Sheets vs. Paid Wealth Management SaaS – Feature Comparison
| Consideration | Excel template | Google Sheets alternative | Paid WealthTech SaaS |
|---|---|---|---|
| Cost | $12.99 sale price, one time | Manual build or migration | Recurring vendor pricing |
| Platform | Microsoft Excel | Browser spreadsheet | Vendor-hosted system |
| Setup | Replace sample definitions and values | Build formulas, rules and charts | Implementation and data mapping |
| Collaboration | OneDrive or SharePoint sharing | Native link sharing | Role-based workflows may be included |
| Mobile access | Excel app, with desktop preferred for editing | Browser/app | Vendor dependent |
| Custom fields | Editable KPI master list | Editable if built | Vendor dependent |
| Live integrations | No | No unless separately built | May connect to source systems |
| Year-1 cost at 5 users | $12.99 for the file | Plan cost plus build time | Vendor quote |
| Portfolio accounting and trading | No | No | May be offered by specialized platforms |
The Excel template fits teams that possess approved summary values and want a transparent, editable scorecard. A dedicated platform is more appropriate when live integrations, transaction processing, client portals, permissions, audit trails or regulatory workflows are required.
Who Should Use This Template
It is suitable for WealthTech operations managers, product leaders, digital onboarding teams, client-experience analysts, advisory operations, platform engineering leaders and finance teams. It can also help founders of early-stage financial technology firms standardize a monthly operating review before investing in a larger reporting stack.
It is not designed for investment recommendations, securities selection, client suitability, risk modelling, live valuation, return attribution, NAV calculation, fee billing, order management, custody reconciliation or filings. A spreadsheet status indicator does not prove compliance with SEC, FINRA, FCA, MiFID II, SEBI or another regulatory framework.
Real-World Use Cases
Digital onboarding review
Maya monitors digital account-opening rate, average onboarding time and time to fund. She uses MTD status to spot the current issue and YTD ranking to see whether it is persistent.
Platform operations review
Daniel loads validated uptime and automation-adoption summaries from approved systems. He uses the group roll-up to discuss performance while retaining the source-of-truth records elsewhere.
Client-experience reporting
Priya combines retention, NPS and monthly active-user summaries. The scorecard gives management a consistent view without importing personal client data into the workbook.
Advantages of the WealthTech KPI Dashboard in Excel
The strongest advantage is transparency. KPI definitions, input values and formulas remain visible in Excel. Teams can rename the sample measures, revise targets, change owners and tailor the reporting year without a vendor implementation.
The split between input, scorecard, trend and analysis pages also creates a repeatable review rhythm. The product is the KPI scorecard family, which differs from the separate analytical Wealth Tech Dashboard in Excel: this workbook focuses on target achievement and monthly governance, while the analytical dashboard is better for dimensional breakdowns.
Opportunities for Improvement
- Automated data import: the current workbook requires manual summary entry and has no broker, custodian, CRM, bank or market-data connection.
- Replace generic Read Me wording: one sentence refers to aircraft deliveries and non-conformance reports, which is unrelated to WealthTech.
- Extend beyond 22 KPIs: this requires filling down formulas and widening helper ranges, as explained in the Read Me.
- Add governance controls: organizations needing approvals, access control, audit logs or validation workflows should add them outside this workbook or use an appropriate system.
- Clarify units: define whether USD entries represent dollars, thousands, millions or billions and keep that convention consistent.
Best Practices
- Approve every KPI name, formula, unit, owner and UTB/LTB classification before loading results.
- Document the source system and cut-off date outside the workbook for each monthly refresh.
- Reconcile summarized inputs to approved source reports and retain the reconciliation evidence separately.
- Lock formula cells and limit editing to the master list and three input sheets if multiple people use the file.
- Test a new month against hand calculations before circulating management results.
- Keep client-identifiable and transaction-level data out of the workbook unless your security and privacy controls explicitly allow it.
Explore Relevant Templates
- Wealth Tech Dashboard in Excel – the analytical companion for broader breakdowns.
- Investment Banking KPI Dashboard in Excel.
- Mutual Funds KPI Dashboard in Excel.
- Family Offices KPI Dashboard in Excel.
- Sovereign Wealth Funds Dashboard in Excel.
Frequently Asked Questions
Does the template connect to financial systems?
No. All KPI values are entered manually as summarized data.
Is this investment advice or a portfolio management system?
No. It does not recommend investments, calculate portfolio performance, place orders or maintain books and records.
How many KPIs are included?
There are 14 populated sample KPIs across five groups, with 22 live rows in the supplied structure.
Can I change the sample KPIs?
Yes. Update the KPI Definition sheet and load the matching monthly actual, target and prior-year values.
Does it require macros?
No. The workbook uses standard Excel formulas, dropdowns, conditional formatting and charts.
Can it prove financial-services compliance?
No. It has no control-testing, evidence-management or filing functionality. Obtain qualified legal and compliance advice for regulatory obligations.
What is included in the download?
The digital ZIP contains the Excel KPI dashboard workbook with sample data and the supporting workbook pages shown above.
About the Author
Built by PK – Microsoft Certified Professional with 15+ years of Excel, Google Sheets, and Power BI experience. Founder of NextGenTemplates, reaching 300K+ subscribers across YouTube channels. Every template is hand-built and tested before release.
Conclusion
The WealthTech KPI Dashboard in Excel provides a clear monthly scorecard for 14 sample measures, 5 groups, 12 months and three comparison bases. Its value is a transparent reporting structure, not live financial-system capability. Replace the examples with approved definitions, validate every input, and use it as one layer in your management reporting process.
Get the WealthTech KPI Dashboard in Excel for a one-time sale price of $12.99.
For more Excel tutorials, visit YouTube.com/@PKAnExcelExpert.
Last updated: August 18, 2026.