New: NextGenTemplates Academy - video courses on Excel formulas with AI and Pivot Tables & dashboards. Early-bird: 20% off with code EARLYBIRD20 - first 20 orders only.See the courses →
PKComments Off on Robo-Advisors KPI Dashboard in Excel
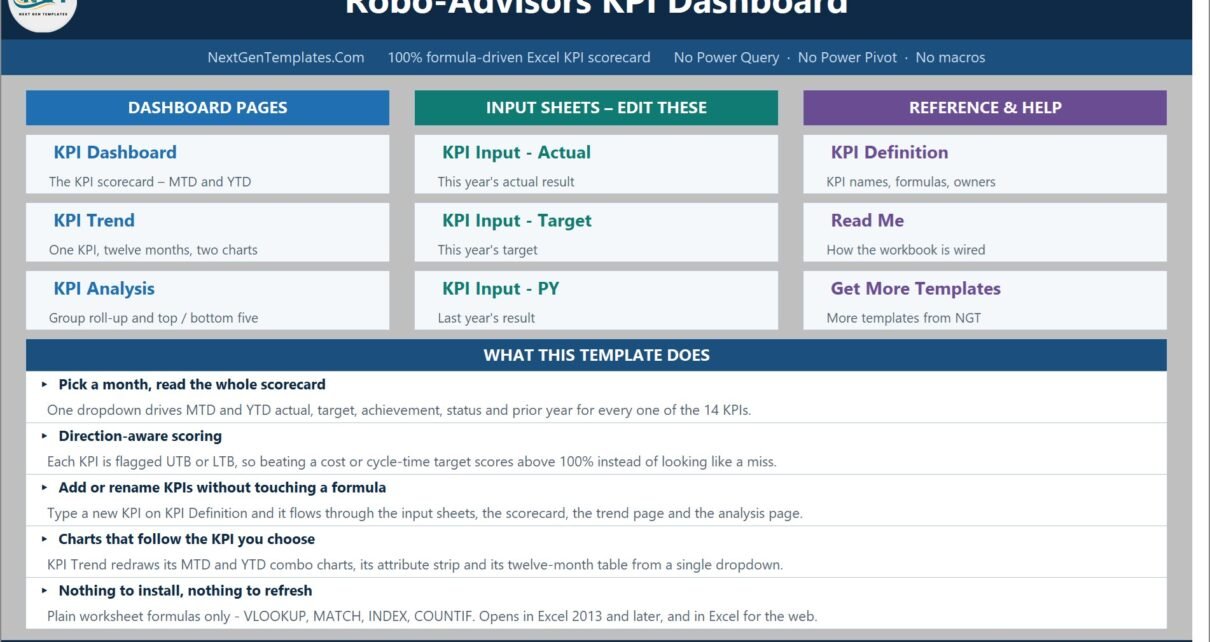
Running a digital advice business means answering the same question every month: did we hit target, and are we better or worse than last year? The Robo-Advisors KPI Dashboard in
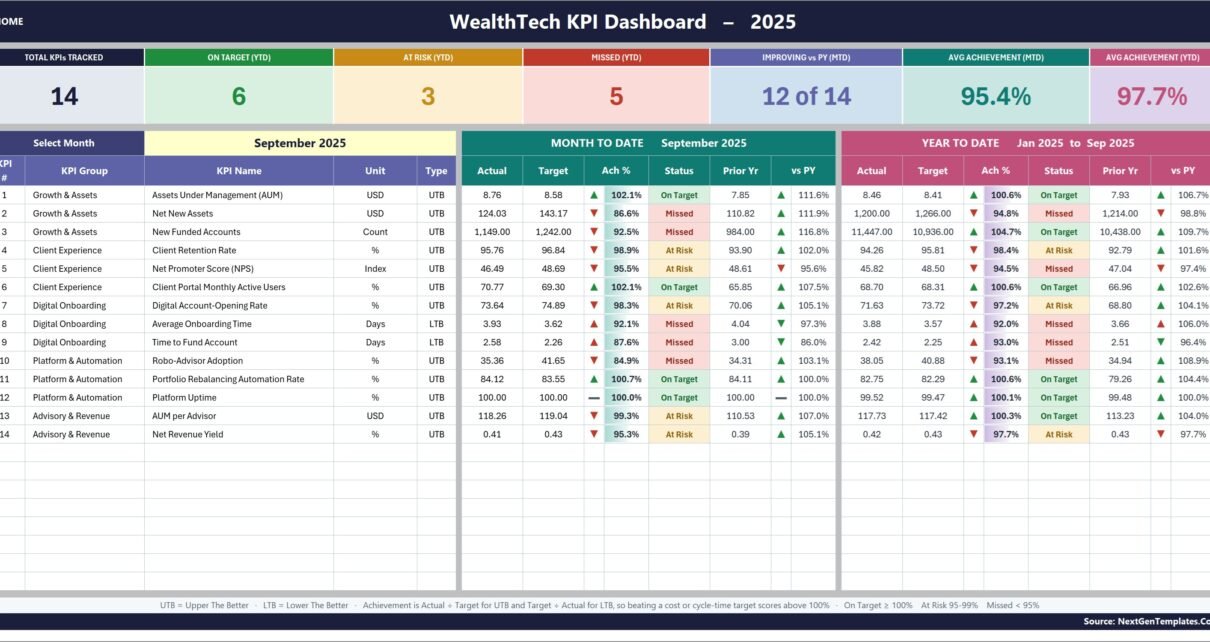
The WealthTech KPI Dashboard in Excel organizes 14 sample indicators across 5 management groups and 12 months. In one workbook, teams can compare MTD and YTD actuals with targets and
PKComments Off on Wealth Management KPI Dashboard in Power BI
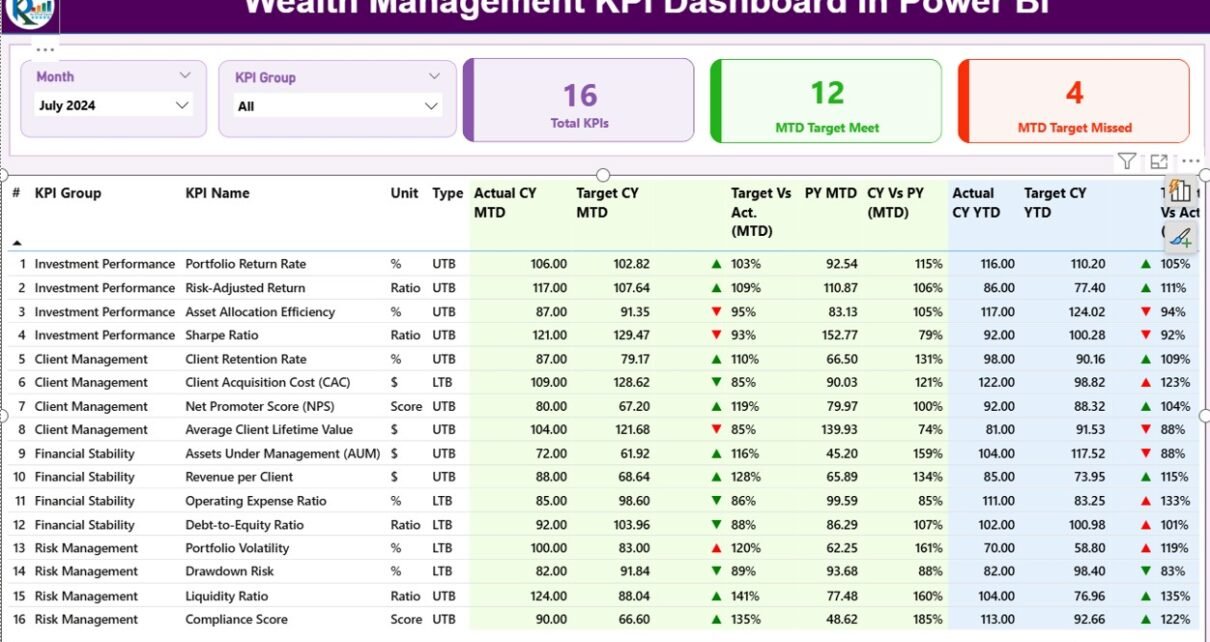
A Wealth Management KPI Dashboard in Power BI is a ready-to-use, interactive performance monitoring tool designed specifically for wealth managers, investment firms, private banks, and financial advisors. It helps decision-makers
PKComments Off on Wealth Management Dashboard in Power BI
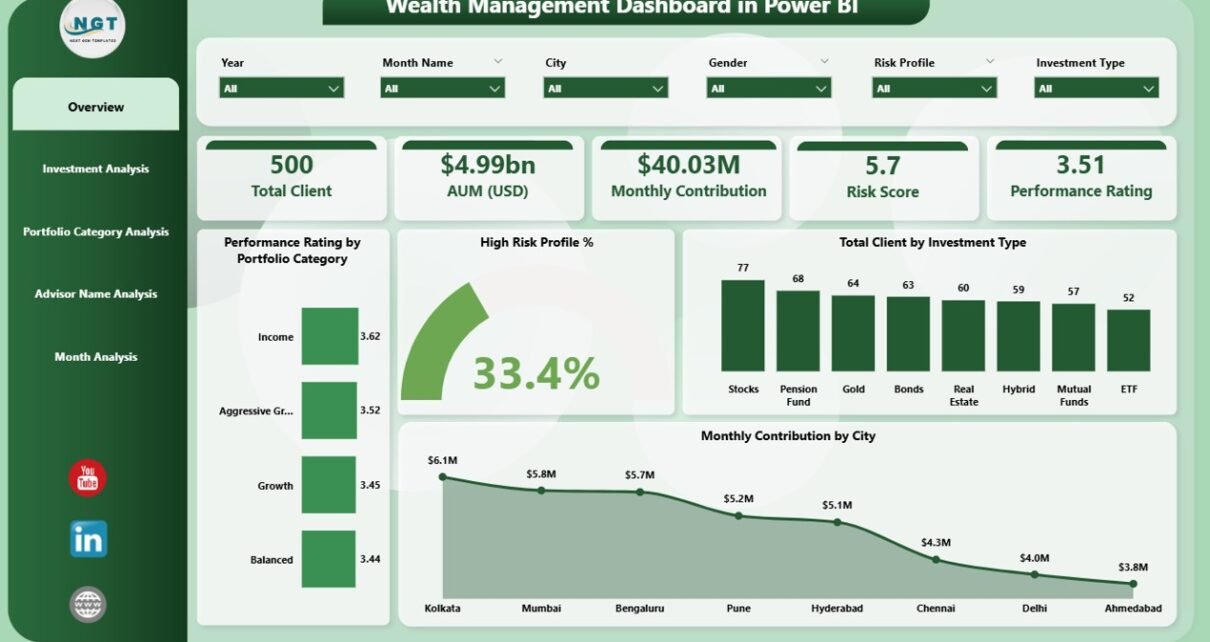
Wealth management teams handle large amounts of financial data every day. They track investments, clients, portfolios, and monthly trends to make better decisions. Because the financial world changes quickly, analysts