Running a digital advice business means answering the same question every month: did we hit target, and are we better or worse than last year? The Robo-Advisors KPI Dashboard in Excel is built to answer exactly that – a monthly KPI scorecard that sits on top of whatever platform you already run.
You type this month’s actual, target and prior-year numbers into three input sheets. One dropdown on the scorecard then drives everything: MTD and YTD actual, target, achievement percentage, traffic-light status, prior year and year-on-year movement for all 13 KPIs, plus a single-KPI trend page and a group roll-up page.
One thing to be clear about before anything else. This is the KPI scorecard line – month picker, traffic lights, a KPI Trend page and a KPI Analysis page. It is not the analytical Excel Dashboard line with slicers, pivot charts and transaction-level drilldown. Those are different products that answer different questions, and there is a comparison table further down to help you pick.
The Scorecard Page
This is where you will spend most of your time. Pick a month in cell D6 and the entire page re-reads from the input sheets.
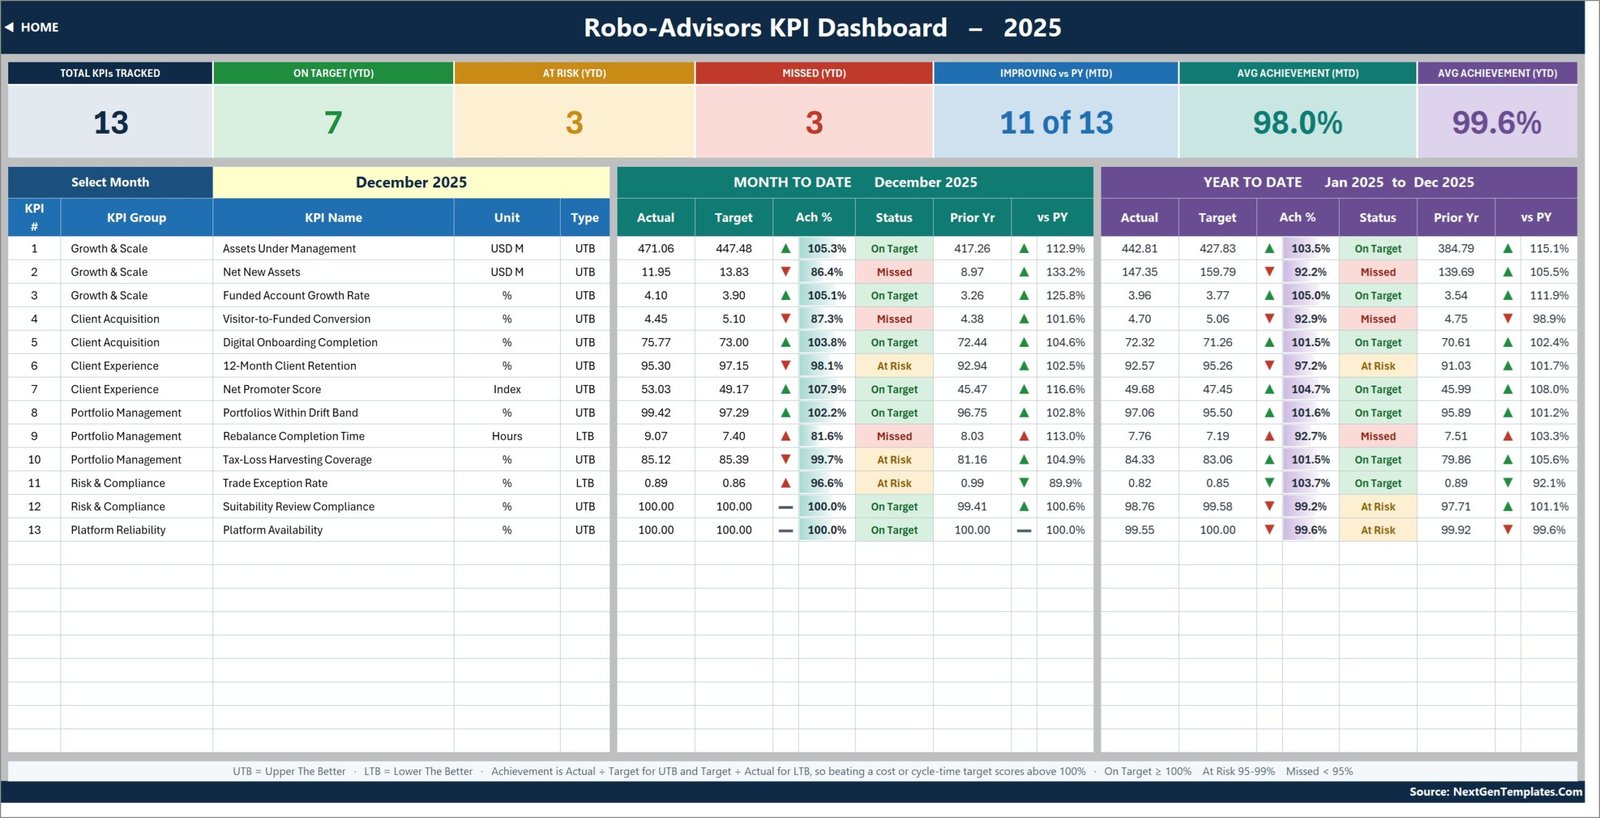
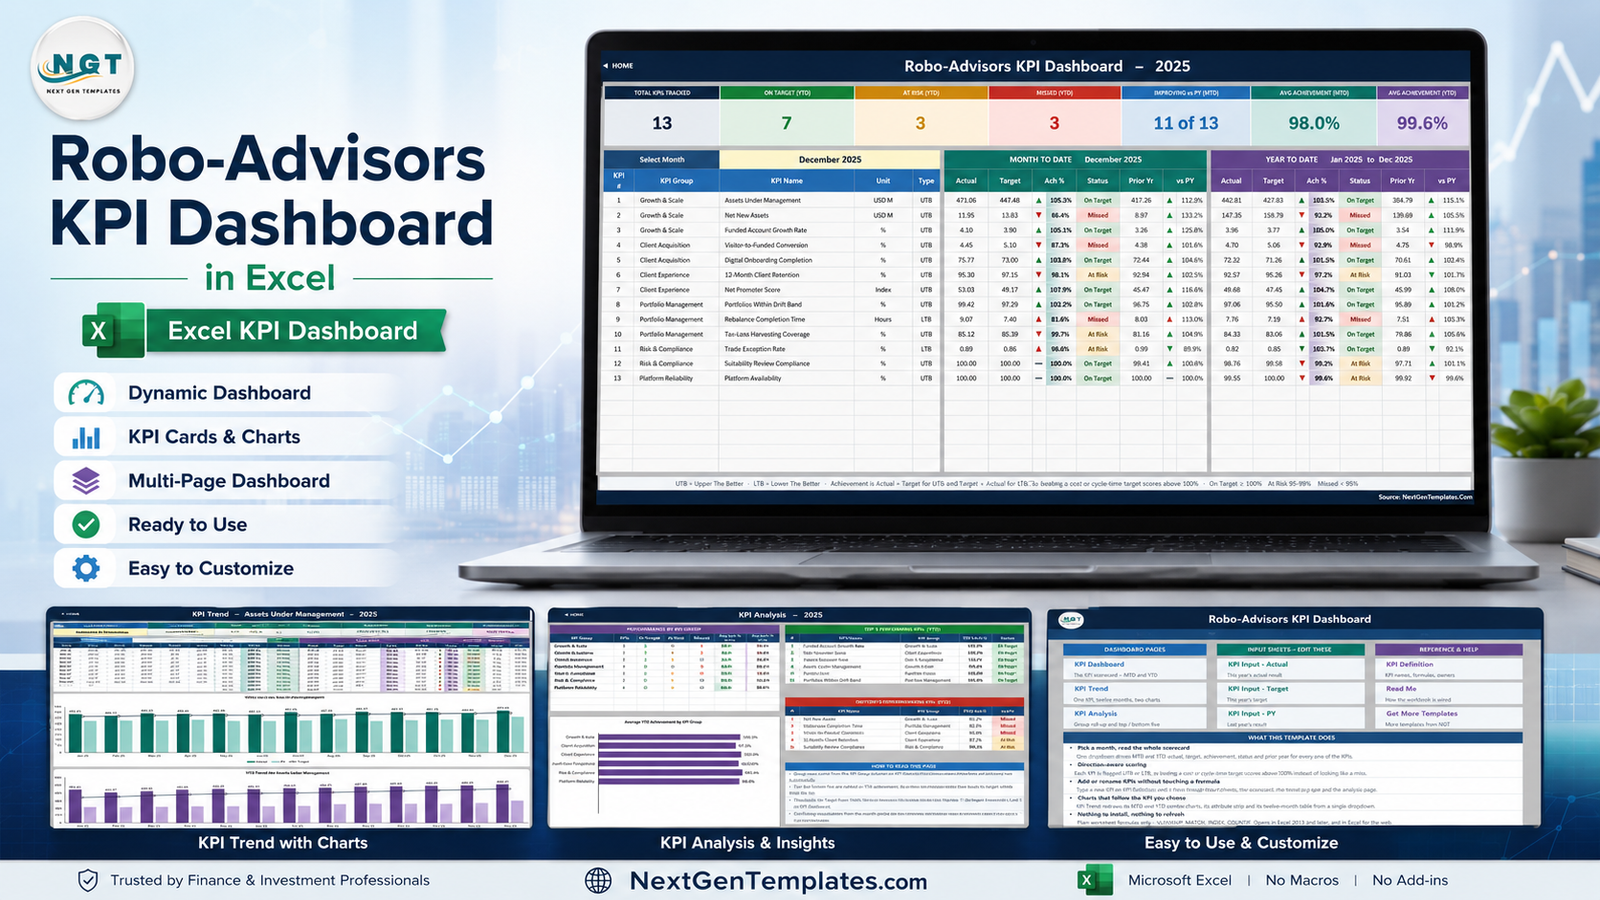
Seven summary cards run across the top – Total KPIs Tracked, On Target (YTD), At Risk (YTD), Missed (YTD), Improving vs PY (MTD), Avg Achievement (MTD) and Avg Achievement (YTD). In the sample data shipped with the file, December 2025 shows 13 KPIs tracked, 7 On Target, 3 At Risk, 3 Missed, 11 of 13 improving against prior year, and average achievement of 98.0% MTD against 99.6% YTD.
Below the cards, every KPI gets one row with two blocks side by side: a Month to Date block and a Year to Date block. Each block shows Actual, Target, Achievement %, Status, Prior Yr and vs PY. The arrows show raw direction against the comparator, and their colour shows whether that direction is good for that particular KPI – which is why a falling cycle time can show a green down-arrow.
Direction-Aware Scoring, So Cost KPIs Are Not Punished
Every KPI is flagged UTB (Upper The Better) or LTB (Lower The Better) on the definition sheet. Achievement is calculated as Actual / Target for a UTB KPI and Target / Actual for an LTB KPI.
That single detail is what makes the scorecard honest. Rebalance Completion Time and Trade Exception Rate are both lower-is-better here, so beating those targets scores above 100% exactly the way beating an AUM target does, instead of appearing as a miss on a page full of green.
Status bands are On Target from 100%, At Risk from 95% to 99%, and Missed below 95%. Those thresholds live in the formulas in columns L and U on the scorecard, so you can move them to match your own governance rather than ours.
The 13 KPIs In The File
The sample KPI set is a working robo-advisory pack across six groups. All of it is editable text – rename anything to your own vocabulary and the rest of the workbook follows.
| KPI Group | KPI | Unit | Direction |
|---|---|---|---|
| Growth & Scale | Assets Under Management | USD M | UTB |
| Growth & Scale | Net New Assets | USD M | UTB |
| Growth & Scale | Funded Account Growth Rate | % | UTB |
| Client Acquisition | Visitor-to-Funded Conversion | % | UTB |
| Client Acquisition | Digital Onboarding Completion | % | UTB |
| Client Experience | 12-Month Client Retention | % | UTB |
| Client Experience | Net Promoter Score | Index | UTB |
| Portfolio Management | Portfolios Within Drift Band | % | UTB |
| Portfolio Management | Rebalance Completion Time | Hours | LTB |
| Portfolio Management | Tax-Loss Harvesting Coverage | % | UTB |
| Risk & Compliance | Trade Exception Rate | % | LTB |
| Risk & Compliance | Suitability Review Compliance | % | UTB |
| Platform Reliability | Platform Availability | % | UTB |
Each one carries its own formula text, plain-English definition, owner, priority and frequency. Assets Under Management, for example, is defined as Market Value of All Client Portfolios / 1,000,000, owned by the Chief Growth Officer, Critical priority, reported monthly.
KPI Trend – One KPI, Twelve Months
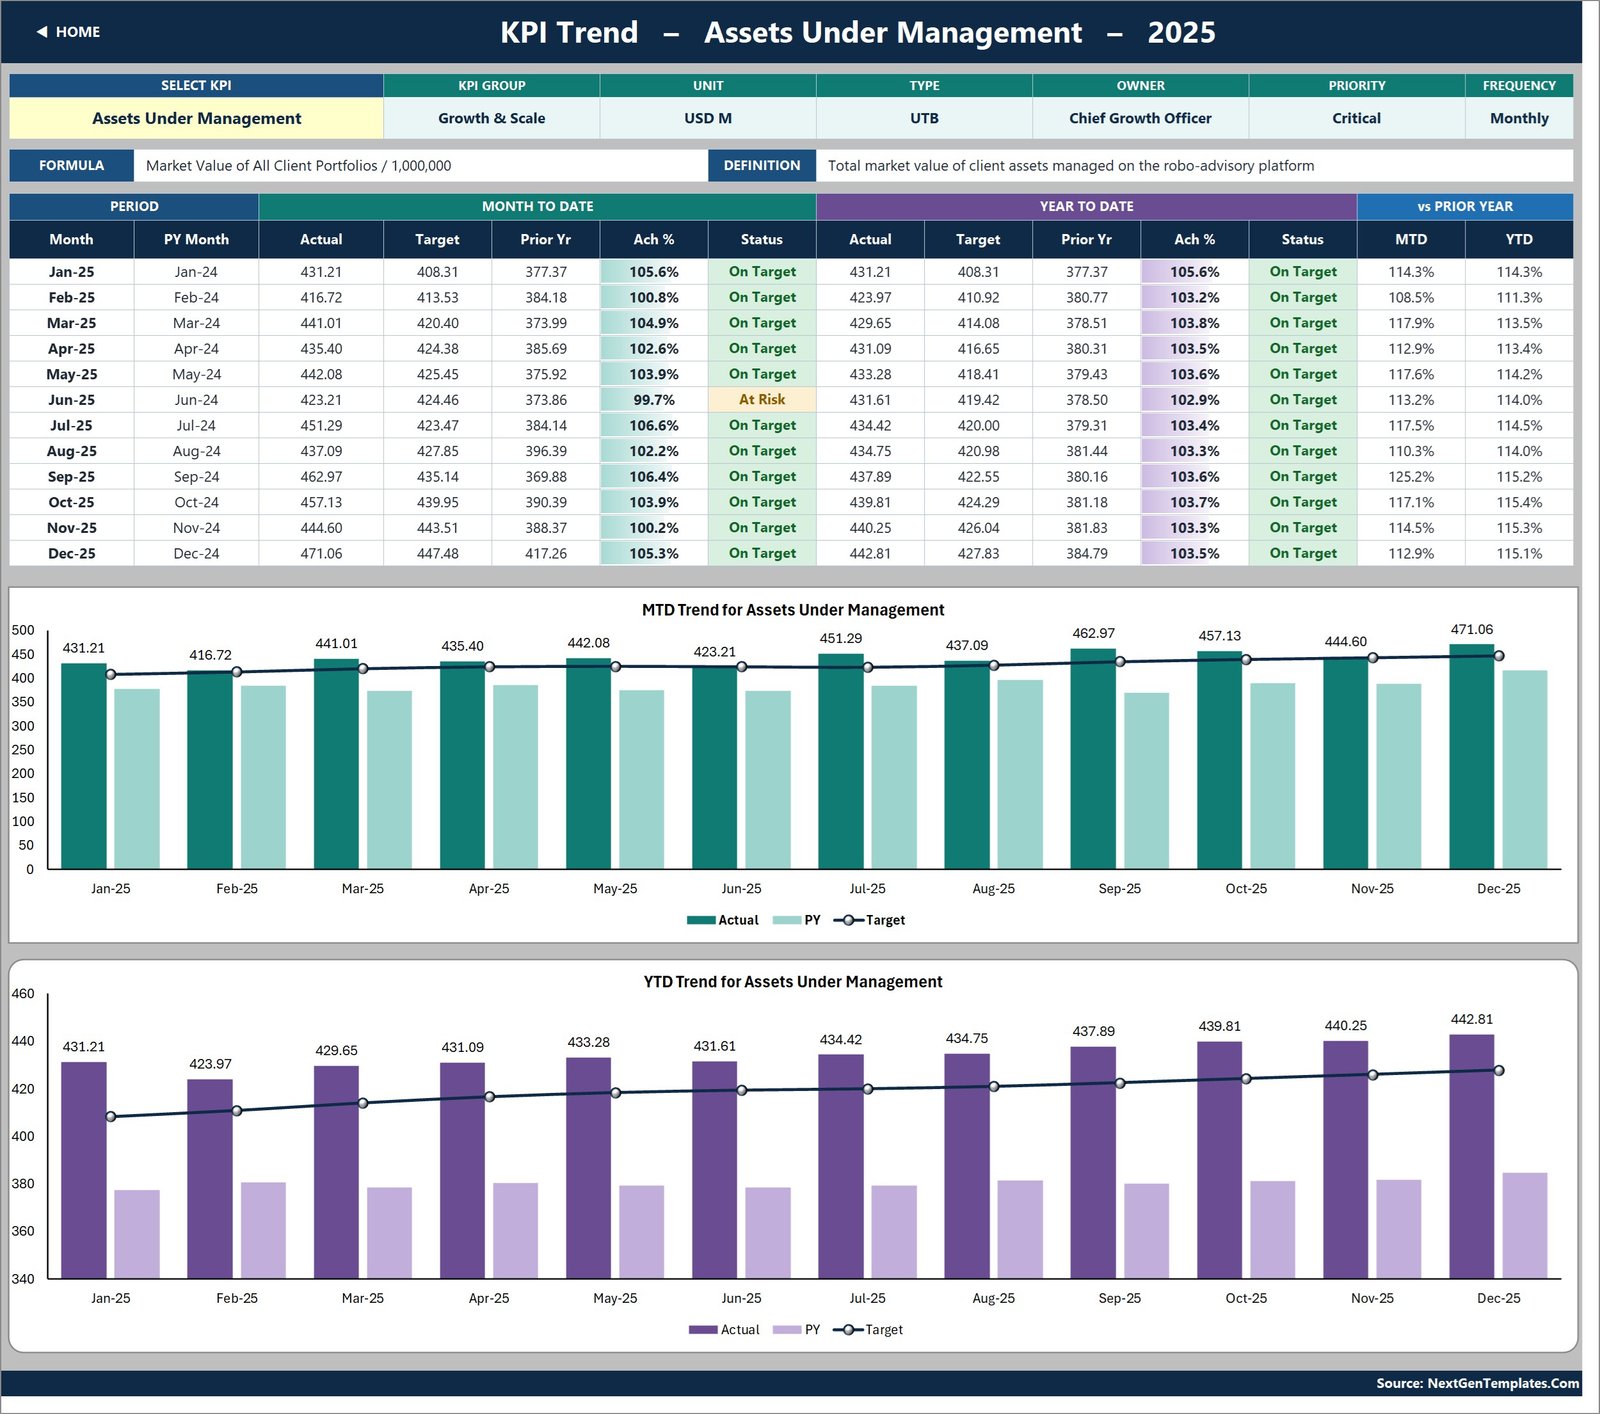
Pick a KPI in cell B4 and the whole page redraws: an attribute strip showing group, unit, type, owner, priority and frequency; the formula and definition in full; a twelve-month table with MTD and YTD actual, target, prior year, achievement and status; and two combo charts – MTD Trend for Assets Under Management and YTD Trend for Assets Under Management – each plotting actual and prior-year columns against a target line.
This is the page you open when someone in the review asks why a KPI went amber in June.
KPI Analysis – The Group Roll-Up
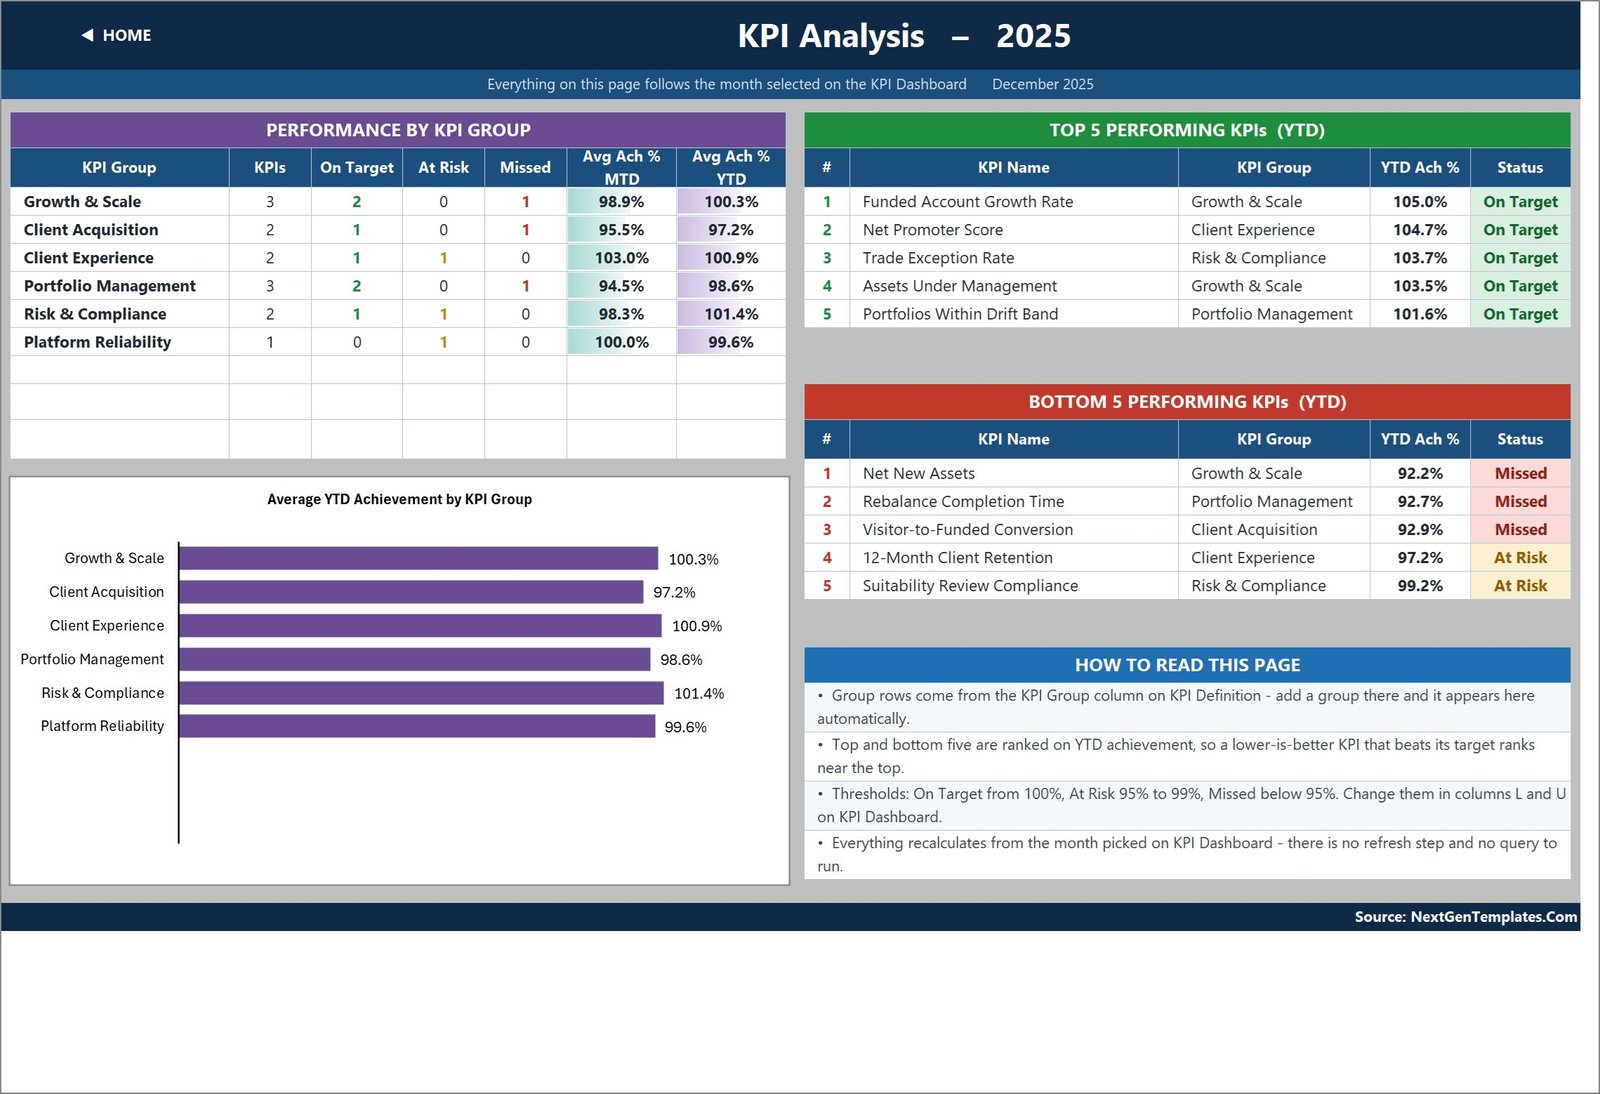
Performance rolled up by KPI group – the count of KPIs in each group, how many are On Target, At Risk and Missed, and average achievement for MTD and YTD – with an Average YTD Achievement by KPI Group bar chart underneath.
Beside it sit the top five and bottom five performing KPIs for the year to date. Because the ranking uses direction-aware achievement, a lower-is-better KPI that beats its target ranks near the top where it belongs. Everything on this page follows the month you picked on the scorecard.
The Three Sheets You Actually Type In
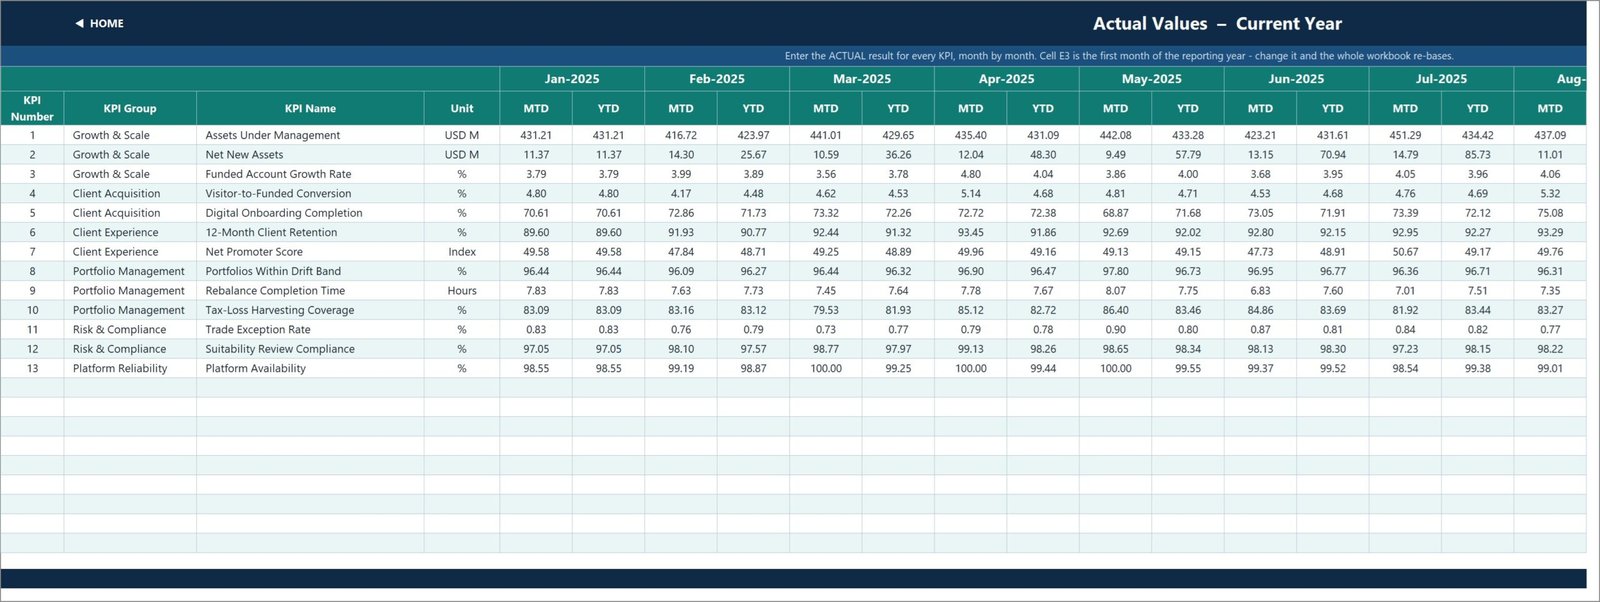
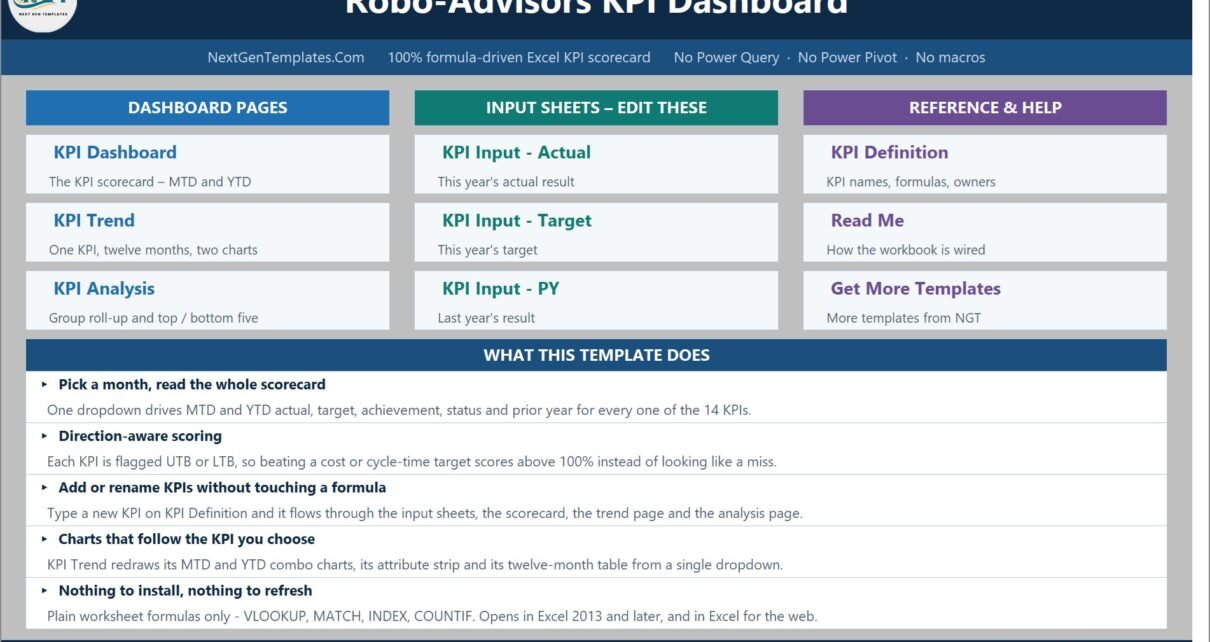
KPI Input – Actual, KPI Input – Target and KPI Input – PY each hold an MTD and a YTD column for every month of the year. The KPI rows on all three are driven by the definition sheet, so they always line up and you never re-type a KPI name.
Storing YTD explicitly rather than deriving it is a deliberate choice: it means you keep full control of how your year-to-date is defined. Volumes and counts accumulate through the year, while rates, ratios and indices are running averages. A compliance percentage that sums to 1,100% by December is the classic sign of a scorecard that got that wrong, and this one does not do it.
Setting the reporting year is one cell. Change E3 on the Actual sheet and the Target sheet, the Prior Year sheet, the month dropdown and every sheet title re-base automatically.
Scorecard Or Analytical Dashboard – Which Do You Want?
NextGenTemplates publishes both lines, and several of them have similar names, so it is worth thirty seconds to pick the right one.
| This template (KPI scorecard) | An analytical dashboard | |
|---|---|---|
| Question it answers | Did we hit target this month and year to date? | What is happening inside the data? |
| Data you supply | One number per KPI per month (actual, target, prior year) | A transaction-level table |
| Main control | A month dropdown | Slicers and filters |
| Output | Traffic-light scorecard, trend page, group roll-up | Charts, pivots and drilldown |
| Typical use | Monthly management or board review pack | Ad-hoc analysis |
| Engine | Worksheet formulas only | Usually pivot tables or a data model |
| Setup time | Minutes – type 13 numbers | Longer – you need the underlying dataset |
If your monthly meeting starts with “are we green?”, you want this one. If it starts with “why?”, you want the analytical line – and plenty of teams buy both.
Two Things To Know About This Build
We would rather tell you up front than have you find them:
- The Home page and the Read Me sheet both say the file has 14 KPIs. It actually ships 13, which is what the scorecard’s own “Total KPIs Tracked” card correctly reports. It is a stale label, not a missing KPI, and you can retype it in a second.
- The Read Me note on cumulative versus average YTD illustrates its point with aerospace examples (“aircraft deliveries, non-conformance reports”) left over from the wider template family. The rule it describes is correct and applies here; only the examples are off-topic.
Neither touches a single formula or number in the workbook, and both are plain editable text.
What This Template Is Not
Worth reading before you buy. It is a spreadsheet for reporting numbers you supply.
- It is not investment advice and does not recommend, evaluate or select any investment, portfolio, allocation or product.
- It is not a portfolio management, trading, rebalancing, custody or order-routing system, and it does not connect to a brokerage, a custodian, a market-data feed or any advisory platform.
- It does not calculate investment performance. It computes no returns, time-weighted or money-weighted, and it is not a GIPS-compliant performance report.
- It does not make your firm compliant with anything and produces no regulatory filing or record – no connection to the SEC, FINRA, SIPC, the FCA, SEBI, MiFID II, Form ADV, Regulation Best Interest, books-and-records rules, best-execution obligations or AML/KYC programmes.
- The KPI named Suitability Review Compliance is a renameable label over a percentage you type in. It evidences nothing on its own and does not perform, document or validate a suitability assessment.
- It holds no client, account or personal data and is not designed to. Keep it at aggregate KPI level.
- Every number in it is sample demo data written to make the formulas visible. The targets, thresholds and owners are placeholders, not benchmarks or recommendations, and no figure describes any real firm.
Frequently Asked Questions
Does this give investment advice or make my firm compliant?
No – to both. It is a spreadsheet that displays KPI numbers you type in. It gives no advice, evaluates no investment, satisfies no regulatory requirement and produces no filing or record for any regulator.
Is this the scorecard or the analytical dashboard?
The scorecard. Month picker, traffic lights, MTD and YTD columns, a KPI Trend page and a KPI Analysis page. If you want slicers and transaction-level charts, that is the analytical dashboard line – a different product, not a newer version of this one.
Do I have to use these 13 KPIs?
No. KPI Definition is the master list. Rename, clear or add rows there and the input sheets, the scorecard, the trend page and the analysis page all follow. No formula editing is needed up to 22 KPIs.
Does it connect to my advisory platform, custodian or CRM?
No. There is no connector, no API and no query. You enter the monthly numbers by hand or paste them in – which is exactly why it opens anywhere with no refresh step.
Why does a lower-is-better KPI show above 100%?
Because achievement is direction-aware. For an LTB KPI such as Rebalance Completion Time or Trade Exception Rate the formula is Target / Actual, so beating the target scores above 100% just as beating a growth target does.
Can I change the On Target / At Risk / Missed bands?
Yes. They are 100%, 95-99% and below 95% by default, written into the formulas in columns L and U on KPI Dashboard. Edit them there.
Do I need Power Query, Power Pivot or macros?
None of them. It is plain worksheet formulas – VLOOKUP, MATCH, INDEX, COUNTIF – so it opens in Excel 2013 and later on Windows and Mac, and in Excel for the web.
Can I go past 12 months or 22 KPIs?
Yes. Select the last data row on each sheet and fill down, then widen the ranges in the summary cards on row 4 of KPI Dashboard and in the helper columns on the Support sheet.
Can I rebrand it?
Yes. Nothing is locked, hidden or password-protected. Change colours, fonts, the title banner and the logo as you like.
Get The Template
The workbook is ten sheets – Home, KPI Dashboard, KPI Trend, KPI Analysis, the three input sheets, KPI Definition, Read Me and Get More Templates – and downloads as a ZIP containing the .xlsx plus a user-manual PDF.
Robo-Advisors KPI Dashboard in Excel – $19.99, currently $12.99.
If you report on a neighbouring corner of wealth and investment management, the same scorecard exists for other topics: Mutual Funds KPI Dashboard in Excel, Sovereign Wealth Funds KPI Dashboard in Excel, Family Offices KPI Dashboard in Excel, REITs KPI Dashboard in Excel and Stock Brokerage KPI Dashboard in Excel.
Prefer the analytical style with slicers and drilldown? Look at Mutual Funds Dashboard in Excel or ESG Investment Firms Dashboard in Excel. Working in Google Sheets instead? There is Wealth Management KPI Dashboard in Google Sheets and Investment Management KPI Scorecard in Google Sheets.
Need the same scorecard built around your own KPI list, in Excel, Power BI or Google Sheets? Tell us the KPIs that matter and we will build it – info@NextGenTemplates.Com.