Running a bakery business in 2026 means tracking dozens of operational variables at once — product category revenue, branch profitability, customer acquisition channels, order cancellation rates, and seasonal demand swings. The Bakery Business Dashboard in Power BI consolidates all of this into a single .pbix file with 5 interactive pages and 13 pre-built charts. Every visual connects to the same data model and updates automatically when you refresh, giving bakery owners and F&B managers a real-time performance view without building reports from scratch.
According to Microsoft’s Power BI documentation, Power BI Desktop is free to download and supports full data modeling and visualization without a paid subscription. This makes it one of the most cost-effective analytics platforms available for small and mid-size food businesses.
➡️ Click here to Purchase the Bakery Business Dashboard in Power BI
Key Features of Bakery Business Dashboard in Power BI
The Bakery Business Dashboard in Power BI includes 6 KPI cards on the Overview page — Total Orders, Total Revenue, Net Profit, Total Quantity, Order Completion Rate, and Cancellation Rate — alongside 13 charts spread across 5 dedicated analysis pages. Each page is purpose-built for a specific business function, so bakery managers, branch owners, and marketing teams each have a focused view without navigating through unrelated data.
Dynamic slicers let you filter any page by date range, product category, branch location, customer type, or sales channel. All 5 pages update simultaneously when a slicer is applied — giving you cross-dimensional analysis (e.g. “How did wholesale revenue trend in Q3 for our bread category?”) in seconds rather than building separate pivot tables.
Dashboard Pages Explanation
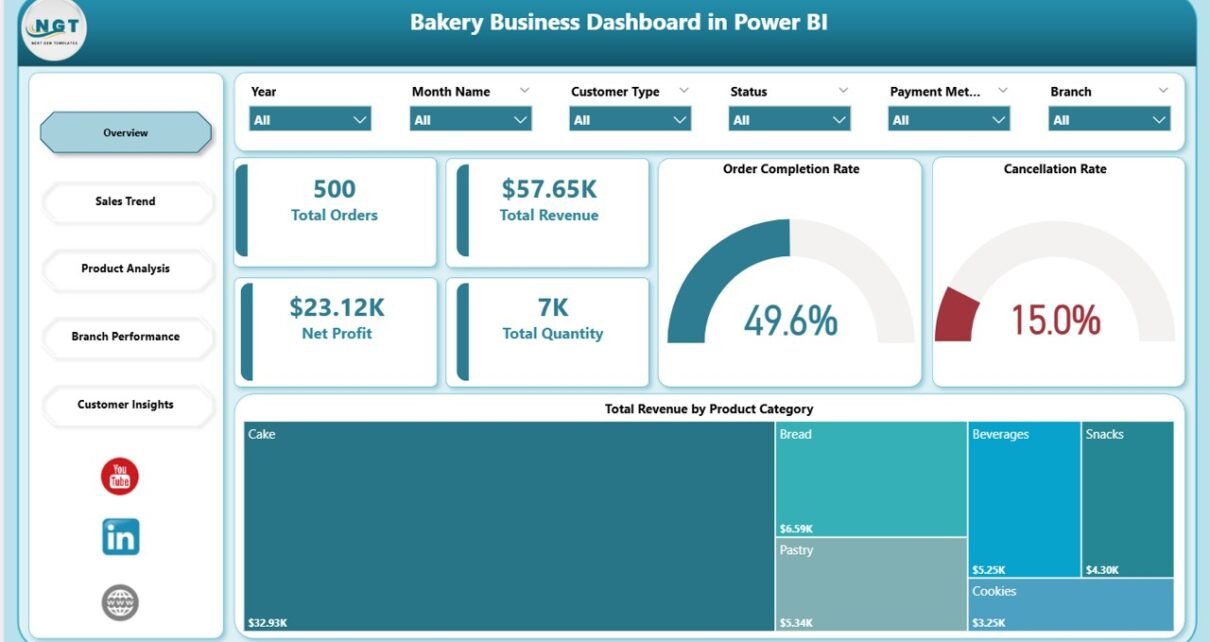
Page 1: Overview — The command centre for bakery performance. Six KPI cards display Total Orders, Total Revenue, Net Profit, Total Quantity, Order Completion Rate, and Cancellation Rate at a glance. A Total Revenue by Product Category chart reveals which categories drive income. Dynamic slicers let you filter by date, branch, or category to compare performance across time periods and locations instantly.
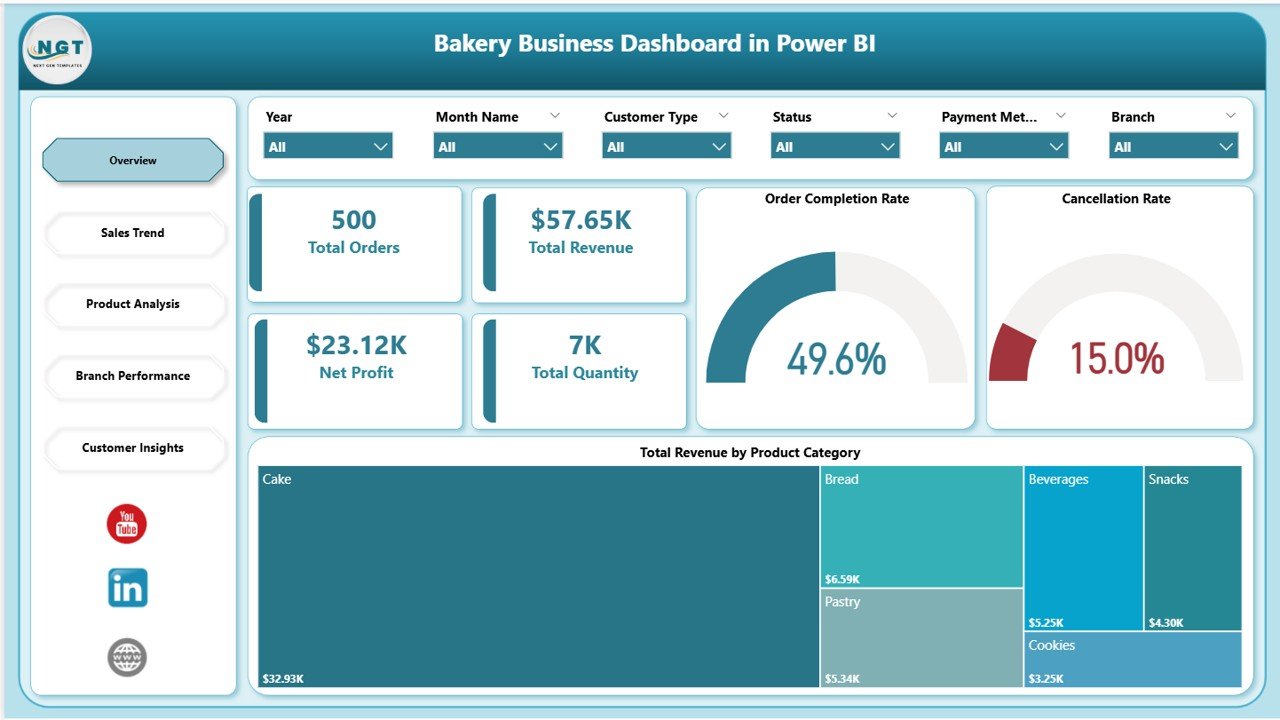
Bakery Business Dashboard in Power BI – Overview Page
Page 2: Sales Trend — Tracks revenue and order patterns across customer types and time periods. Total Revenue by Customer Type shows which buyer segment — wholesale, retail, or online — generates the most income. Average Order Value by Product Category reveals which products command the highest spend per order. Total Orders by Month Name maps seasonal demand peaks so bakery teams can plan production and staffing efficiently.
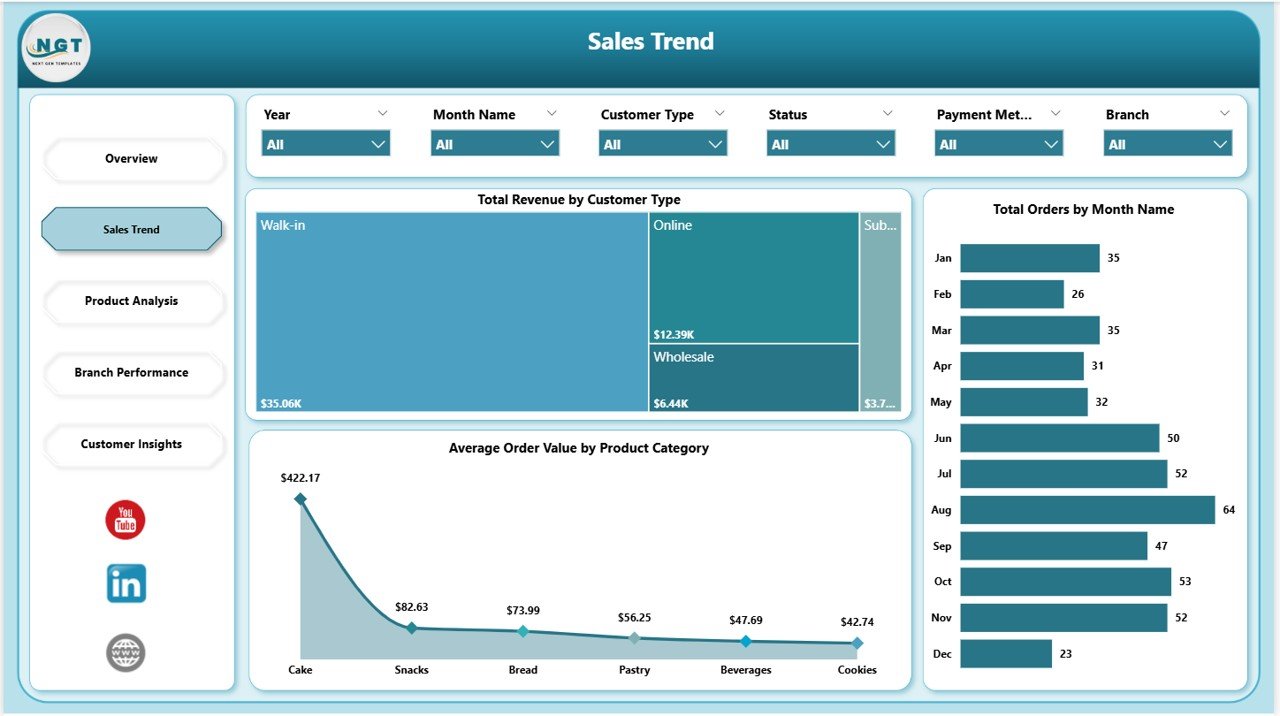
Bakery Business Dashboard in Power BI – Sales Trend Page
Page 3: Product Analysis — Focuses on profitability and fulfilment by product category. Profit Margin by Product Category pinpoints which items deliver the highest margin so owners can prioritise high-value SKUs. Cancelled Orders by Product Category flags which product lines have fulfilment problems that are costing revenue. Total Orders by Product Category maps demand distribution to guide production planning and inventory management.
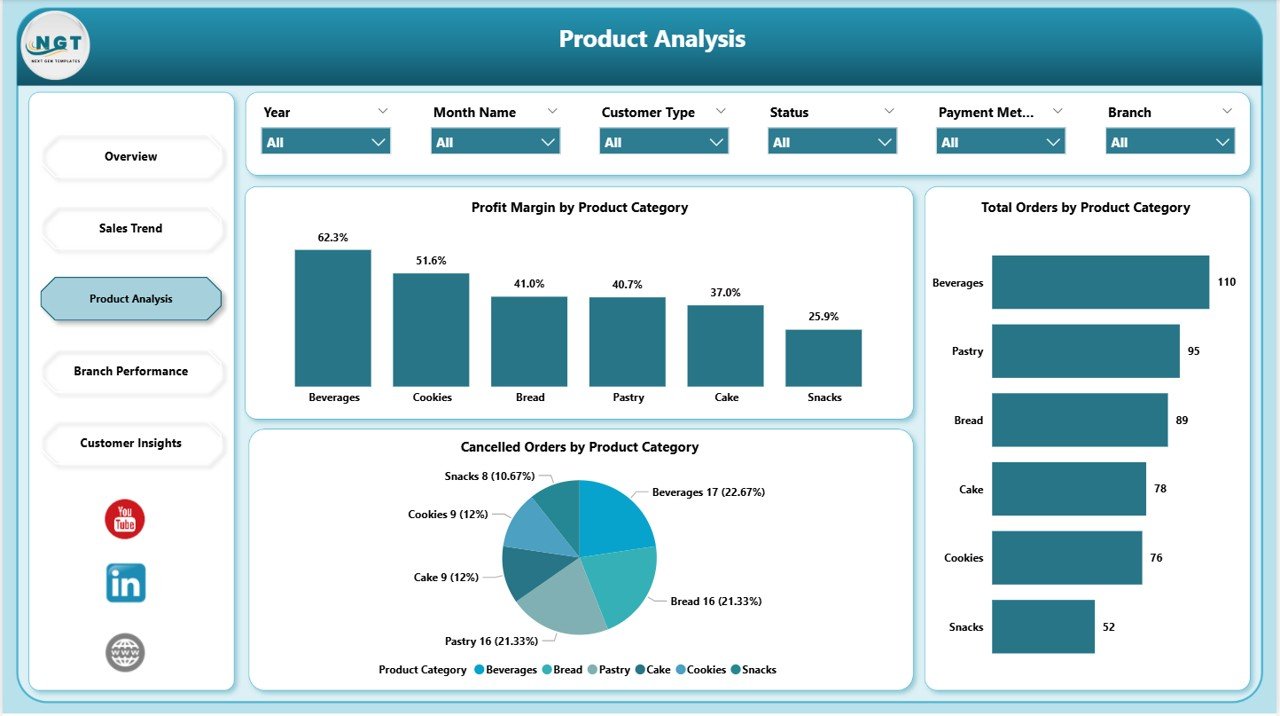
Bakery Business Dashboard in Power BI – Product Analysis Page
Page 4: Branch Performance — The most critical page for multi-location bakery operators. Net Profit by Branch, Total Revenue and Total Cost by Branch, and Total Orders by Branch are displayed side by side, making it straightforward to rank locations by profitability, spot cost overruns, and identify branches that need operational intervention. All branch comparisons update dynamically when date or category slicers are applied.
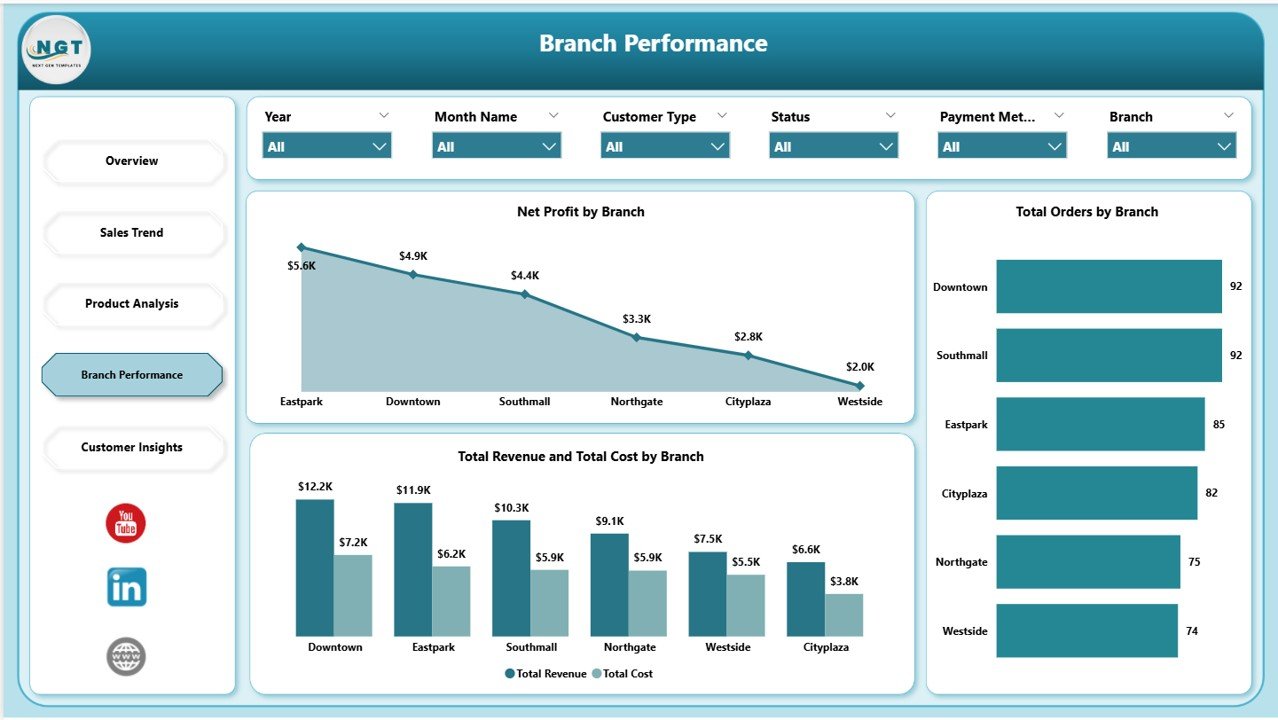
Bakery Business Dashboard in Power BI – Branch Performance Page
Page 5: Customer Insights — Breaks down revenue and profitability by customer segment and acquisition channel. Profit Margin by Customer Type shows which buyer segments deliver the most margin (not just revenue). Total Revenue by Channel shows the contribution of each sales channel — in-store, online, wholesale — to overall income. Average Order Value by Customer Type helps marketing teams prioritise acquisition spend on the highest-value customer groups.
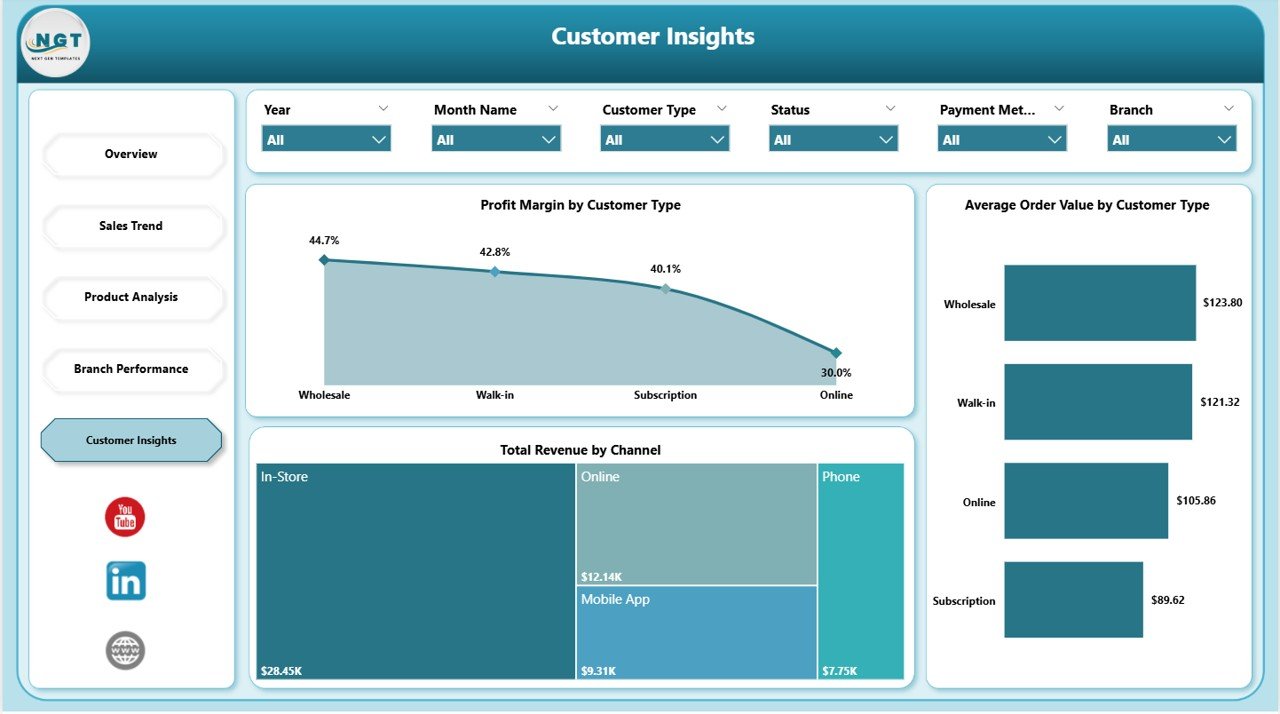
Bakery Business Dashboard in Power BI – Customer Insights Page
Bakery Business Dashboard in Power BI vs. Tableau vs. Toast POS Analytics — Feature Comparison
| Feature | Bakery Business Dashboard in Power BI | Tableau Desktop | Toast POS Analytics |
|---|---|---|---|
| Cost | $17.99 one-time | $75/user/month | $69–$165/month |
| Platform | Power BI Desktop (free) | Tableau Desktop (licensed) | Cloud SaaS |
| Setup Time | Under 10 minutes | Days to build from scratch | 2–4 weeks onboarding |
| Team Collaboration | Power BI Service (free tier) | Tableau Server required | ✅ Yes |
| Mobile Access | Power BI Mobile app | Tableau Mobile | ✅ Dedicated app |
| Customizable KPIs | ✅ Full DAX customization | ✅ Full | ⚠️ Limited to POS fields |
| 5-Page Dashboard | ✅ Pre-built | ❌ Build from scratch | ❌ Fixed reports only |
| Year-1 Cost at 5 Users | $17.99 total | $4,500 | $4,140–$9,900 |
For bakery businesses that want Power BI analytics without monthly SaaS fees, the Bakery Business Dashboard in Power BI delivers everything they need at a fraction of the cost.
Who Should Use This Template
Perfect for:
- Bakery owners tracking revenue, profit, and order performance across product categories
- Multi-branch bakery operators needing side-by-side branch comparisons
- F&B business analysts delivering visual performance reports to bakery leadership
- Small to mid-size bakeries (1–20 locations) wanting BI-grade analytics without enterprise software costs
Not a fit if:
- Your bakery chain has 50+ locations requiring real-time POS API integrations
- Your team doesn’t have Power BI Desktop — use the Bakery Business Dashboard in Excel instead
- You need live IoT sensor data from production line equipment
Real-World Use Cases
James manages operations for a 6-branch artisan bakery in London. He opens the Bakery Business Dashboard in Power BI every Monday morning, applies the previous week’s date slicer, and reviews Net Profit and Total Revenue across all branches in under 5 minutes. The Cancelled Orders by Product Category chart flagged a persistent fulfilment issue in his signature sourdough line — helping him address it before it impacted monthly revenue targets.
Priya runs a bakery in Mumbai serving both retail customers and wholesale catering clients. The Customer Insights page showed that her wholesale segment had 40% higher Average Order Value than retail, but contributed a disproportionately low share of Total Revenue by Channel. This data led her to renegotiate wholesale contracts and reallocate marketing budget toward wholesale acquisition, increasing revenue per order by 22% in one quarter.
Carlos is an F&B consultant based in São Paulo. He uses the Bakery Business Dashboard in Power BI as a standard client deliverable — replacing sample data with each bakery client’s figures and presenting the five-page report in monthly review meetings. The structured format saves him 8+ hours per engagement compared to building custom Tableau dashboards from scratch, and clients consistently rate the visual quality higher than the spreadsheet reports they received before.
➡️ Click here to Purchase the Bakery Business Dashboard in Power BI
Advantages of Bakery Business Dashboard in Power BI
The primary advantage is cost efficiency. Toast POS Analytics costs $69–$165 per month. MarketMan starts at $239 per month. The Bakery Business Dashboard in Power BI costs $17.99 as a one-time purchase with lifetime access. For a 10-person bakery team, that’s a saving of $800–$2,800 per year in analytics software costs alone.
The second advantage is data flexibility. Unlike POS-connected SaaS tools that only report on data from their own system, the Power BI dashboard works with any data source — CSV exports from your POS, ERP data, or manually entered figures. You control what goes in and what gets analyzed.
The third advantage is customization depth. As a standard .pbix file, every DAX measure, chart type, colour, and visual can be modified in Power BI Desktop without additional cost or developer involvement. Add new product categories, new branches, new customer segments — the data model expands to accommodate whatever your bakery business grows into.
Opportunities for Improvement
The Bakery Business Dashboard in Power BI works with manually refreshed data rather than live POS API connections. Teams that want real-time streaming data will need to configure Power BI’s data gateway and connect to their source system directly — which is possible in Power BI but requires additional setup beyond the template itself.
The template also covers 5 standard analysis pages. Bakery businesses with highly specific reporting needs — such as ingredient cost tracking by supplier, production batch yield monitoring, or loyalty programme analytics — will want to add custom pages or measures. These are possible with Power BI Desktop but require some DAX knowledge.
Best Practices
Keep your data table structure consistent with the template’s column names when you replace the sample data. If you rename column headers in your source file, update the Power Query references in the .pbix accordingly to prevent refresh errors. Also consider setting up Power BI’s incremental refresh if you’re working with more than 12 months of historical data — this keeps dashboard load times fast as your dataset grows.
Explore Relevant Templates
🔹 Bakery Business Dashboard in Excel — Same 5-page analysis structure for teams working in Microsoft Excel instead of Power BI.
🔹 Bakery KPI Scorecard in Excel — Track bakery KPIs with MTD/YTD comparisons, trend charts, and conditional formatting across 4 worksheet tabs. Read the full review: Bakery Business Dashboard in Excel review.
🔹 Catering Business KPI Scorecard in Excel — Monitor catering KPIs including food cost percentage, labor cost ratio, and on-time delivery rate.
🔹 Browse all Power BI Dashboard Templates for more industry-specific analytics tools.
Frequently Asked Questions
What KPIs does the Bakery Business Dashboard in Power BI track?
The Bakery Business Dashboard in Power BI tracks 6 KPIs — Total Orders, Total Revenue, Net Profit, Total Quantity, Order Completion Rate, and Cancellation Rate — plus 13 charts across 5 pages covering product analysis, branch performance, sales trends, and customer segments.
Do I need a paid Power BI license?
No. The dashboard works with Power BI Desktop, which is free from Microsoft. A paid Power BI Pro license is only needed if you want to publish and share the report via Power BI Service for team access across multiple users.
How long does setup take?
Setup takes under 10 minutes. Open the .pbix file in Power BI Desktop, replace the sample data with your bakery’s own figures, and click refresh. All 5 pages and 13 charts update automatically without any DAX or formula changes.
Can I add new product categories or branches?
Yes. Add new category names or branch names to your data table and the dashboard visuals expand automatically to include them. No structural changes to the .pbix are needed for standard data additions.
How does this compare to POS analytics tools?
POS-integrated analytics tools like Toast cost $69–$165 per month and require onboarding. The Bakery Business Dashboard in Power BI costs $17.99 one-time and works with any data source — not just POS-generated data. For small to mid-size bakeries, the cost savings over 12 months exceed $800.
Is there an Excel version?
Yes. The Bakery Business Dashboard in Excel covers the same 5 analysis pages for teams that prefer Microsoft Excel over Power BI.
About the Author
Built by PK — Microsoft Certified Professional with 15+ years of Excel, Google Sheets, and Power BI experience. Founder of NextGenTemplates, reaching 300K+ subscribers across YouTube channels. Every template is hand-built and tested before release.
Conclusion
The Bakery Business Dashboard in Power BI gives bakery businesses a complete multi-page analytics solution — covering Overview KPIs, Sales Trends, Product Analysis, Branch Performance, and Customer Insights — without paying monthly SaaS fees or building reports from scratch. For bakery owners and F&B managers who want professional BI-quality analytics at a one-time price, this dashboard delivers immediate operational value.
➡️ Click here to Purchase the Bakery Business Dashboard in Power BI
✅ Instant download · One-time payment · No subscription
👉 Youtube.com/@PK-AnExcelExpert
📅 Last updated: May 2026