Family offices managing $50M to $10B+ in assets collectively oversee an estimated $6 trillion in global wealth — yet most rely on fragmented spreadsheets or expensive enterprise platforms ($500–$2,000/month) to track their operational and investment KPIs. The Family Offices KPI Dashboard in Excel solves this with a 7-worksheet, fully configurable KPI monitoring system that delivers MTD and YTD Actual vs Target vs Previous Year comparisons with conditional formatting variance arrows, all controlled by a single month selector dropdown on cell D3. This is a ready-to-use template that you can set up in under 15 minutes.
In this article we have created the Family Offices KPI Dashboard in Excel. This is a ready to use template that delivers structured board-level KPI reporting at a one-time cost of $14.99.
👉 Click here to Purchase the Family Offices KPI Dashboard in Excel | Instant download · One-time payment · No subscription
Key Features of Family Offices KPI Dashboard in Excel
The Family Offices KPI Dashboard in Excel tracks KPIs across 7 structured worksheets with the following built-in capabilities:
MTD and YTD dual-view monitoring: Every KPI shows Month-to-Date and Year-to-Date Actual, Target, and Previous Year data side by side. Family office managers get a complete picture of performance trajectory without building custom views or pivot tables.
Conditional formatting variance arrows: Target vs Actual and PY vs Actual columns display dynamic up/down arrows colored green or red. The dashboard eliminates manual variance analysis — your team immediately sees which KPIs are on track and which require attention.
Dynamic month selector on cell D3: A single dropdown on the Dashboard sheet switches the entire view to the selected month. All MTD numbers, charts, and variance indicators recalculate in real time — no formula edits required.
KPI Trend charts with LTB/UTB classification: The KPI Trend sheet plots separate MTD and YTD trend lines for Actual, Target, and Previous Year. Each KPI is classified as Lower the Better (LTB) or Upper the Better (UTB), ensuring variance colors always reflect the correct performance direction for each metric.
Fully configurable KPI library: The KPI Definition sheet accepts KPI Name, Group, Unit, Formula, and Description for every metric. Family offices can track any financial, operational, compliance, or investment KPI relevant to their mandate.
For a broader set of Excel KPI Dashboard Templates covering dozens of industries, browse the full catalog on NextGenTemplates.
Dashboard Sheets Explanation
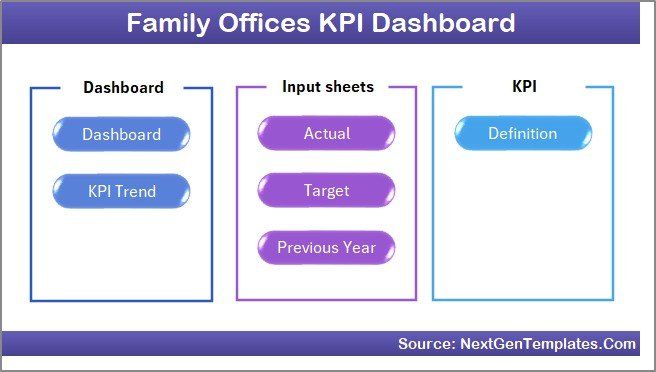
Below are the key features of this KPI Dashboard. In this dashboard, we have 7 worksheets:
1. Home Sheet
This is an index sheet where we have given 6 buttons to jump to the respective sheet. It provides a clean navigation starting point for every user of the family office reporting file.
Home Page
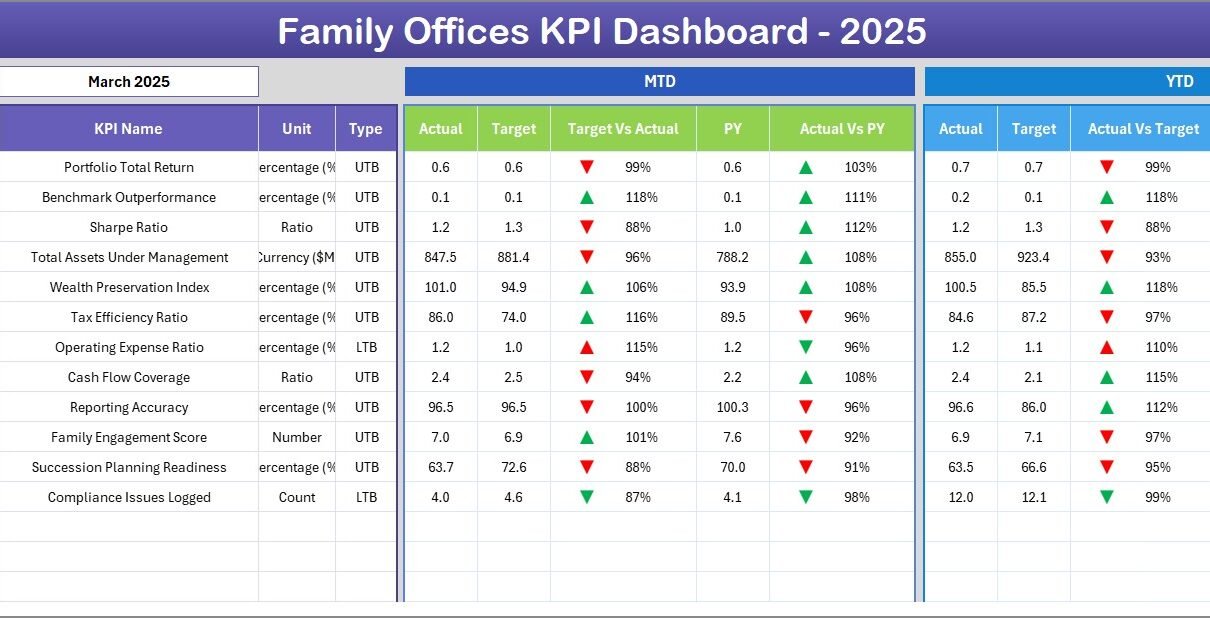
2. Dashboard Sheet Tab
This is the main sheet tab. Here, we are showing all information about all of the KPIs. On range D3, you can select the Month from the drop-down. The whole dashboard numbers will change for that month. Here, we are showing the MTD Actual, Target, Previous Year data along with the Target Vs Actual and PY vs Actual with Conditional formatting up down arrow. We are also showing YTD Actual, Target, Previous Year data along with the Target Vs Actual and PY vs Actual with Conditional formatting up down arrow.
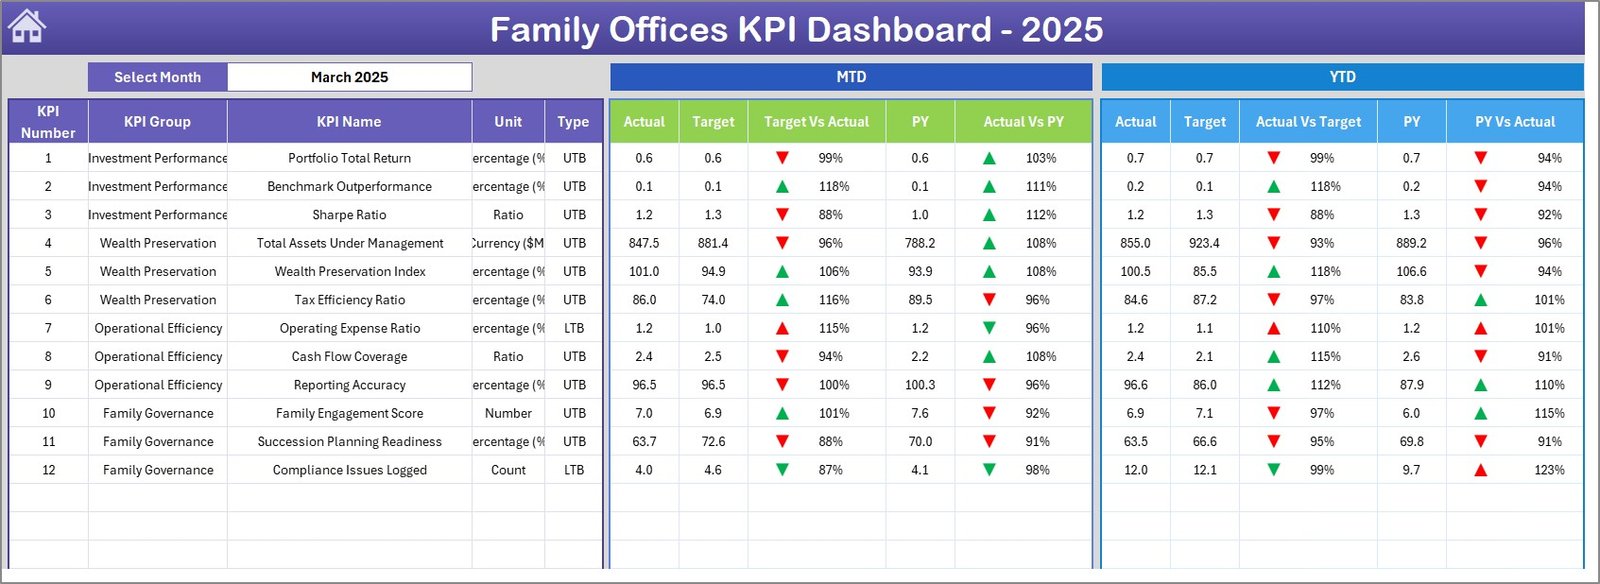
Family Offices KPI Dashboard in Excel
3. KPI Trend Sheet Tab
Here you can select the KPI name from the drop down available on range C3. We have displayed the KPI Group, Unit of KPI, Type of KPI (Lower the Better or Upper the Better), Formula of the KPI and Definition of the KPI. We are also showing the MTD and YTD trend chart for Actual, Target and PY numbers.
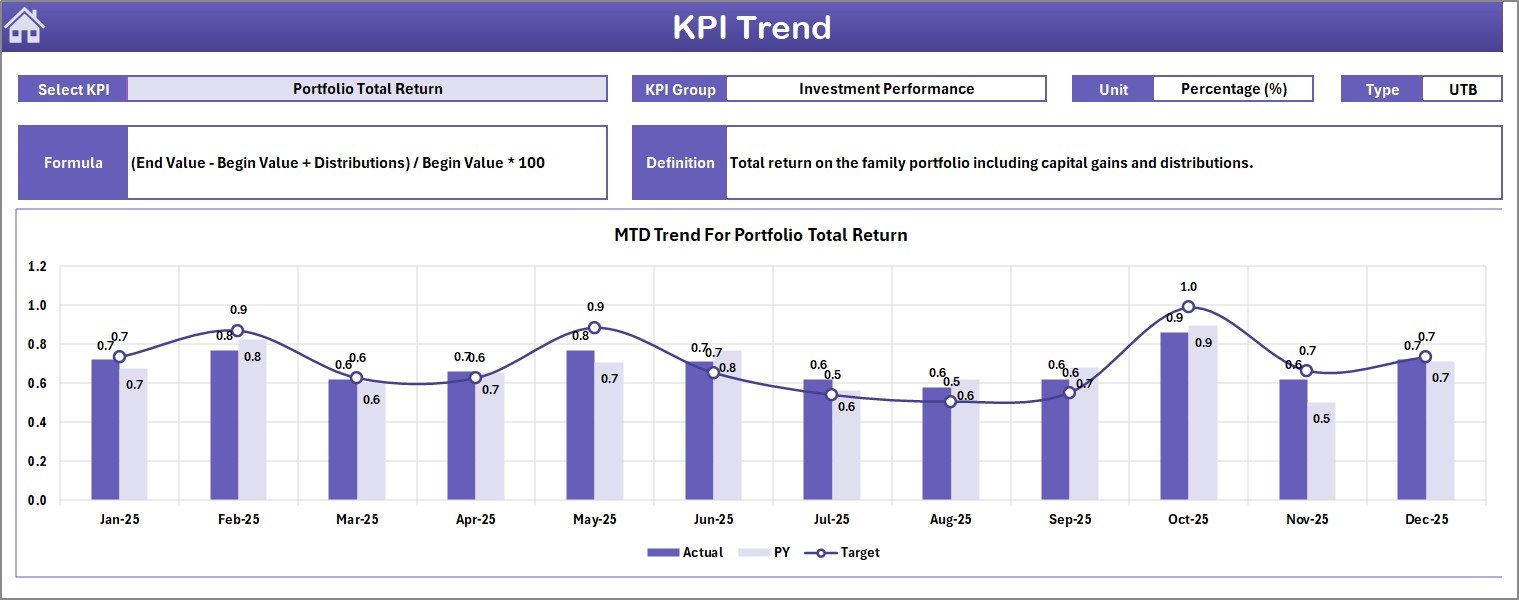
KPI Trend Sheet
4. Actual Numbers Input Sheet
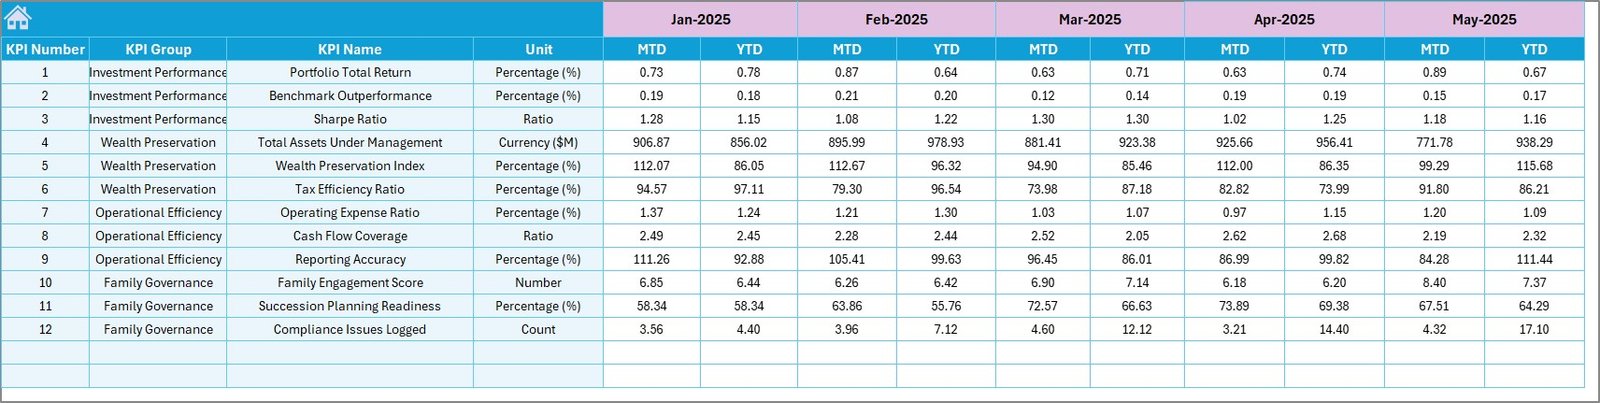
Here you have to enter the actual numbers for YTD and MTD for a particular month. You can change the months from range E1. Just input the first month of the Year on range E1 and the entire structure adjusts automatically.
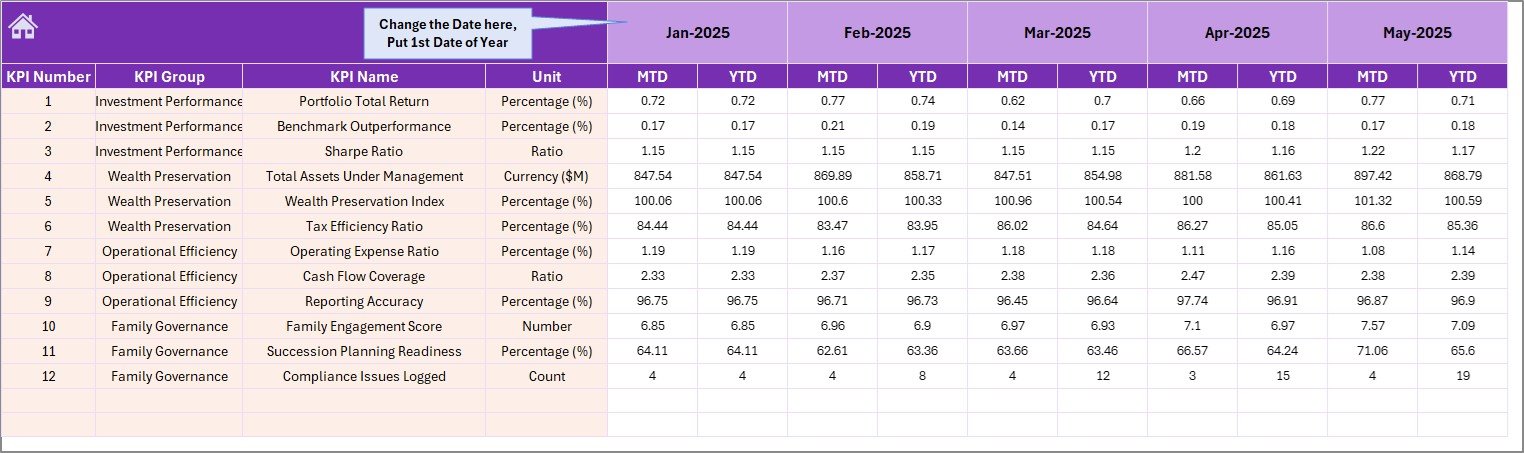
Actual Numbers Input Sheet
5. Target Number Input Sheet
In this sheet tab, you have to enter the Target numbers for each KPI for the particular month as MTD as well as YTD. Set your annual targets once and they drive all the variance calculations on the main dashboard.
Target Number Input Sheet
6. Previous Year Number Sheet Tab
Enter here the numbers for the previous year, using the same MTD and YTD structure as the current year actuals. This enables the year-over-year comparison columns on the Dashboard sheet.
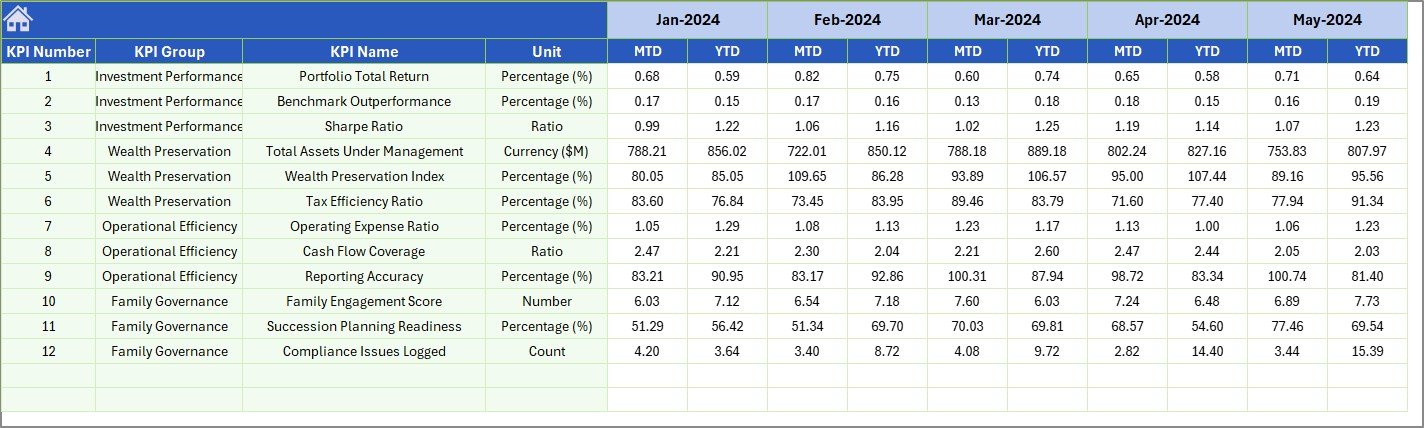
Previous Year Number Input Sheet
7. KPI Definition Sheet Tab
In this sheet tab, you have to enter the KPI Name, KPI Group, Unit, Formula and KPI definition. In the last column Enter the KPI type as LTB (Lower the better) or UTB (Upper the Better). This definition sheet drives the dashboard, trend charts, and LTB/UTB variance logic across the entire template.
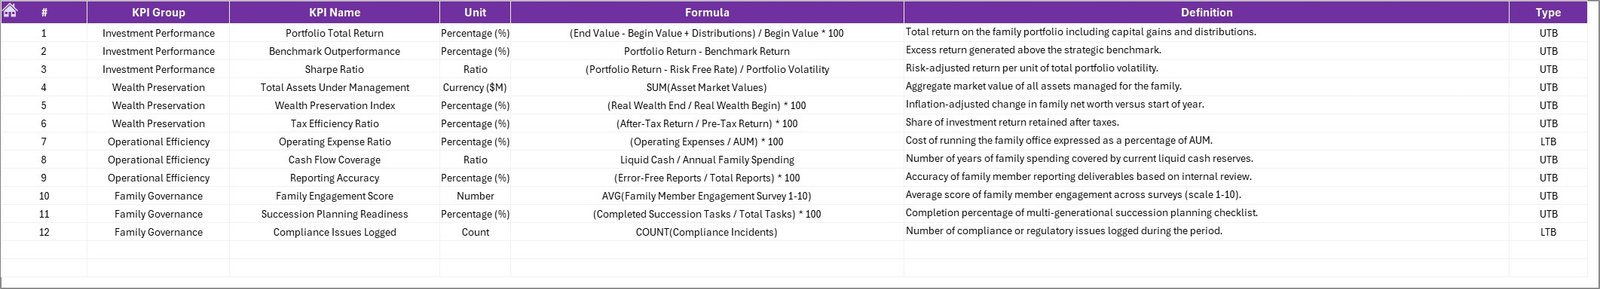
KPI Definition Sheet
Family Offices KPI Dashboard in Excel vs. Google Sheets vs. Addepar — Feature Comparison
| Feature | Family Offices KPI Dashboard in Excel | Google Sheets Equivalent | Addepar / Orion |
|---|---|---|---|
| Cost | $14.99 one-time | Free (hours of manual build) | $500–$2,000+/month |
| Platform | Microsoft Excel | Google Sheets (browser) | Cloud SaaS |
| Setup time | Under 15 minutes | Hours of manual build | Weeks of onboarding |
| MTD + YTD dual-view | ✅ Built-in | ❌ Manual formula setup | ✅ Yes |
| LTB/UTB KPI classification | ✅ Built-in | ❌ Not standard | ✅ Configurable |
| Customizable KPI library | ✅ Fully configurable | ✅ Manual | ✅ Yes |
| Works offline | ✅ Yes | ❌ Requires internet | ❌ Requires internet |
| Year-1 cost (5 users) | $14.99 total | $0 + build time | $30,000–$120,000+ |
For family offices that need structured MTD/YTD KPI reporting without enterprise pricing, the Family Offices KPI Dashboard in Excel sits in the clear sweet spot.
Who Should Use This Template
✅ Perfect for:
- Single-family and multi-family office teams tracking 10–50 KPIs monthly
- Finance directors and CFOs who prepare MTD/YTD board-level KPI reports
- Wealth managers and investment analysts already working in Excel
- Family office administrators building their first structured KPI monitoring process
- Small family office teams that want enterprise-grade reporting without enterprise pricing
❌ Not a fit if:
- You need SOC 2 compliance, SSO, or real-time portfolio data feeds from custodians
- Your office requires automated data ingestion from prime brokers or portfolio accounting systems
- You prefer a browser-based solution (see Wealth Management KPI Dashboard in Google Sheets)
Real-World Use Cases
Marcus manages reporting for a $300M single-family office. Every month he opens the Family Offices KPI Dashboard in Excel, enters actuals on the input sheet, selects the current month from the dropdown on D3, and produces a complete board report in under 20 minutes — showing MTD and YTD variance against target for every operational, investment, and compliance KPI tracked by the office. Before this template, the same report took half a day.
Priya heads a multi-family office serving 12 client families. She uses the KPI Definition sheet to maintain a consistent metric library across all client reporting packs, and drills into the KPI Trend sheet to spot metrics trending off-target before quarterly review meetings — all without paying $1,000/month for a dedicated reporting platform.
A boutique wealth management firm pairs the Investment Banking KPI Dashboard in Excel for deal-desk KPI monitoring with the Family Offices KPI Dashboard for their family office division. Each team gets a structured Excel-based reporting tool without any IT infrastructure investment or monthly licensing fees.
Advantages of Family Offices KPI Dashboard in Excel
👉 Click here to Purchase the Family Offices KPI Dashboard in Excel
The primary advantage is speed-to-insight. Family office teams spend less time building reports and more time analyzing results. The LTB/UTB classification system means conditional formatting is always contextually correct — a metric where a lower number is better (like cost per transaction) will show green when it falls, not when it rises, unlike generic dashboards that assume higher is always better.
The separation of input sheets (Actual, Target, Previous Year) from the display layer (Dashboard, KPI Trend) means multiple team members can update data simultaneously without breaking formulas. The KPI Definition sheet gives compliance and investment teams a single source of truth for KPI definitions, reducing audit risk and onboarding time for new analysts.
At $14.99 one-time, the Family Offices KPI Dashboard in Excel replaces tools that cost 400x more per year for equivalent structured reporting. According to Microsoft’s Excel documentation, Excel-based KPI systems remain the most widely deployed performance monitoring approach in financial services due to flexibility and offline access.
Opportunities for Improvement
Like any pre-built template, the Family Offices KPI Dashboard in Excel has some boundaries worth knowing. The conditional formatting logic is built around the LTB/UTB classification in the KPI Definition sheet — if a KPI type is entered incorrectly, the variance arrows will display the wrong color direction. Also, the template does not automatically import data from portfolio accounting systems or custodian feeds; actual numbers must be entered manually each month. Teams requiring fully automated data pipelines should evaluate enterprise options alongside this template.
Best Practices
Get the most from the Family Offices KPI Dashboard in Excel by following these tips. First, complete the KPI Definition sheet entirely before entering any actuals or targets — the LTB/UTB column in particular drives the entire variance logic. Second, set cell E1 on the Actual Numbers Input sheet to January (or your fiscal year start month) before entering data for the first time. Third, review the KPI Trend sheet at the start of each monthly review to identify any KPIs approaching threshold before the board meeting rather than during it. Finally, keep the Previous Year Number sheet updated with last year’s final actuals, not interim figures, to ensure year-over-year comparisons are meaningful.
Explore Relevant Templates
If you work in financial services or investment management, these related templates from NextGenTemplates may also be useful:
- Investment Banking KPI Dashboard in Excel — 7-worksheet structure optimized for deal-desk and M&A KPIs
- Wealth Management KPI Dashboard in Google Sheets — browser-based KPI monitoring for cloud-first offices
- Investment Management Dashboard in Excel — portfolio performance visualization with multi-page charts
Browse all Excel KPI Dashboard Templates on NextGenTemplates.com.
Frequently Asked Questions
👉 Click here to Purchase the Family Offices KPI Dashboard in Excel
What KPIs does the Family Offices KPI Dashboard in Excel track?
The Family Offices KPI Dashboard in Excel tracks any KPIs you define in the KPI Definition sheet. You can configure financial KPIs like AUM growth and return on investment, operational KPIs like cost per transaction, or compliance KPIs like regulatory filing completion rate. The template ships with a fully configurable library supporting unlimited KPI definitions.
How does the month selector dropdown work?
Cell D3 on the Dashboard sheet contains a dropdown listing all 12 months of the year. Selecting a month instantly refreshes all MTD Actual, Target, and Previous Year figures plus the conditional formatting variance arrows for that period. No formulas need editing — the entire dashboard recalculates automatically.
What is the difference between LTB and UTB classification?
LTB (Lower the Better) means a decreasing value is a positive outcome — for example, client complaint rate or cost ratio. UTB (Upper the Better) means an increasing value is positive — for example, AUM growth or return on equity. This classification drives the conditional formatting colors so variance arrows display green for improvement regardless of direction.
How does the Family Offices KPI Dashboard in Excel compare to Addepar or Orion Advisor?
Addepar and Orion Advisor are enterprise SaaS platforms with monthly costs of $500–$2,000+ per user and weeks of onboarding. The Family Offices KPI Dashboard in Excel delivers structured MTD/YTD KPI reporting for a one-time payment of $14.99 — with no subscription fees, no per-user charges, offline access, and setup in under 15 minutes.
Can I add custom KPI groups or categories?
Yes. The KPI Definition sheet includes a KPI Group column that is fully customizable. You can create groups like Investment Performance, Operational Efficiency, Compliance, Client Service, or any category relevant to your family office mandate. KPI groups appear as labels on the Dashboard for organized reporting.
Does the template require any Excel add-ins or VBA macros?
No. The Family Offices KPI Dashboard in Excel is built entirely using native Excel features — formulas, conditional formatting, and dropdown lists. No VBA macros, Power Query, or third-party add-ins are required. It is compatible with Excel 2016 and later on both Windows and Mac.
How do I handle a mid-year KPI change?
If you add a new KPI mid-year, enter it in the KPI Definition sheet and add corresponding rows to the Target, Actual, and Previous Year input sheets. Existing months before the addition will show blank values, which the dashboard handles cleanly without errors.
About the Author
Built by PK — Microsoft Certified Professional with 15+ years of Excel, Google Sheets, and Power BI experience. Founder of NextGenTemplates, reaching 300K+ subscribers across YouTube channels (@PK-AnExcelExpert, @NextGenTemplates, @NeoTechNavigators). Every template is hand-built and tested before release.
Conclusion
The Family Offices KPI Dashboard in Excel gives single-family and multi-family offices a structured, board-ready KPI reporting system at a fraction of the cost of enterprise platforms. With 7 worksheets, MTD and YTD dual-view reporting, conditional formatting variance arrows, KPI trend charts, and a fully configurable KPI library, it covers the full monthly reporting workflow for under $15.
👉 Click here to Purchase the Family Offices KPI Dashboard in Excel
✅ Instant download · One-time payment · No subscription · Lifetime access
For step-by-step video tutorials, visit Youtube.com/@PK-AnExcelExpert