New: NextGenTemplates Academy - video courses on Excel formulas with AI and Pivot Tables & dashboards. Early-bird: 20% off with code EARLYBIRD20 - first 20 orders only. See the courses →
  • Learn Excel (Free Course)
    • 1. Shortcut Keys
    • 2. Fill & Flash Fill
    • 3. Find & Replace
    • 4. Sort & Filter
    • 5. Formulas & Functions
    • 6. Data Validation
    • 7. Conditional Formatting
    • 8. Basic Charts
    • 9. Advanced Charts
    • 10. Pivot Tables
    • 11. Excel Dashboards
    • 12. VBA Course
    • 13. Excel Formulas with AI
  • Templates
  • Tutorials
    • Charts and Visualization
    • VBA
    • Excel Tips and Tricks
    • Excel Dashboards
    • Power Pivot & DAX
  • Power BI
  • Template Store
    • Ready to Use Templates
  • Courses
  • Academy
    • Excel + AI Mastery: 100 Formulas
    • Excel Pivot Tables & Dashboards
  • About Us
  • Contact Us

PK: An Excel Expert

Transforming Data into Decisions

Tag: Fintech KPI Dashboard

Dashboard

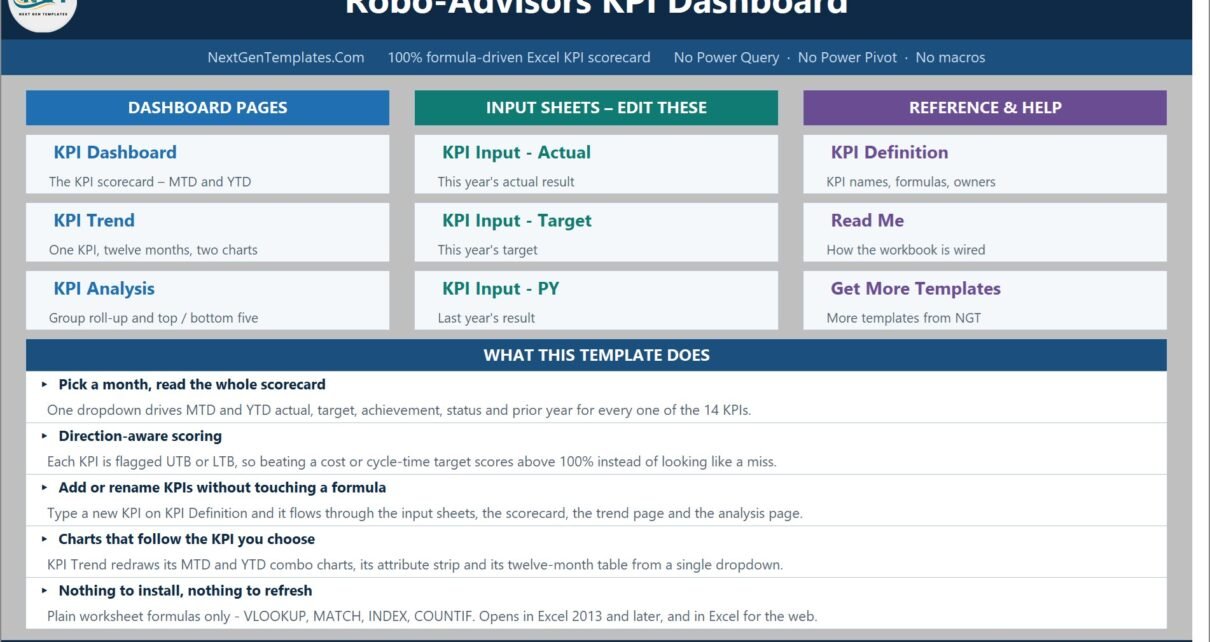
Robo-Advisors KPI Dashboard in Excel

August 21, 2026August 21, 2026 PKComments Off on Robo-Advisors KPI Dashboard in Excel
Running a digital advice business means answering the same question every month: did we hit target, and are we better or worse than last year? The Robo-Advisors KPI Dashboard in
Read More
Dashboard Power BI

Buy-Now-Pay-Later Platforms Dashboard in Power BI

May 14, 2026May 14, 2026 PKComments Off on Buy-Now-Pay-Later Platforms Dashboard in Power BI
The Buy Now Pay Later Dashboard in Power BI tracks 5 portfolio KPIs across 5 interactive Power BI pages, with 16 visuals and native slicers covering platform performance, customer segments,
Read More
Dashboard

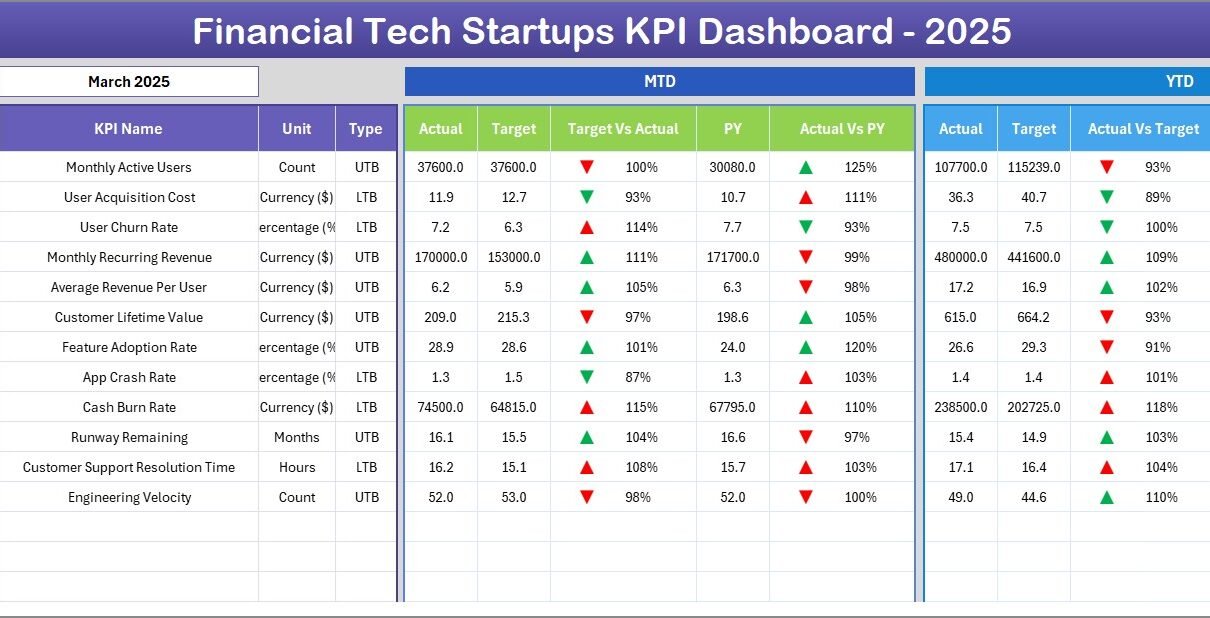
Financial Tech Startups KPI Dashboard in Excel

May 5, 2026May 5, 2026 PKComments Off on Financial Tech Startups KPI Dashboard in Excel
The Financial Tech Startups KPI Dashboard in Excel tracks fintech-specific KPIs across 7 interactive worksheets, with built-in MTD and YTD comparisons, conditional formatting arrows, and individual KPI trend charts. According
Read More
Templates

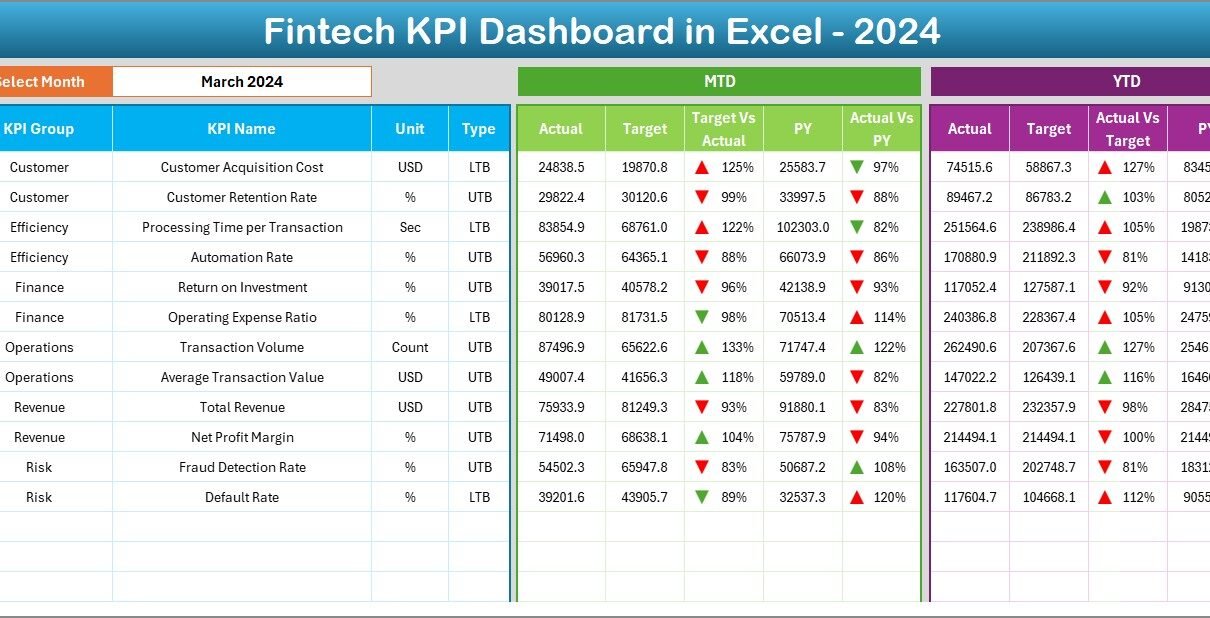
Fintech KPI Dashboard in Excel

November 6, 2025November 6, 2025 PKComments Off on Fintech KPI Dashboard in Excel
In today’s rapidly evolving financial technology (Fintech) landscape, data plays a critical role in driving business growth and operational excellence. Every transaction, customer interaction, and investment decision generates valuable information.
Read More
  • Learn Excel (Free Course)
    • 1. Shortcut Keys
    • 2. Fill & Flash Fill
    • 3. Find & Replace
    • 4. Sort & Filter
    • 5. Formulas & Functions
    • 6. Data Validation
    • 7. Conditional Formatting
    • 8. Basic Charts
    • 9. Advanced Charts
    • 10. Pivot Tables
    • 11. Excel Dashboards
    • 12. VBA Course
    • 13. Excel Formulas with AI
  • Templates
  • Tutorials
    • Charts and Visualization
    • VBA
    • Excel Tips and Tricks
    • Excel Dashboards
    • Power Pivot & DAX
  • Power BI
  • Template Store
    • Ready to Use Templates
  • Courses
  • Academy
    • Excel + AI Mastery: 100 Formulas
    • Excel Pivot Tables & Dashboards
  • About Us
  • Contact Us
Copyright © 2023 PK-AnExcelExpert.com - Privacy Policy