The Buy Now Pay Later Dashboard in Power BI tracks 5 portfolio KPIs across 5 interactive Power BI pages, with 16 visuals and native slicers covering platform performance, customer segments, merchant categories, and monthly trends.Buy-Now-Pay-Later Platforms Dashboard in Power BI The global BNPL market surpassed $309 billion in transaction volume in 2023 and is projected to reach $576 billion by 2026, according to Grand View Research — yet most fintech analysts and lending operations teams still rebuild platform comparison views from scratch every month.
Buy-Now-Pay-Later Platforms Dashboard in Power BI This template gives BNPL operations managers, credit risk teams, and finance controllers a refresh-and-go Power BI report covering Total GMV, Default Rate, Repayment Rate, and Total Outstanding across multiple BNPL providers. Setup takes under 10 minutes — open the .pbix file in Power BI Desktop, point Power Query at your own SQL Server, Snowflake, or Excel source, click Refresh, and every visual updates automatically.
👉 Click here to Purchase the Buy Now Pay Later Dashboard in Power BI
Key Features of the Buy Now Pay Later Dashboard in Power BI
- 5 KPI Cards on the Overview Page — Total Transactions, Total GMV, Total Approved, Total Outstanding, and Total Late Fees give an instant read on portfolio health.
- 16 interactive Power BI visuals across 5 pages covering platform comparison, customer risk, merchant analytics, and monthly trends.
- Native Power BI slicers on every page for one-click filtering by platform, channel, customer segment, payment plan, or month.
- Power BI Desktop compatible — works in the free version from Microsoft; Pro license only needed for publishing to Power BI Service.
- Plug into your own data — Power Query supports SQL Server, Snowflake, BigQuery, Excel, CSV, and SharePoint without DAX rewrites.
- One-time purchase — instant download, lifetime access, no per-user fees.
Dashboard Pages Explanation
1. Overview Page
The Overview page leads with five KPI cards: Total Transactions, Total GMV, Total Approved, Total Outstanding, and Total Late Fees. Below the cards, four charts cover Total GMV by Platform, Repayment Rate, Default Rate by Channel, and Total GMV and Total Approved by Month Name. This page answers the executive question: how is the BNPL portfolio performing across all providers right now?
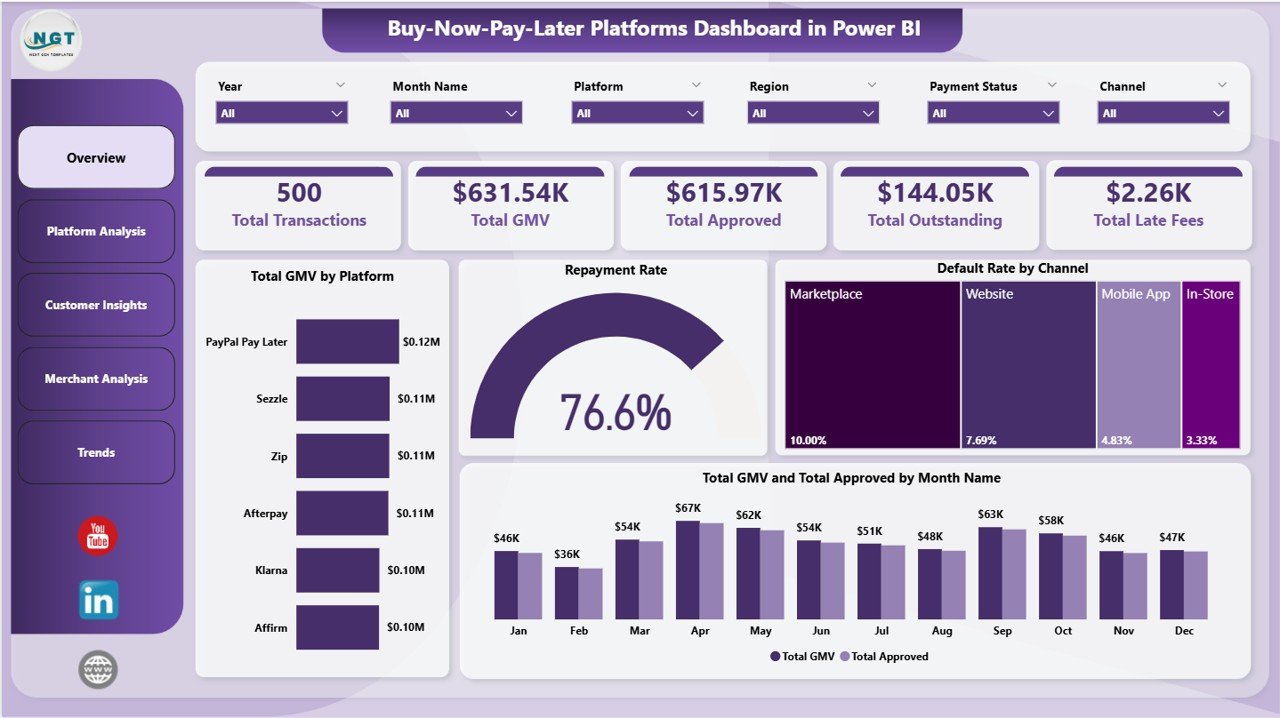
Overview Page
2. Platform Analysis
Three platform-focused visuals comparing BNPL provider performance side by side: Total Outstanding by Platform shows the current book balance per provider; Default Rate by Platform flags which platforms generate the highest delinquency; Total Approved by Platform ranks providers by approved loan volume. Together these answer which platform partnerships are profitable and which carry the most risk.

Platform Analysis
3. Customer Insights
Three customer-focused analytics for credit risk and marketing teams. Avg Order Value by Age Group reveals which demographics drive the highest ticket sizes. Default Rate by Default Risk validates whether the credit scoring model is correctly stratifying borrowers. Total GMV by Customer Segment compares volume across customer tiers (new, returning, premium, at-risk) for retention and acquisition planning.
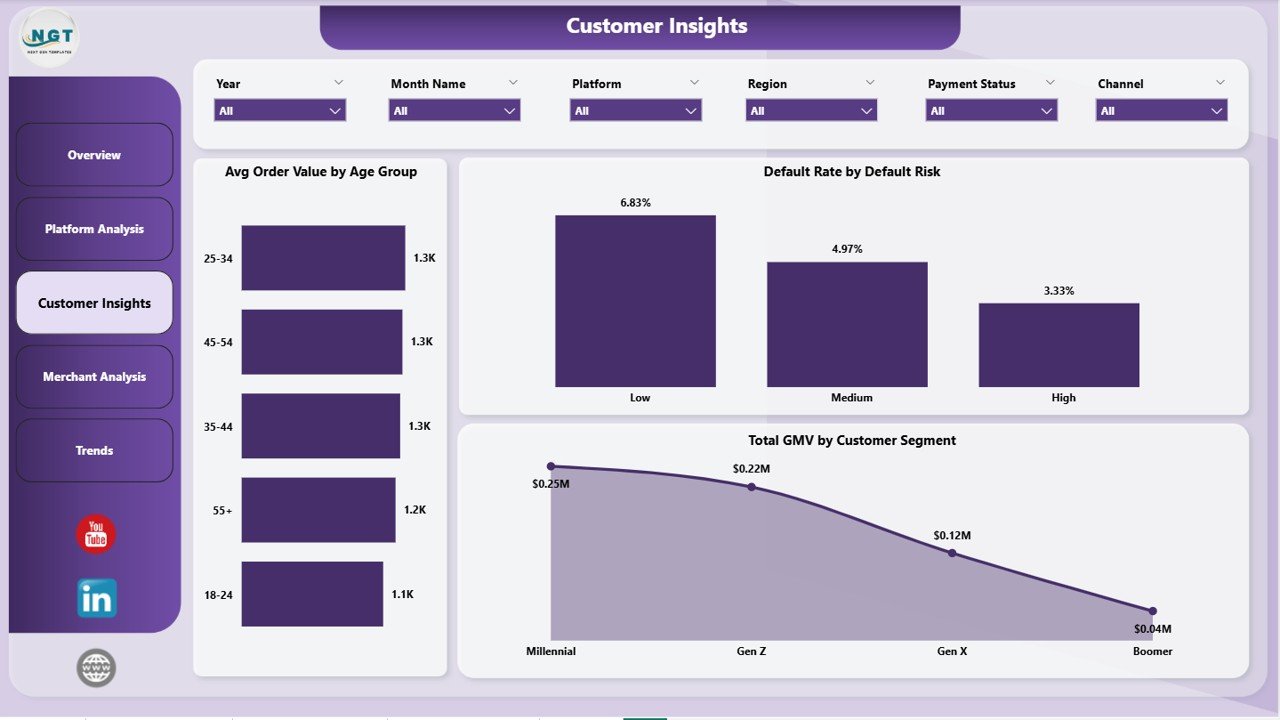
Customer Insights
4. Merchant Analysis
Three merchant- and channel-focused analytics for commercial teams. Total Outstanding by Product Category maps which product types carry the longest repayment tails. Total GMV by Merchant Category shows which retail verticals (fashion, electronics, home) generate the most BNPL volume. Total GMV and Total Approved by Channel reveals where approval rates are tight and pipeline is being left on the table.
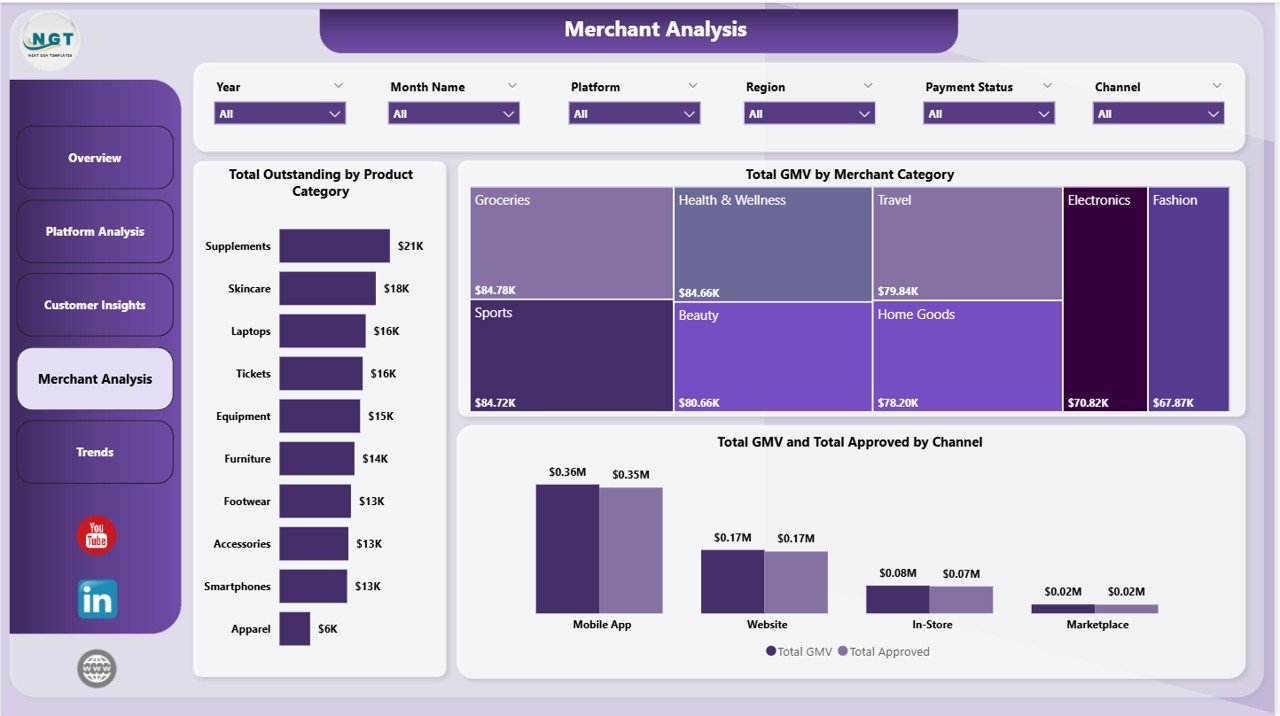
Merchant Analysis
5. Trends
Three longitudinal trend charts. Total Transactions by Platform shows seasonal patterns and growth trajectories per provider. Total Transactions by Month Name tracks the baseline volume KPI for executive reports. Total Outstanding by Month Name reveals whether the portfolio is growing, plateauing, or de-risking — critical input for treasury and provisioning forecasts.
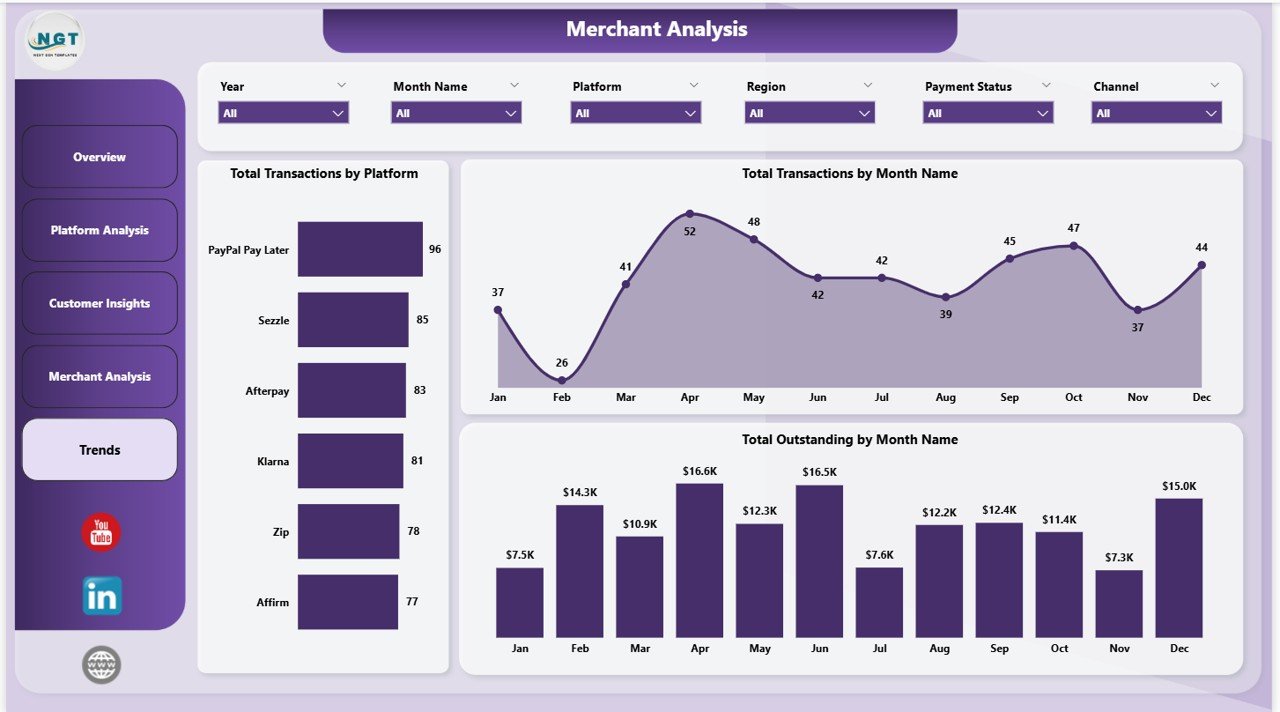
Trends
Buy Now Pay Later Dashboard in Power BI vs. Tableau/Qlik vs. Paid Fintech SaaS — Feature Comparison
| Feature | Buy Now Pay Later Dashboard in Power BI | Tableau / Qlik BNPL Build | Stripe / Afterpay / Paid Fintech SaaS |
|---|---|---|---|
| Cost | $17.99 one-time | $15–$75 / user / month + build time | $200–$2,000+ / month |
| Platform | Power BI Desktop (free) | Tableau Desktop / Qlik Sense (paid) | Cloud SaaS (vendor-hosted) |
| Setup time | Under 10 minutes | Days to weeks | Days to weeks (API integration) |
| Platform comparison analytics | ✅ Pre-built (3 visuals) | ⚠ Build yourself | ✅ Built-in (vendor-specific) |
| Customer risk analytics | ✅ Default risk + age group | ⚠ Build yourself | ✅ Built-in |
| Default Rate by Channel | ✅ Pre-built | ❌ Not included | ✅ Built-in |
| Connect to your own data source | ✅ SQL, Snowflake, Excel, CSV | ✅ Most sources | ❌ Locked to vendor data |
| Year-1 cost at 5 users | $17.99 total | $900–$4,500+ | $2,400–$24,000+ |
For fintech teams that want platform, customer, and merchant analytics without paying SaaS subscription fees or building from a blank Power BI canvas, this template sits in the sweet spot.
Who Should Use This Template
Perfect for:
- BNPL operations managers tracking multi-platform portfolio performance in Power BI
- Credit risk analysts monitoring default rates and repayment trends by customer segment
- Finance controllers at lending fintechs building monthly board-ready reports
- Product managers benchmarking payment plan adoption and merchant category GMV
- BI developers and consultants delivering BNPL reviews to lender clients
Not a fit if:
- You need real-time API integration with core lending systems like Mambu or Finastra
- You don’t have access to Power BI Desktop — consider the Excel version of this BNPL Dashboard instead
- You need live streaming transaction data — this is a refresh-based model, not a real-time feed
Real-World Use Cases
Ananya leads risk operations at a mid-size BNPL fintech with partnerships across 4 lending platforms. Each month she refreshes the Buy Now Pay Later Dashboard in Power BI against her data warehouse, opens the Platform Analysis page, and presents Default Rate by Platform and Total Outstanding by Platform to the Chief Risk Officer. The dashboard immediately shows which platforms are running the highest default rates and where the book balance is growing fastest. The reporting cycle she used to spend half a day on now takes 20 minutes.
Marcus is a credit analyst at a consumer finance company that recently launched a BNPL product line. He uses the Customer Insights page to validate that the credit scoring model is stratifying default risk correctly — the Default Rate by Default Risk visual confirms high-risk customers are defaulting at 3x the rate of low-risk borrowers, exactly as the model predicts. He exports the visual directly into the quarterly credit committee deck.
Priya is a commercial manager at a payments group running BNPL merchant partnerships. She uses the Merchant Analysis page to show retail partners that fashion and electronics categories generate the highest GMV. This data directly informs which merchant categories her team prioritizes for the next partnership renewal cycle.
Advantages of the Buy Now Pay Later Dashboard in Power BI
- Saves 80% of monthly reporting time — replace 6 hours of manual visual building with a 10-minute refresh.
- No subscription costs — $17.99 once vs. $2,400 to $24,000 per year for paid fintech analytics SaaS.
- Cross-platform comparison — consolidates Afterpay, Klarna, Affirm, Zip, and your internal platforms in one view, which native vendor reporting can’t.
- Full editorial control — you own the .pbix file and can adjust DAX, visuals, themes, and color schemes to match brand guidelines.
- Power BI Service ready — publish to web for browser-based sharing with scheduled refresh.
Opportunities for Improvement
To be transparent — this template ships with sample data and a default semantic model. Teams with very large portfolios (10M+ rows per month) may want to switch to DirectQuery or Power BI Premium with incremental refresh for better performance. The dashboard does not include forecasting visuals (ARIMA, exponential smoothing) out of the box — those need to be added through Power BI’s analytics pane or R/Python visuals. Real-time refresh requires a Pro/Premium license and a configured data gateway. These are standard Power BI considerations rather than limitations specific to this template, but worth knowing before deployment.
Best Practices
- Standardize platform names in your source data before refresh — inconsistent spellings (“Afterpay” vs “AfterPay”) will create duplicate slicer entries.
- Use a date dimension table for the Month Name visuals — gives you correct chronological sorting (Jan, Feb, Mar) instead of alphabetical (Apr, Aug, Dec).
- Set the credit score band buckets in Power Query (300–579, 580–669, 670–739, 740–799, 800+) rather than in DAX — faster and easier to maintain.
- Bookmark the executive view with platform and segment slicers pre-applied so leadership lands on the right cut of data.
- Schedule refresh in Power BI Service if you publish — daily refresh is enough for monthly portfolio reporting; intraday only matters if you’re tracking origination flow.
Explore Relevant Templates
- Buy-Now-Pay-Later Platforms Dashboard in Excel — same 5-page structure built on native Excel pivot tables and slicers, for teams that prefer Excel over Power BI.
- Credit Union Dashboard in Power BI — branch, loan, and member analytics for community lenders.
- Business Angel Networks Dashboard in Power BI — deal flow, portfolio returns, and geographic analysis.
- Banking Report in Excel — branch-level banking performance with High Risk Transaction analysis.
- Browse all Power BI Dashboard Templates on NextGenTemplates.
Frequently Asked Questions
What KPIs does the Buy Now Pay Later Dashboard in Power BI track?
The Buy Now Pay Later Dashboard in Power BI tracks 5 headline KPIs: Total Transactions, Total GMV, Total Approved, Total Outstanding, and Total Late Fees. It also delivers 16 breakdown visuals across platform performance, customer risk, merchant analytics, and monthly trends. All metrics update automatically when you refresh the underlying data source.
How long does setup take for the BNPL Dashboard in Power BI?
Setup takes under 10 minutes. Open the .pbix file in Power BI Desktop, repoint Power Query at your own data source while keeping the column names aligned, and click Refresh. Every visual, KPI card, and slicer across all 5 pages updates automatically — no DAX rewrites needed for the default views.
Does the Buy Now Pay Later Dashboard in Power BI require a paid Power BI license?
No. The dashboard works in Power BI Desktop, which is free from Microsoft. A Power BI Pro or Premium license is only needed if you want to publish the report to the Power BI Service for browser-based sharing and scheduled refresh across your team.
How does this compare to Stripe or Afterpay native reporting?
Native BNPL platform reporting is locked to a single provider and rarely supports cross-platform comparison. The Buy Now Pay Later Dashboard in Power BI consolidates data from multiple providers in one report, costs $17.99 once, and gives you full control over visuals, slicers, and DAX — without per-user fees or monthly subscriptions.
Can I connect this Power BI dashboard to my own SQL Server or Snowflake data?
Yes. The dashboard uses Power Query as its data layer, so you can switch the source to SQL Server, Snowflake, BigQuery, Excel, CSV, SharePoint, or any native Power BI source. Keep your column names aligned with the model and the visuals continue to render correctly.
Can I add my own BNPL platforms, merchant categories, or payment plans?
Yes. The dashboard reads dimensions from your data source — add any platform names, merchant categories, or payment plan types as column values and click Refresh. The slicers and visuals automatically include the new dimensions without any DAX changes.
Will the dashboard handle 1 million transaction rows?
Yes. The Buy Now Pay Later Dashboard in Power BI handles 1M+ rows comfortably in Import mode on a standard business laptop. For 10M+ rows, switch to DirectQuery against your warehouse or use Power BI Premium with incremental refresh for optimal performance.
About the Author
Built by PK — Microsoft Certified Professional with 15+ years of Excel, Google Sheets, and Power BI experience. Founder of NextGenTemplates, reaching 300K+ subscribers across YouTube channels. Every template is hand-built and tested before release.
Conclusion
The Buy Now Pay Later Dashboard in Power BI gives BNPL operations, risk, and finance teams a refresh-and-go reporting layer that replaces 6 hours of monthly visual building with a 10-minute refresh — for $17.99 one-time instead of $200–$2,000 per month in fintech SaaS subscriptions. 5 KPIs, 16 visuals, 5 pages, native slicers, and full Power Query connectivity to your existing data warehouse.
👉 Click here to Purchase the Buy Now Pay Later Dashboard in Power BI
✅ Instant download · One-time payment · No subscription · Lifetime access
🎬 Visit our YouTube channel for step-by-step video tutorials: Youtube.com/@PK-AnExcelExpert
📅 Last updated: May 2026