The global Buy Now Pay Later market surpassed $309 billion in gross merchandise volume in 2023 and is forecast to reach $576 billion by 2026 — a 186% growth trajectory driven by consumers in the 25–44 age bracket who now use BNPL for purchases ranging from $30 fashion items to $2,000 electronics. Yet most BNPL operations teams, credit risk analysts, and fintech controllers still track platform performance, default rates, and outstanding balances in disconnected spreadsheets that take hours to update every reporting cycle. The Buy-Now-Pay-Later Platforms Dashboard in Excel consolidates 5 headline KPIs and 16 pivot-driven charts across 5 interactive pages into a single file that refreshes in one click, giving teams the platform-level and customer-level visibility they need without paying SaaS subscription fees.
Click here to Purchase the Buy-Now-Pay-Later Platforms Dashboard in Excel
According to Microsoft’s Excel documentation, native pivot tables can process up to 1 million rows — more than enough for most BNPL portfolio sizes — without requiring Power Query, Power Pivot, or any add-in. This dashboard exploits exactly that: clean pivot architecture, slicer-based filtering, and a hidden Support sheet that keeps the working pivot tables out of sight while the five analysis pages stay polished and presentation-ready.
Key Features of the Buy-Now-Pay-Later Platforms Dashboard in Excel
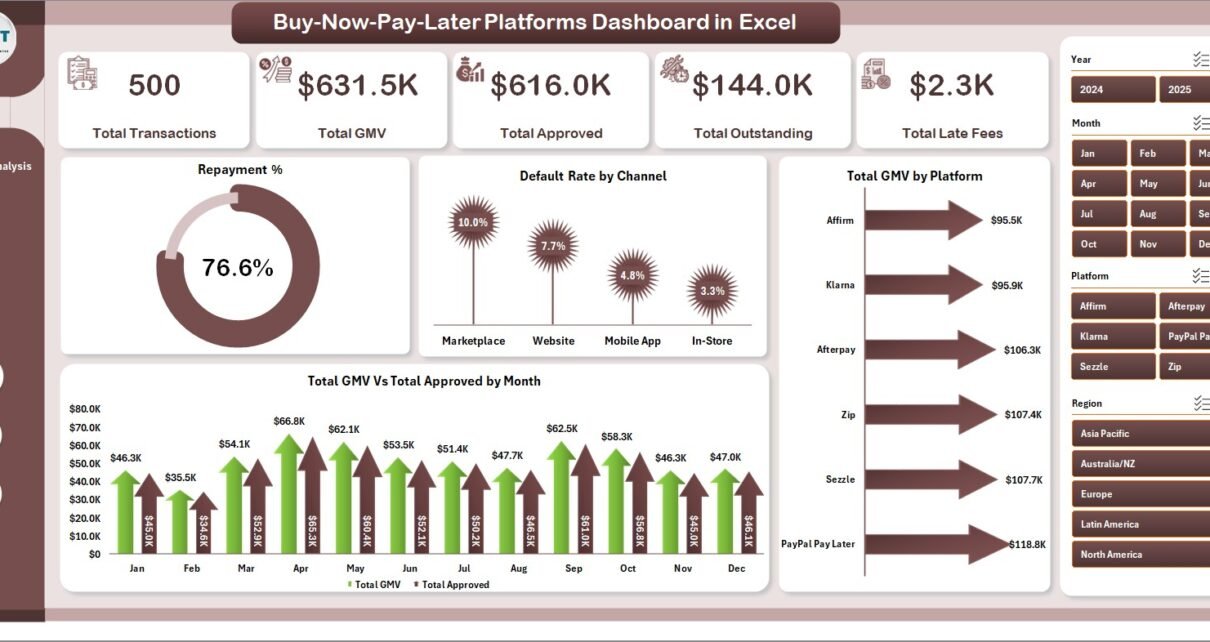
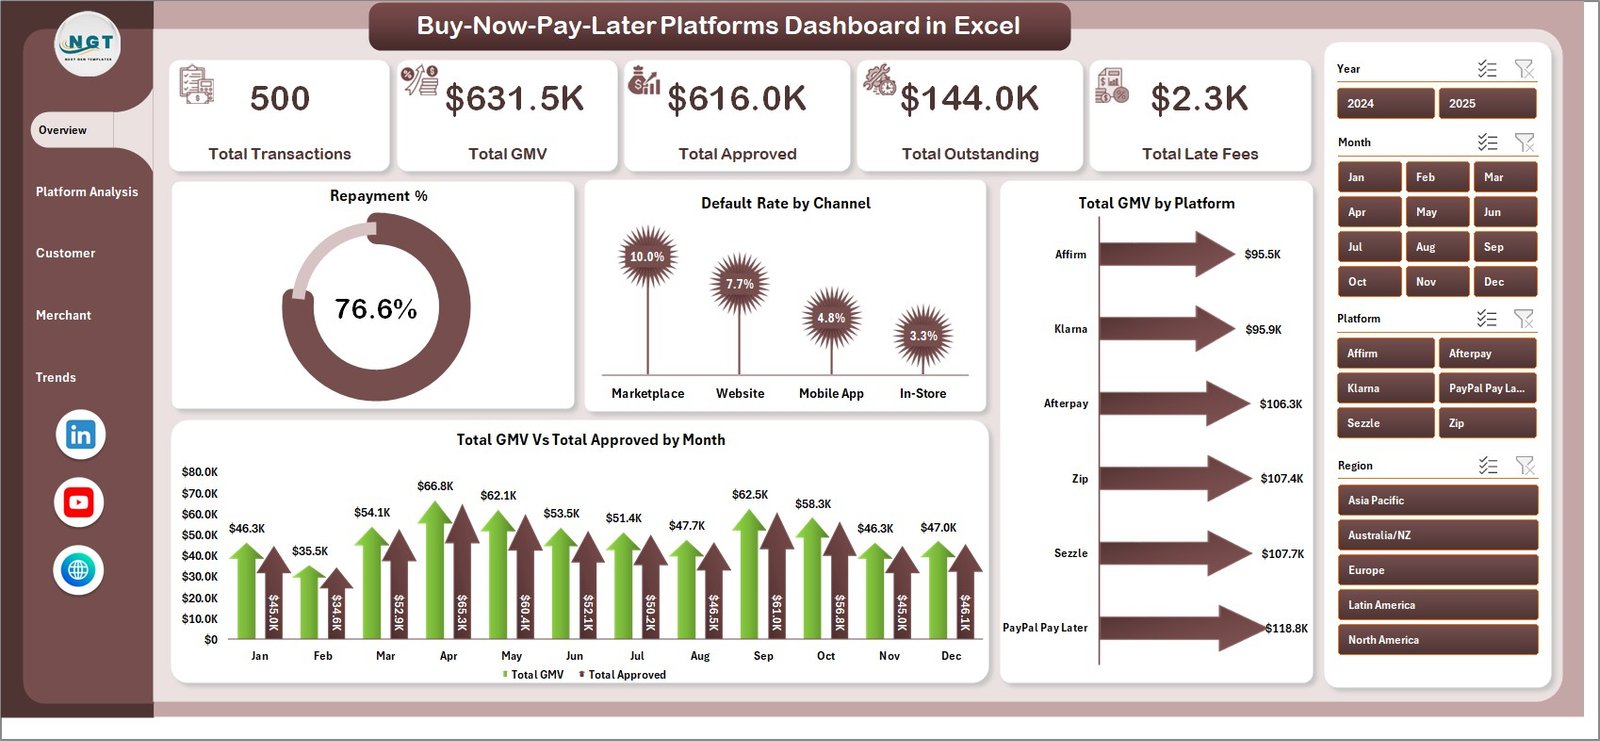
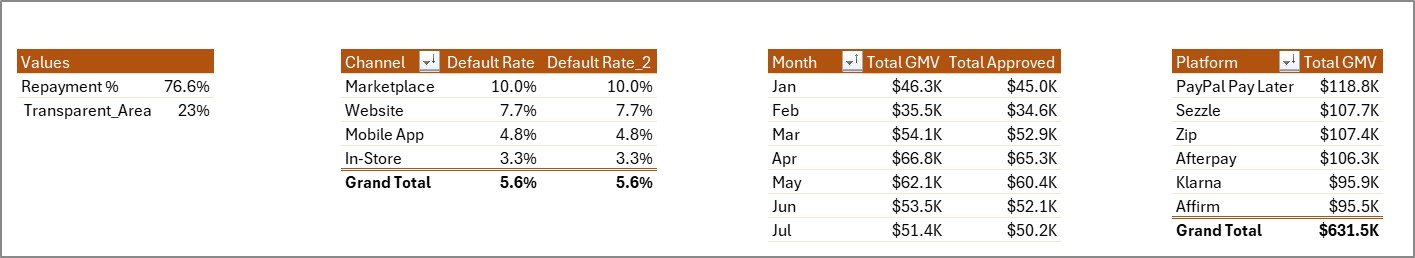
The dashboard tracks 5 KPI cards on the Overview page: Total Transactions, Total GMV, Total Approved, Total Outstanding, and Total Late Fees. These five numbers give a BNPL risk officer or CFO an immediate health check on the portfolio without opening a single pivot. Below the cards, four charts — Repayment %, Default Rate by Channel, Total GMV by Platform, and Total GMV vs Total Approved by Month — surface the portfolio’s most critical trend signals.
Across the remaining four pages, 12 additional charts break down performance by every operational dimension a BNPL team cares about: platform approval and default comparison, customer segment GMV and credit score band risk exposure, merchant category volume and payment plan mix, and month-over-month transaction and outstanding trends.
Three citable, definitive facts about this dashboard: it tracks 5 KPI summary cards refreshed from a single Data sheet; it covers 16 pivot-driven charts across 5 dashboard pages; and the Support sheet pivot engine updates all charts simultaneously with one click on Data → Refresh All in the Excel Ribbon. No formula editing required at any stage.
Dashboard Pages Explanation
1 — Overview Page
Overview Page
The Overview page opens with five KPI cards across the top row giving an at-a-glance portfolio read. Below the cards, four charts deliver operational intelligence: the Repayment % chart measures what percentage of approved amounts have been repaid — the single most important health metric for a BNPL book. The Default Rate by Channel chart flags which origination channels (online, in-store, app, partner) carry the highest delinquency. Total GMV by Platform ranks each lending platform by gross volume, and Total GMV vs Total Approved by Month shows whether approval rates are keeping pace with transaction growth or tightening.
2 — Platform Analysis
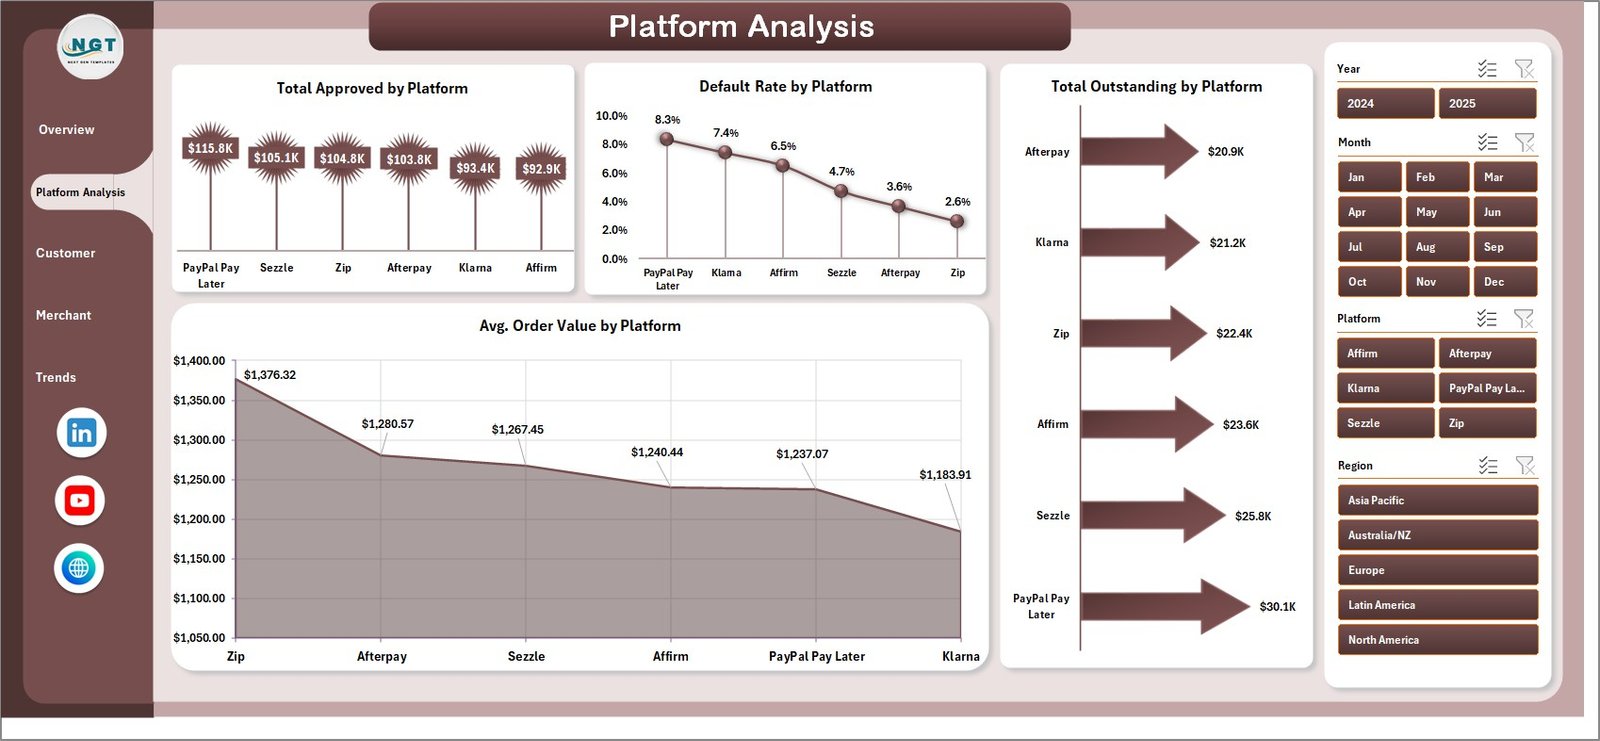
Platform Analysis
The Platform Analysis page compares all BNPL providers across four performance dimensions: Total Approved by Platform ranks providers by approved loan volume for channel mix optimization; Default Rate by Platform identifies which platforms carry the highest delinquency rates; Total Outstanding by Platform shows current book balance per provider for provisioning and treasury planning; and Avg. Order Value by Platform benchmarks ticket size to guide underwriting policy by channel.
3 — Customer Insights
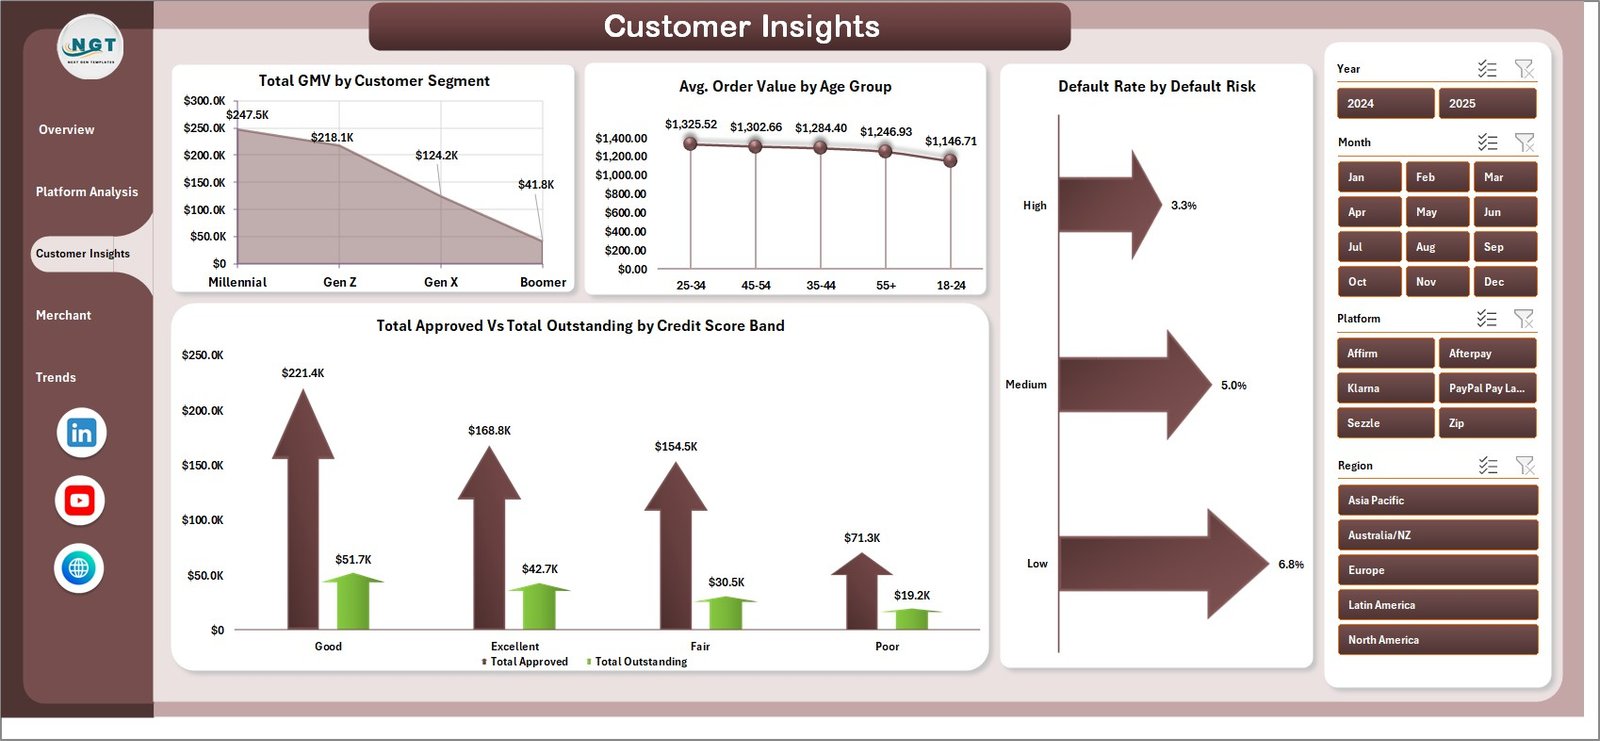
Customer Insights
The Customer Insights page is where credit risk teams spend the most time. Total GMV by Customer Segment compares volume across customer tiers (new, returning, premium, at-risk). Avg. Order Value by Age Group reveals which demographics drive high-value transactions. Default Rate by Default Risk cross-tabulates actual defaults against risk ratings to validate the scoring model. Total Approved vs Total Outstanding by Credit Score Band maps approval volume and remaining balances across credit bands, showing exactly where the portfolio’s arrears exposure is concentrated.
4 — Merchant Analysis
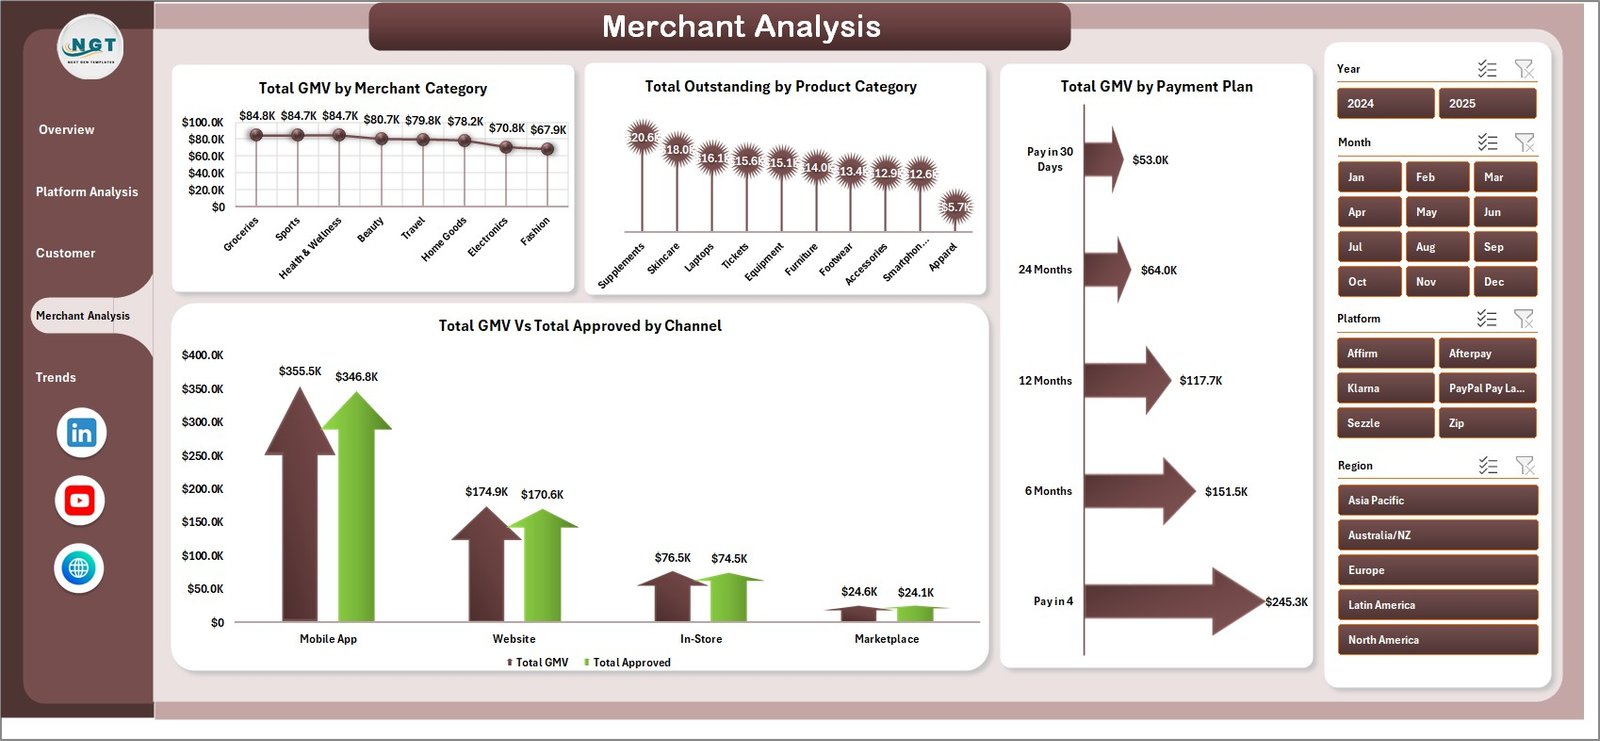
Merchant Analysis
The Merchant Analysis page serves commercial and product teams. Total GMV by Merchant Category shows which retail verticals generate the most BNPL volume. Total Outstanding by Product Category maps balance concentration across product types to flag which categories carry the longest repayment tails. Total GMV by Payment Plan compares installment structures (Pay-in-4, Pay-in-6, Pay-in-12, Pay-in-24) to identify the most-used tenor. Total GMV vs Total Approved by Channel highlights where approval rates are tightest and pipeline is being left behind.
5 — Trends
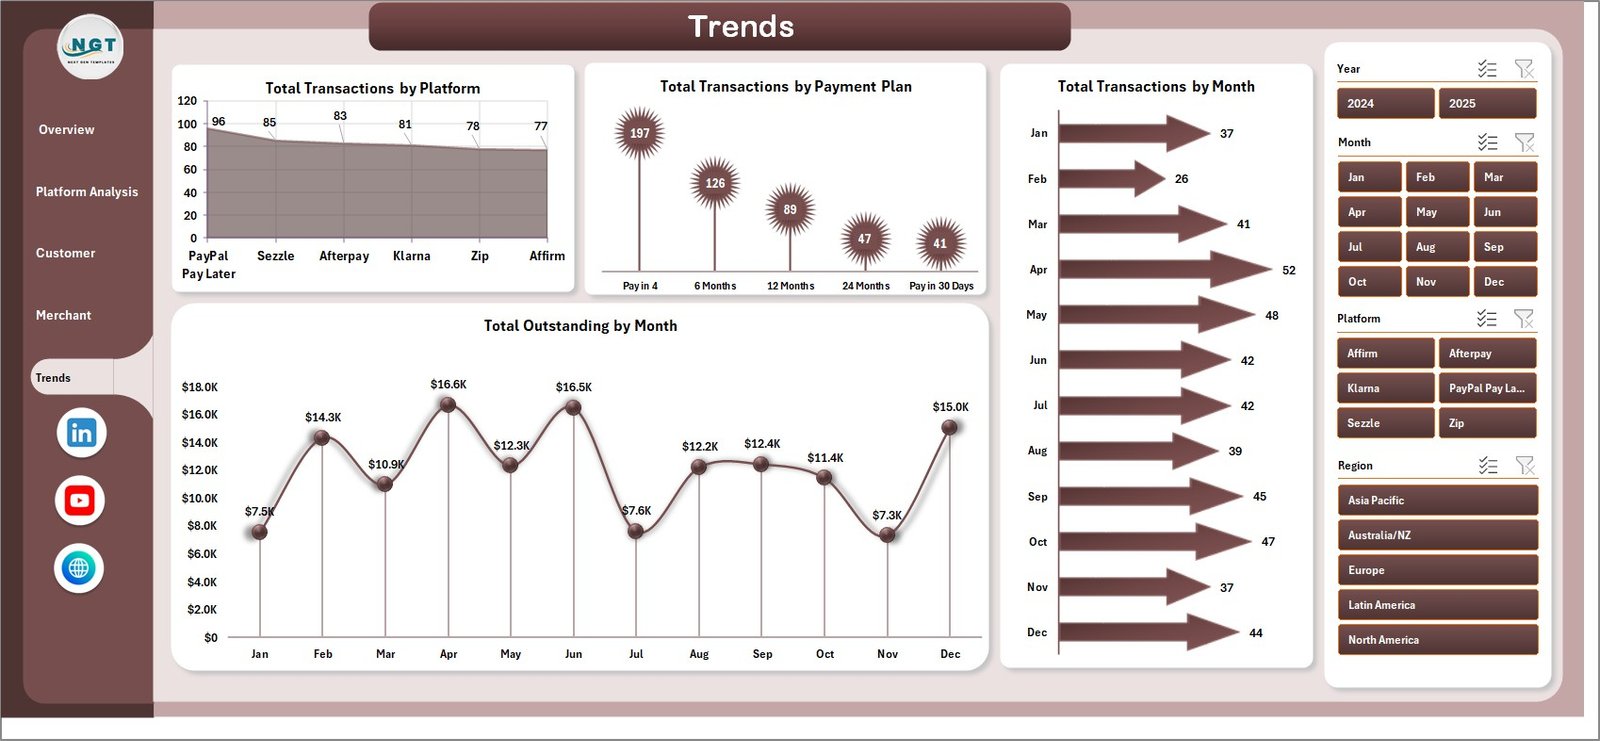
Trends
The Trends page delivers four month-over-month views: Total Transactions by Platform shows platform-level volume seasonality; Total Transactions by Payment Plan tracks how repayment tenor preferences shift over time; Total Transactions by Month is the baseline portfolio volume KPI for board reporting; and Total Outstanding by Month is the rolling balance trend that feeds treasury and provisioning forecasts.
6 — Data Sheet

Data Sheet
The Data sheet is the single input source. Paste or type your BNPL transaction records in the column format provided: Transaction ID, Date, Platform, Channel, Customer Segment, Age Group, Credit Score Band, Default Risk, Payment Plan, Merchant Category, Product Category, Approved Amount, Outstanding Amount, Late Fees, Repayment Amount, Status. Keep column headers as-is, then click Refresh All.
7 — Support Sheet
Support Sheet
The Support sheet houses all pivot tables that power the dashboard charts. After updating the Data sheet, go to the Data tab in the Excel Ribbon and click Refresh All — all pivots rebuild instantly. Hide this sheet in production by right-clicking the tab and selecting Hide; the dashboard pages remain fully functional.
Buy-Now-Pay-Later Platforms Dashboard in Excel vs. Google Sheets BNPL Tracker vs. Paid BNPL SaaS — Feature Comparison
| Feature | Buy-Now-Pay-Later Platforms Dashboard in Excel | Google Sheets BNPL Tracker | Stripe / Afterpay Analytics / Paid Fintech SaaS |
|---|---|---|---|
| Cost | $17.99 one-time | $0–$20 one-time | $200–$2,000+ / month |
| Platform | Excel 2016, 2019, 2021, 365 | Google Sheets (browser) | Cloud SaaS (vendor-hosted) |
| Setup time | Under 10 minutes | 15–30 minutes | Days to weeks (API integration) |
| Works offline | ✅ Yes, file-based | ❌ Requires internet | ❌ Cloud only |
| Platform comparison analytics | ✅ 4 dedicated charts | ⚠️ Manual build | ✅ Built-in |
| Customer risk analytics | ✅ Credit score band + age group | ⚠️ Build yourself | ✅ Built-in |
| Default Rate by Channel | ✅ Pre-built | ❌ Not included | ✅ Built-in |
| Slicer-based filtering | ✅ Multiple slicers per page | ❌ Manual filter views only | ✅ Built-in (at cost) |
| Year-1 cost at 5 users | $17.99 total | $0–$100 | $2,400–$24,000+ |
For fintech analysts and BNPL operations teams that need platform, customer, and merchant analytics without paying SaaS subscription fees, the Buy-Now-Pay-Later Platforms Dashboard in Excel sits in the sweet spot.
Who Should Use This Template
Perfect for:
- BNPL operations managers and fintech analysts tracking multi-platform portfolio performance
- Credit risk teams monitoring default rates, repayment trends, and outstanding balances by customer segment
- Finance controllers at lending fintechs building monthly board-ready performance reports
- Product managers benchmarking payment plan adoption and merchant category GMV
- Consultants and analysts delivering BNPL performance reviews to lender clients
Not a fit if:
- Your BNPL platform requires real-time API integration with core lending systems (Mambu, Finastra, etc.)
- You need live streaming transaction data rather than a refresh-based model
- You don’t have Microsoft Excel 2016 or later installed
Real-World Use Cases
Ananya leads risk operations at a mid-size BNPL fintech with partnerships across 4 lending platforms. Each month she exports transaction data from the core system into the Buy-Now-Pay-Later Platforms Dashboard in Excel, clicks Refresh All, and presents the Platform Analysis page to the Chief Risk Officer showing which platforms carry the highest default rates and where outstanding balances are growing fastest. The entire reporting cycle takes 20 minutes instead of a full day of manual pivot work.
Marcus is a credit analyst at a consumer finance company that recently launched a BNPL product line. He uses the Customer Insights page to validate that the credit scoring model is correctly stratifying default risk. The Default Rate by Default Risk chart confirms high-risk customers are defaulting at 3x the rate of low-risk borrowers, exactly as the model predicts. He exports the chart directly into the quarterly credit committee presentation.
Priya is a commercial manager at a payments group responsible for BNPL merchant partnerships. She uses the Merchant Analysis page to demonstrate that fashion and electronics categories generate the highest GMV, and that Pay-in-4 plans drive 62% of all volume — data that directly informed her team’s decision to promote shorter tenors in the next merchant agreement renewal cycle.
Advantages of the Buy-Now-Pay-Later Platforms Dashboard in Excel
- No subscription — a one-time $17.99 purchase vs. $200–$2,000/month for fintech SaaS analytics
- Works offline — Excel file-based reporting doesn’t require internet access or cloud connectivity
- Full customization — add new platforms, merchant categories, or payment plans by extending the Data sheet columns
- 5-page structured analysis — each page answers a distinct operational question, making stakeholder reports self-contained
- Ready-to-use architecture — 16 pre-built charts save 8–12 hours of pivot table and chart construction work
Opportunities for Improvement
- The dashboard is a static/refresh-based model and does not support real-time streaming data from core BNPL systems
- Cross-page slicer synchronization requires manual Report Connections setup if you add new pivot tables
- Power BI version not yet available — if you need drill-through navigation or DAX measures, the Excel version is the current primary option
Best Practices
- Export transaction data from your BNPL system at the same cadence (weekly or monthly) and paste into the Data sheet in one batch — Refresh All rebuilds everything in under 5 seconds for portfolios under 100,000 rows
- Keep the Support sheet hidden in shared files — right-click the tab and select Hide so analysts only see the five analysis pages and the Data entry tab
- Use the slicers for scenario analysis: filter by a single platform or credit score band to isolate specific portfolio segments for risk presentations
- Archive a monthly snapshot by saving a copy of the file with the reporting month in the filename before replacing the Data sheet content
Explore Relevant Templates
📌 Credit Union Dashboard in Excel — 19 pivot-driven charts covering branch, loan type, member, and channel analytics for credit union managers.
📌 Banking Report in Excel — branch-level banking performance with High Risk Transaction % analysis, service fee tracking, and slicer filtering.
📌 Business Angel Networks Dashboard in Excel — deal flow, portfolio returns, and geographic analysis across 5 pages for angel investors and fintech lenders.
📌 Browse all Excel Dashboard Templates on NextGenTemplates for the full Finance analytics library.
Frequently Asked Questions
What KPIs does the Buy-Now-Pay-Later Platforms Dashboard in Excel track?
The Buy-Now-Pay-Later Platforms Dashboard in Excel tracks 5 headline KPIs: Total Transactions, Total GMV, Total Approved, Total Outstanding, and Total Late Fees. It also delivers 16 breakdown charts across platform performance, customer risk, merchant analytics, and monthly trends. All metrics update automatically when you replace sample data and click Refresh All.
How long does setup take for the BNPL Dashboard in Excel?
Setup takes under 10 minutes. Open the file in Excel 2016 or later, paste your BNPL transaction data into the Data sheet keeping the column order intact, and click Refresh All under the Data ribbon. Every chart, KPI card, and slicer across all 5 pages updates automatically — no formula editing required.
Does the Buy-Now-Pay-Later Platforms Dashboard in Excel require any macros or add-ins?
No. The dashboard runs on native Excel pivot tables and slicers — no VBA macros, Power Query, or Power Pivot required. It works in Excel 2016, 2019, 2021, and Microsoft 365 on Windows and Mac.
How does this compare to paid BNPL analytics platforms?
Native BNPL platform analytics are locked to a single provider and lack cross-platform comparison. This dashboard consolidates data from any number of platforms in one Excel file for a one-time $17.99 purchase, giving full metric and layout control without per-user fees or monthly subscriptions.
Can I add my own platforms, merchant categories, or payment plans?
Yes. Add any new values as column entries in the Data sheet and click Refresh All. Slicers and charts automatically include the new dimensions without formula changes.
Will it handle large transaction volumes?
Yes. Native Excel pivot tables handle up to 1 million rows. For portfolios under 500,000 transactions, refresh times typically stay under 5 seconds on a standard business laptop.
Is there a Power BI or Google Sheets version?
This is the Excel release. For browser-based access, explore our Google Sheets Dashboard Templates for Finance-category equivalents.
About the Author
Built by PK — Microsoft Certified Professional with 15+ years of Excel, Google Sheets, and Power BI experience. Founder of NextGenTemplates, reaching 300K+ subscribers across YouTube channels. Every template is hand-built and tested before release.
Conclusion
The Buy-Now-Pay-Later Platforms Dashboard in Excel gives BNPL operations managers, credit risk analysts, and fintech controllers a complete multi-platform portfolio reporting tool in a single Excel file — covering GMV, default rates, outstanding balances, merchant performance, and customer risk across 5 dedicated analysis pages with 16 pivot-driven charts. For teams tracking BNPL performance without access to enterprise SaaS analytics, this dashboard delivers the same analytical depth at a one-time cost.
Click here to Purchase the Buy-Now-Pay-Later Platforms Dashboard in Excel
👉 Instant download · One-time payment · No subscription
🎥 Visit our YouTube channel for step-by-step video tutorials
👉 Youtube.com/@PK-AnExcelExpert
📅 Last updated: May 2026