New: NextGenTemplates Academy - video courses on Excel formulas with AI and Pivot Tables & dashboards. Early-bird: 20% off with code EARLYBIRD20 - first 20 orders only. See the courses →
  • Learn Excel (Free Course)
    • 1. Shortcut Keys
    • 2. Fill & Flash Fill
    • 3. Find & Replace
    • 4. Sort & Filter
    • 5. Formulas & Functions
    • 6. Data Validation
    • 7. Conditional Formatting
    • 8. Basic Charts
    • 9. Advanced Charts
    • 10. Pivot Tables
    • 11. Excel Dashboards
    • 12. VBA Course
    • 13. Excel Formulas with AI
  • Templates
  • Tutorials
    • Charts and Visualization
    • VBA
    • Excel Tips and Tricks
    • Excel Dashboards
    • Power Pivot & DAX
  • Power BI
  • Template Store
    • Ready to Use Templates
  • Courses
  • Academy
    • Excel + AI Mastery: 100 Formulas
    • Excel Pivot Tables & Dashboards
  • About Us
  • Contact Us

PK: An Excel Expert

Transforming Data into Decisions
Tag: Finance KPI Dashboard

Dashboard Templates

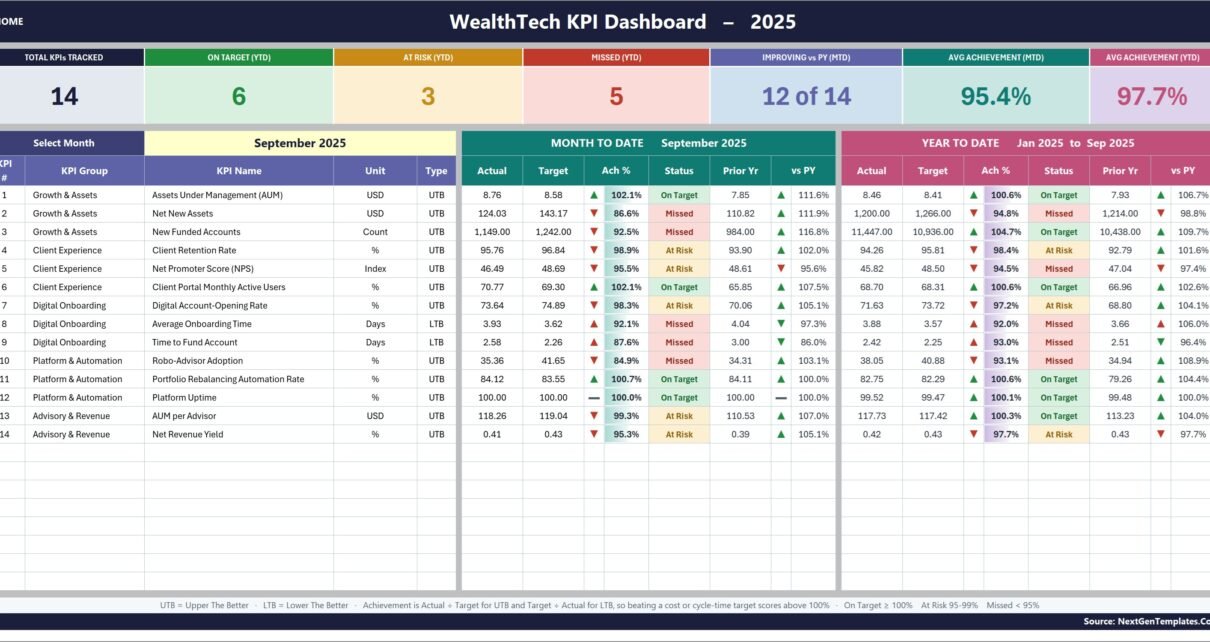
WealthTech KPI Dashboard in Excel

August 21, 2026August 21, 2026 PK0
The WealthTech KPI Dashboard in Excel organizes 14 sample indicators across 5 management groups and 12 months. In one workbook, teams can compare MTD and YTD actuals with targets and
Read More
Dashboard

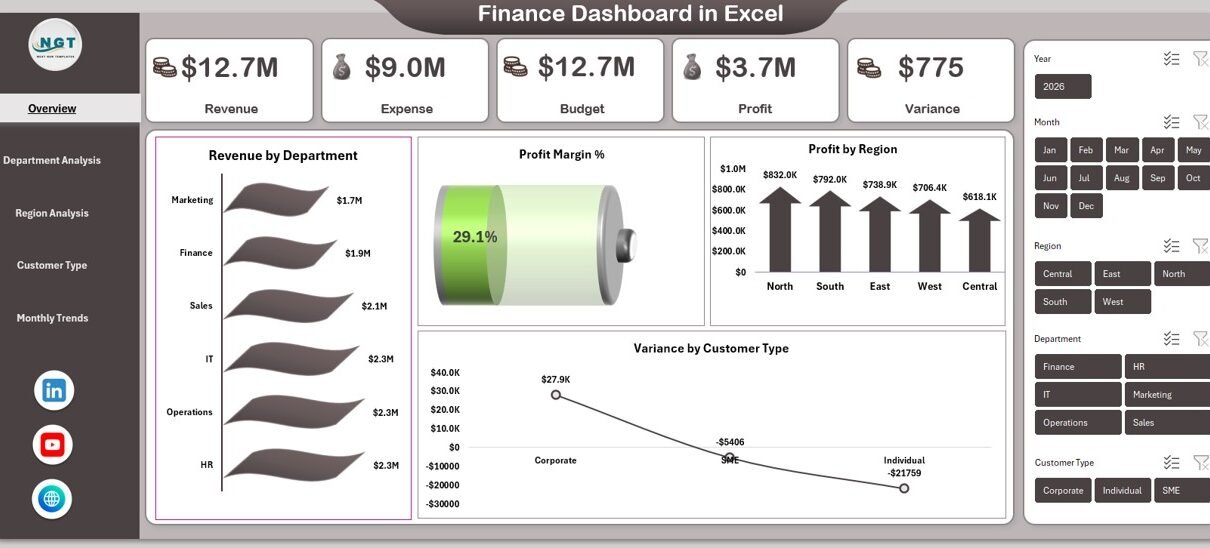
Finance Dashboard in Excel

February 23, 2026February 23, 2026 PKComments Off on Finance Dashboard in Excel
Financial management plays a critical role in every organization, regardless of size or industry. Companies constantly track revenue, expenses, budgets, and profits to ensure sustainable growth. However, many businesses still
Read More
Dashboard Power BI

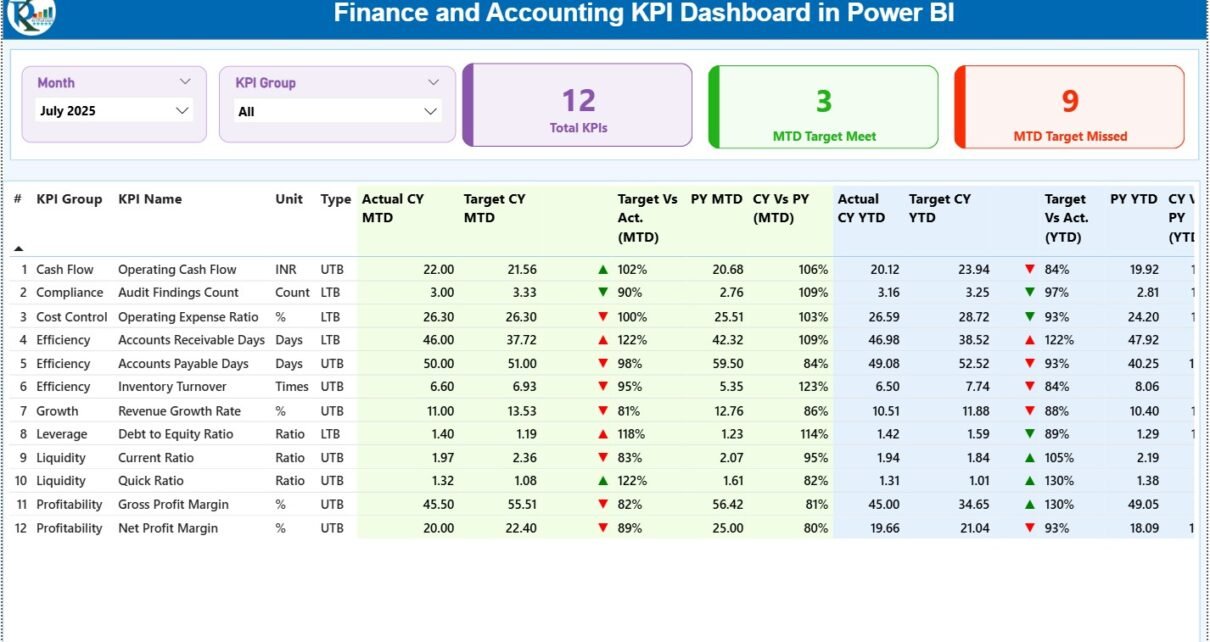
Finance and Accounting KPI Dashboard in Power BI

January 14, 2026January 14, 2026 PKComments Off on Finance and Accounting KPI Dashboard in Power BI
Managing finance and accounting performance has become more complex than ever. Every organization needs real-time visibility into revenue, costs, profitability, and efficiency. However, many finance teams still depend on static
Read More
Dashboard

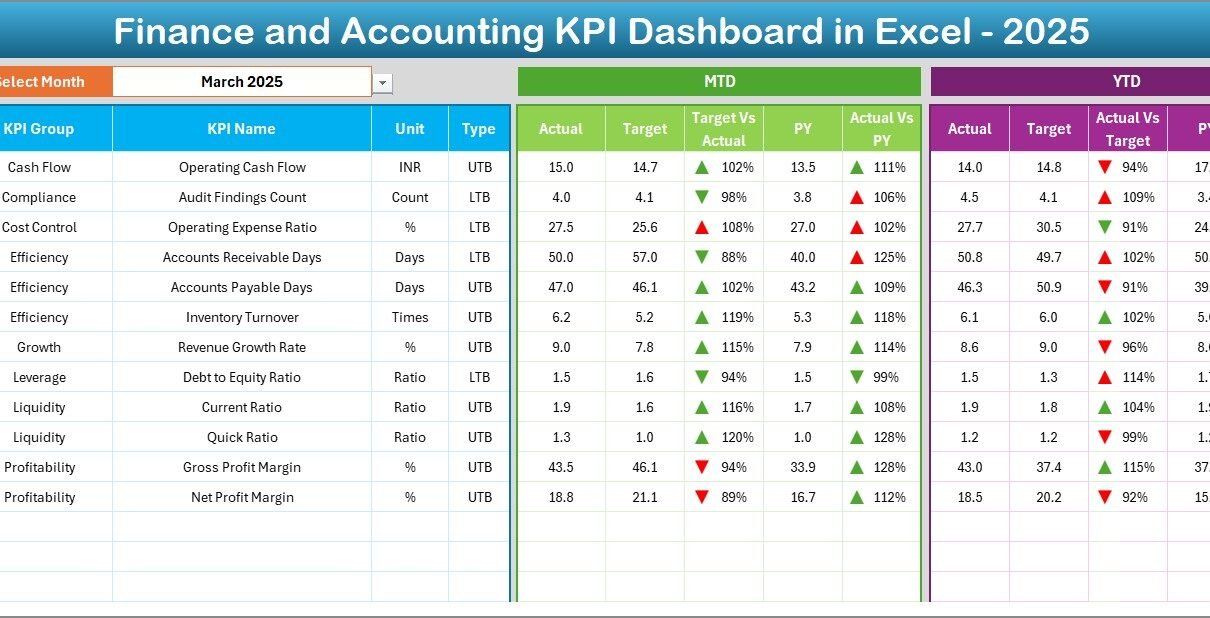
Finance and Accounting KPI Dashboard in Excel

January 14, 2026January 14, 2026 PKComments Off on Finance and Accounting KPI Dashboard in Excel
Managing finance and accounting performance requires accuracy, clarity, and speed. However, many finance teams still rely on scattered Excel files, manual reports, and time-consuming reconciliations. As a result, decision-making often
Read More
Dashboard Power BI

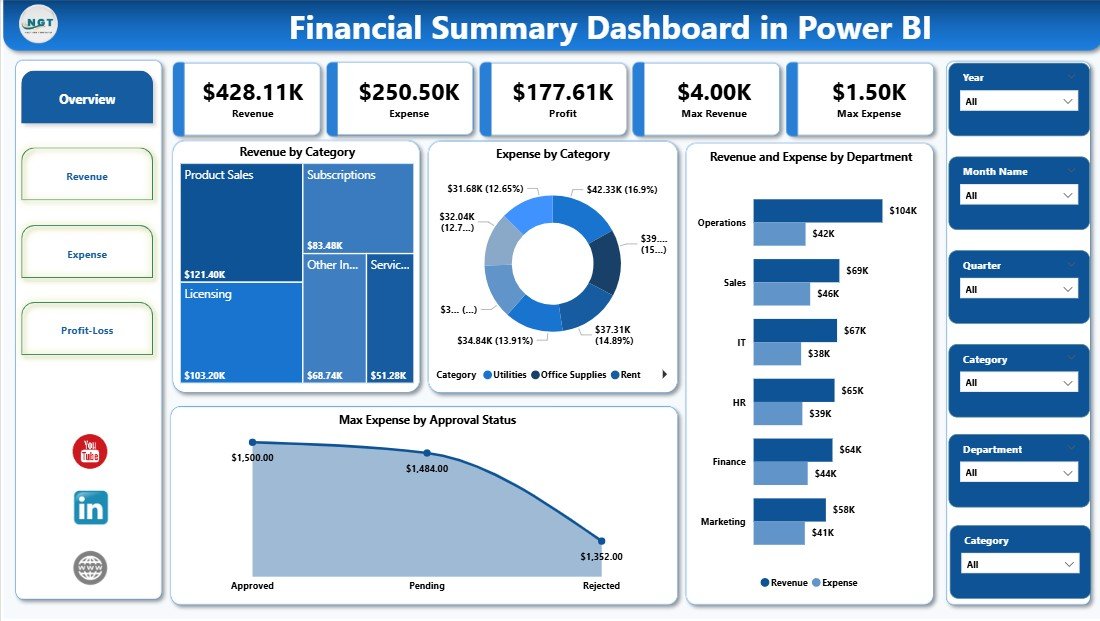
Financial Summary Dashboard in Power BI

January 12, 2026January 12, 2026 PKComments Off on Financial Summary Dashboard in Power BI
Managing finances without clear visibility always creates confusion. Many organizations track revenue, expenses, and profit in separate Excel files. As a result, leaders struggle to understand the complete financial picture.
Read More
Dashboard Power BI

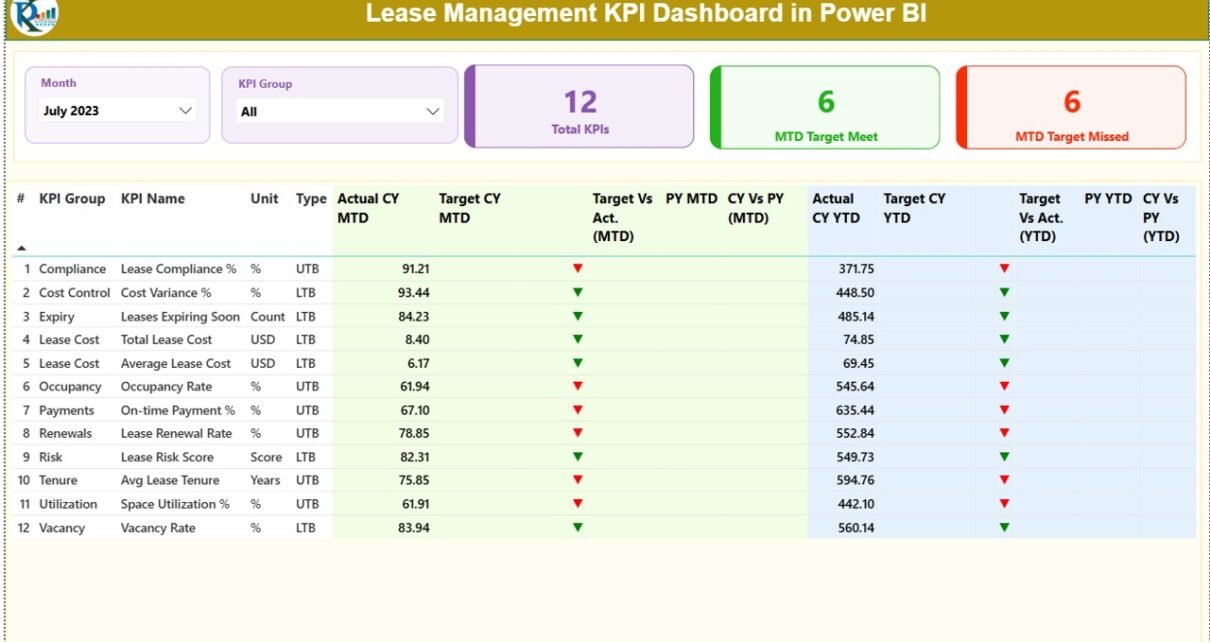
Lease Management KPI Dashboard in Power BI

January 2, 2026January 2, 2026 PKComments Off on Lease Management KPI Dashboard in Power BI
Managing leases without real-time visibility often leads to cost overruns, missed renewals, compliance risks, and poor decision-making. However, when organizations track lease performance using structured KPIs, they gain clarity, control,
Read More
Dashboard

Credit Card Companies KPI Dashboard in Excel

December 22, 2025December 22, 2025 PKComments Off on Credit Card Companies KPI Dashboard in Excel
Credit card companies operate in one of the most data-intensive and competitive environments. Every day, teams track transactions, revenues, delinquency rates, customer growth, approval ratios, fraud levels, and operational efficiency.
Read More
Dashboard

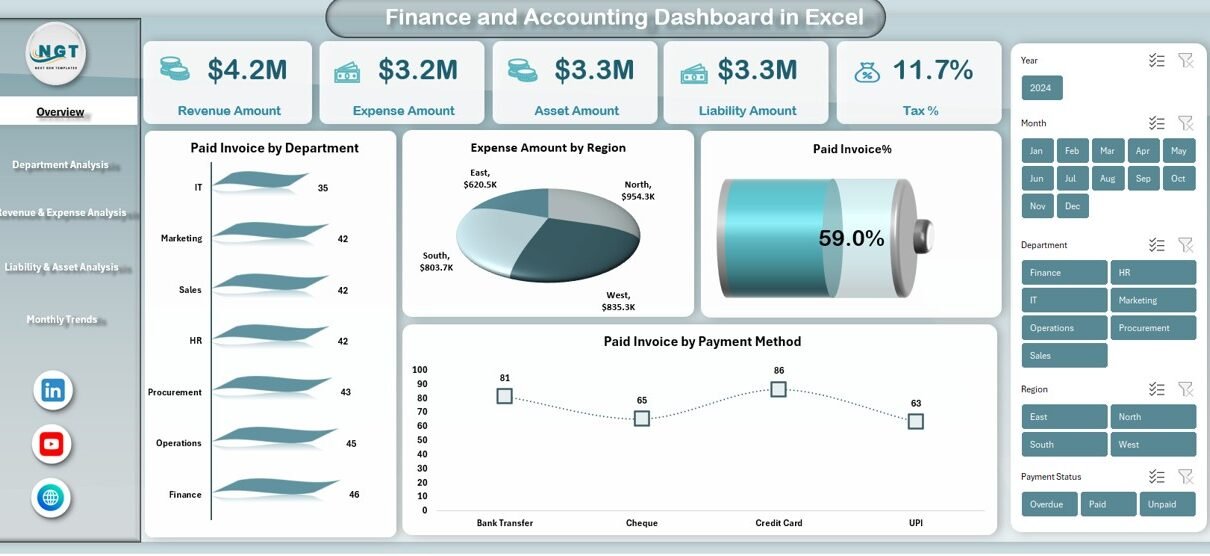
Finance and Accounting Dashboard in Excel

December 17, 2025December 17, 2025 PKComments Off on Finance and Accounting Dashboard in Excel
Managing finance and accounting data often feels overwhelming. Revenue, expenses, assets, liabilities, taxes, invoices, and trends keep changing every month. However, when data stays scattered across multiple files, decision-making becomes
Read More
Dashboard Power BI

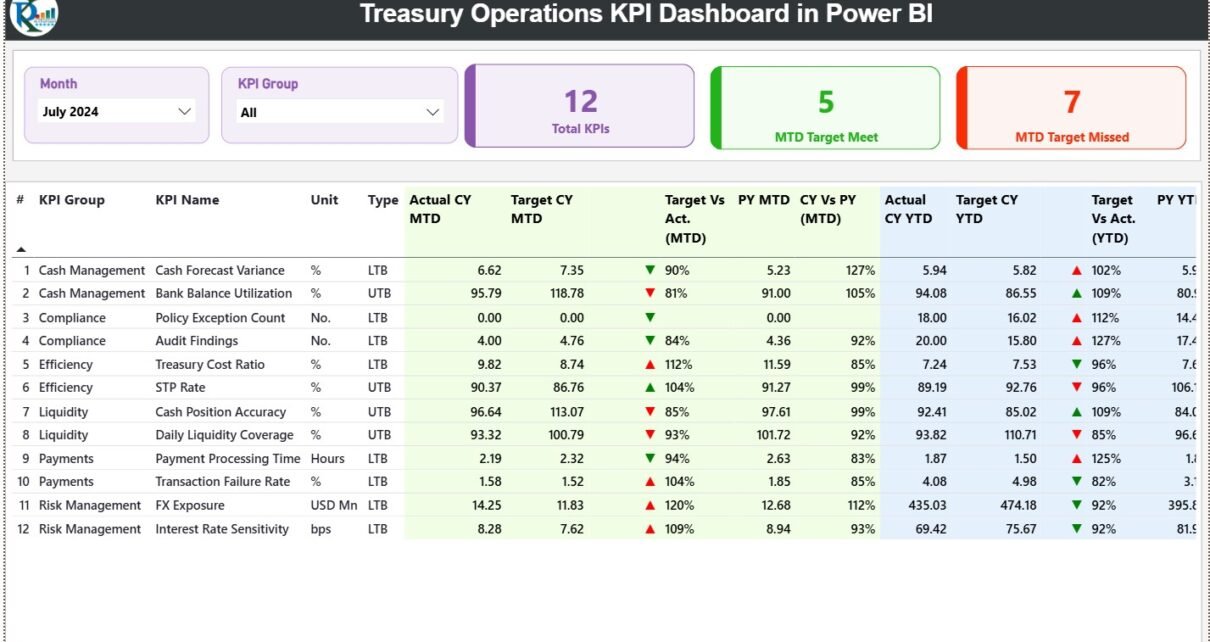
Treasury Operations KPI Dashboard in Power BI

December 15, 2025December 15, 2025 PKComments Off on Treasury Operations KPI Dashboard in Power BI
Managing treasury operations has become more complex than ever. Organizations handle cash flows, liquidity, debt, investments, and financial risks on a daily basis. Therefore, treasury teams need clear visibility, timely
Read More
Dashboard

Treasury Operations KPI Dashboard in Excel

December 10, 2025December 10, 2025 PKComments Off on Treasury Operations KPI Dashboard in Excel
Managing treasury operations without clear performance visibility often leads to cash mismatches, liquidity risks, delayed decisions, and missed optimization opportunities. Although many organizations track treasury data in Excel, they still
Read More

Posts pagination

1 2 Next
  • Learn Excel (Free Course)
    • 1. Shortcut Keys
    • 2. Fill & Flash Fill
    • 3. Find & Replace
    • 4. Sort & Filter
    • 5. Formulas & Functions
    • 6. Data Validation
    • 7. Conditional Formatting
    • 8. Basic Charts
    • 9. Advanced Charts
    • 10. Pivot Tables
    • 11. Excel Dashboards
    • 12. VBA Course
    • 13. Excel Formulas with AI
  • Templates
  • Tutorials
    • Charts and Visualization
    • VBA
    • Excel Tips and Tricks
    • Excel Dashboards
    • Power Pivot & DAX
  • Power BI
  • Template Store
    • Ready to Use Templates
  • Courses
  • Academy
    • Excel + AI Mastery: 100 Formulas
    • Excel Pivot Tables & Dashboards
  • About Us
  • Contact Us
Copyright © 2023 PK-AnExcelExpert.com - Privacy Policy