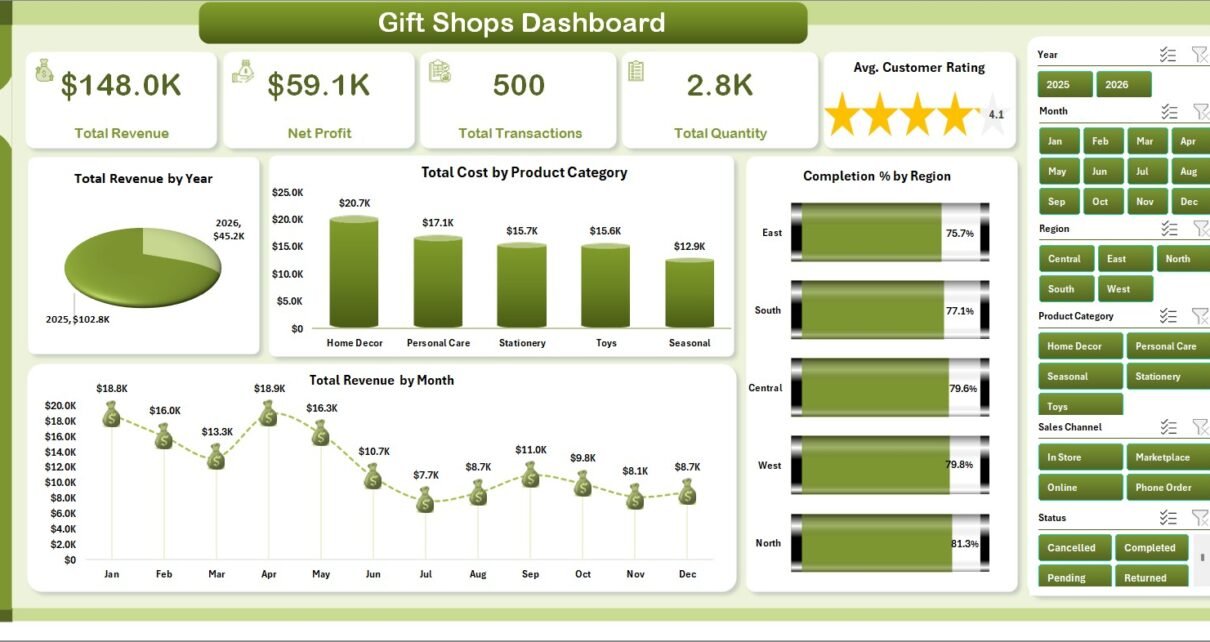
Gift Shops Dashboard in Excel is a ready-to-use Excel dashboard template for gift shop owners, retail managers, finance teams, and analysts who want to track sales, profitability, product mix, store performance, and customer behavior without building reports from scratch. Gift shops often see revenue move sharply around holidays, local events, tourism seasons, promotions, and new product displays, so a static monthly spreadsheet is rarely enough.
This workbook turns transaction-level data into visual reporting across 5 dashboard pages, 5 KPI cards, multiple slicers, a Data sheet, and a Support sheet with pivot tables. You can replace the sample records with your own data, click Data > Refresh All, and review updated charts immediately. For Excel refresh and pivot table basics, Microsoft also provides helpful guidance in its PivotTable refresh documentation.
Gift Shops Dashboard in Excel
Key Features of Gift Shops Dashboard in Excel
- 5 dashboard pages for Overview, Sales Trend, Product Mix, Store View, and Customer View.
- 5 KPI cards for Total Revenue, Net Profit, Total Transactions, Total Quantity, and Avg. Customer Rating.
- Interactive slicers that let you filter the dashboard quickly by the available fields in the workbook.
- Sales and profitability charts for revenue, cost, net profit, margin, returns, promotions, products, stores, and customer types.
- Editable Data sheet where you paste or type your own gift shop records in the same format.
- Support sheet with pivot tables used to refresh the charts and dashboard cards dynamically.
- One-time Excel workflow with no ongoing SaaS fee and no separate reporting software required.
Dashboard Pages Explanation
1. Overview Page
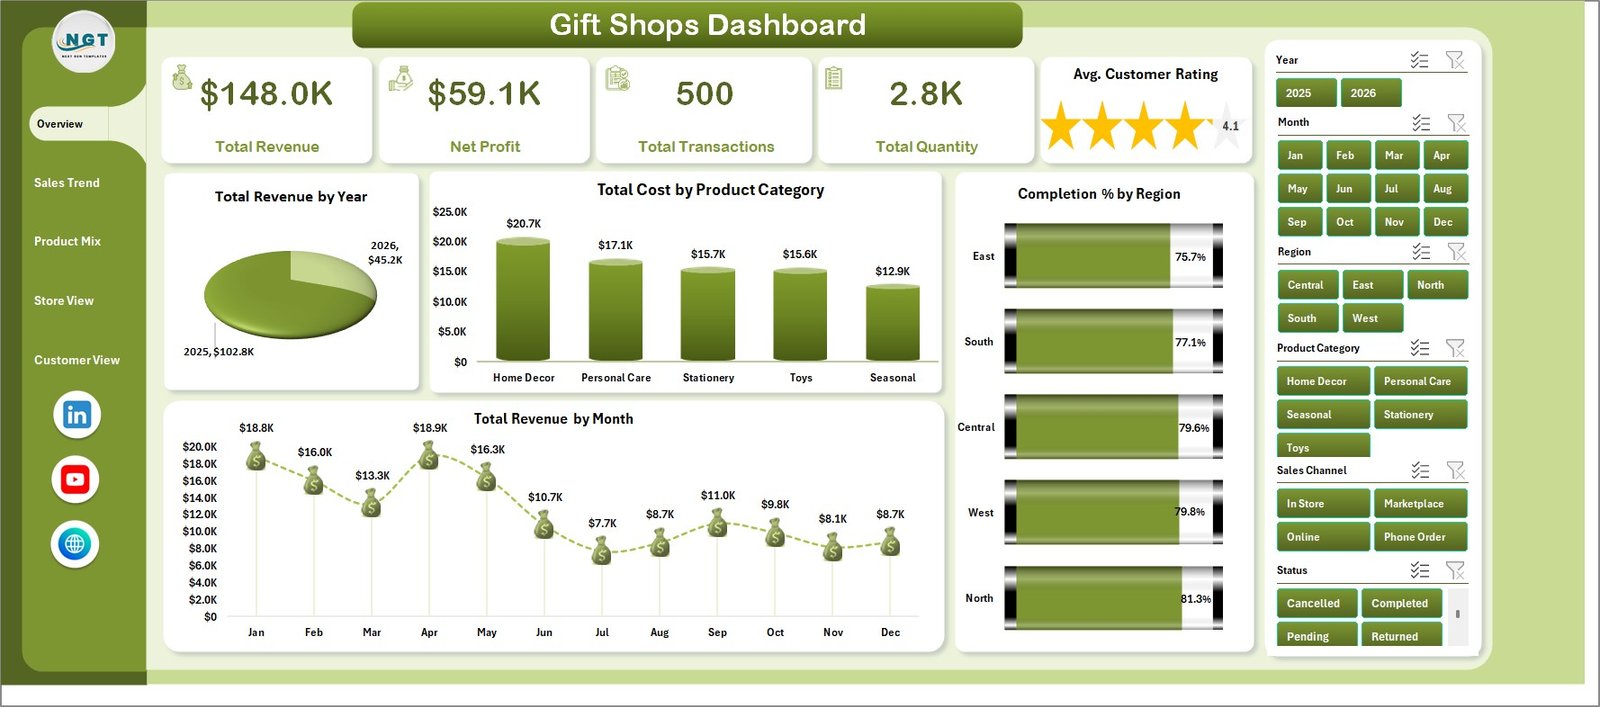
The Overview page gives a high-level snapshot of gift shop performance. At the top, KPI cards show Total Revenue, Net Profit, Total Transactions, Total Quantity, and Avg. Customer Rating, so managers can immediately see sales volume, profitability, activity, and customer satisfaction.
The page also includes charts for Total Revenue by Year, Total Cost by Product Category, Completion % by Region, and Total Revenue by Month. Total Revenue by Year helps compare annual performance. Total Cost by Product Category shows where spending is concentrated. Completion % by Region highlights regional order or transaction completion. Total Revenue by Month makes seasonal patterns easier to spot.
Overview Page
2. Sales Trend
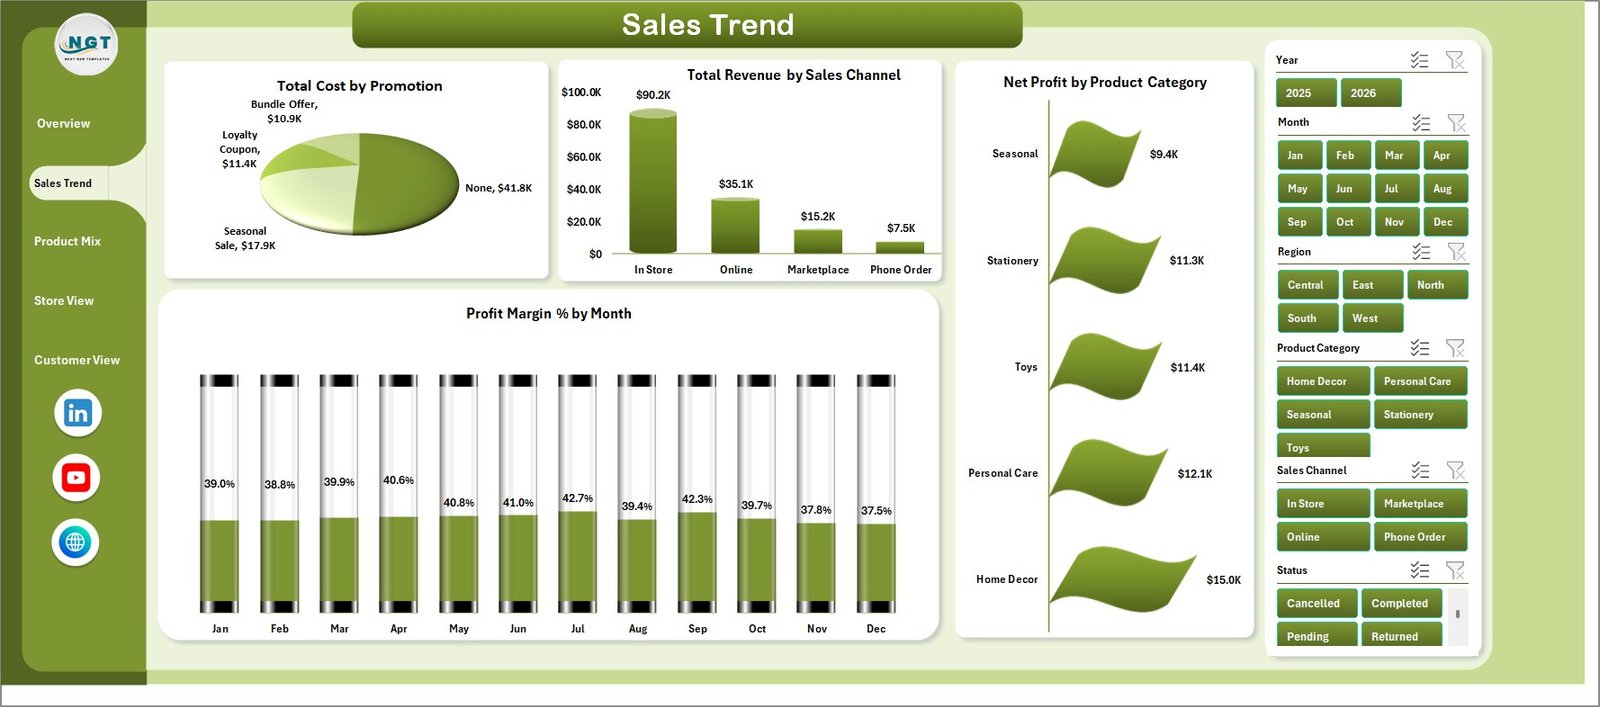
The Sales Trend page focuses on sales movement and margin health. It includes Total Cost by Promotion, Total Revenue by Sales Channel, Net Profit by Product Category, and Profit Margin % by Month.
Total Cost by Promotion helps you see which offers are expensive to run. Total Revenue by Sales Channel shows whether in-store, online, marketplace, or other channels are producing stronger sales. Net Profit by Product Category identifies profitable categories. Profit Margin % by Month shows whether monthly revenue growth is also producing healthy margin.
Sales Trend
3. Product Mix
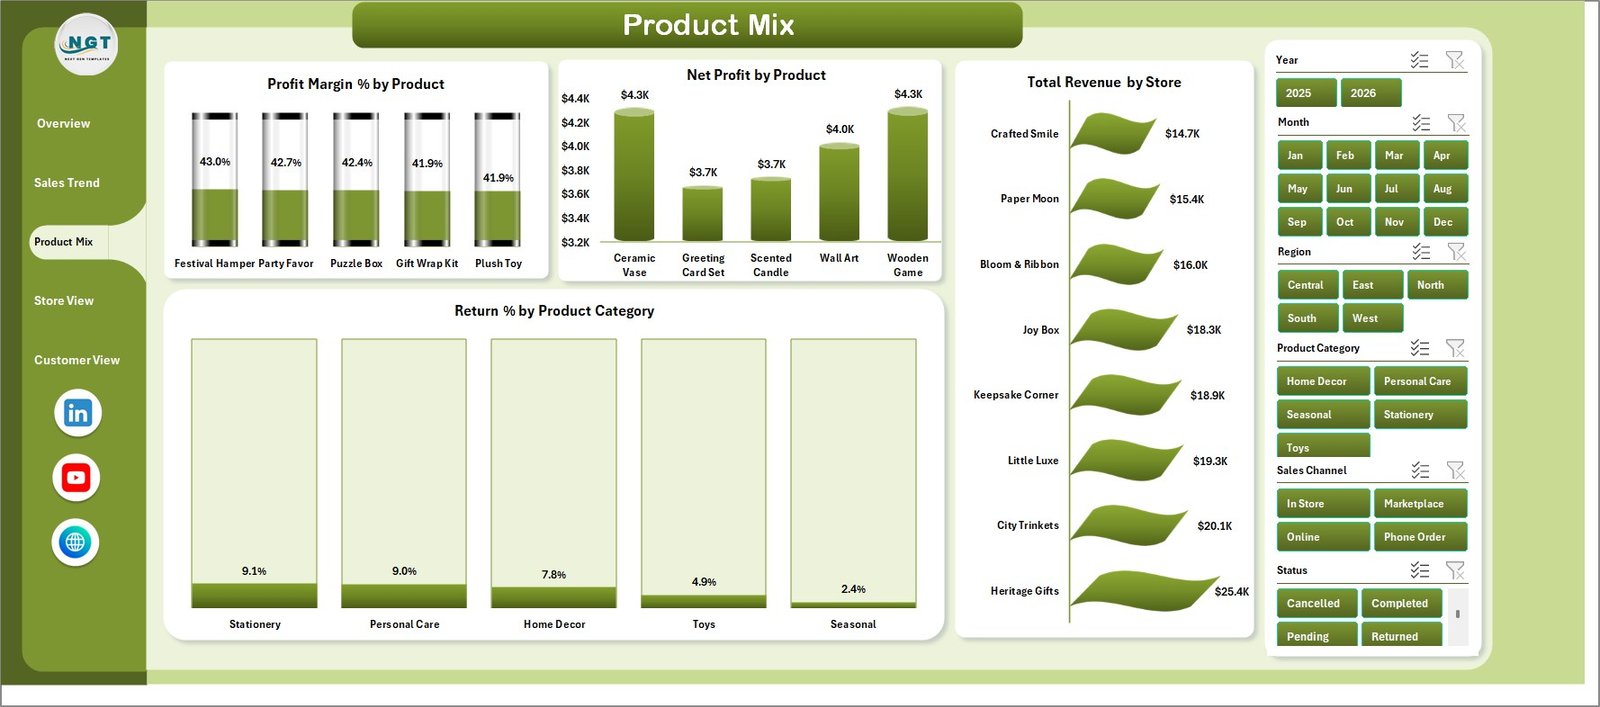
The Product Mix page helps you understand what is selling, what is profitable, and what may be creating returns. It includes Profit Margin % by Product, Net Profit by Product, Return % by Product Category, and Total Revenue by Store.
Profit Margin % by Product highlights products with strong or weak margin. Net Profit by Product shows the products contributing most to bottom-line results. Return % by Product Category can reveal quality, expectation, or merchandising issues. Total Revenue by Store helps compare product-driven sales across store locations.
Product Mix
4. Store View
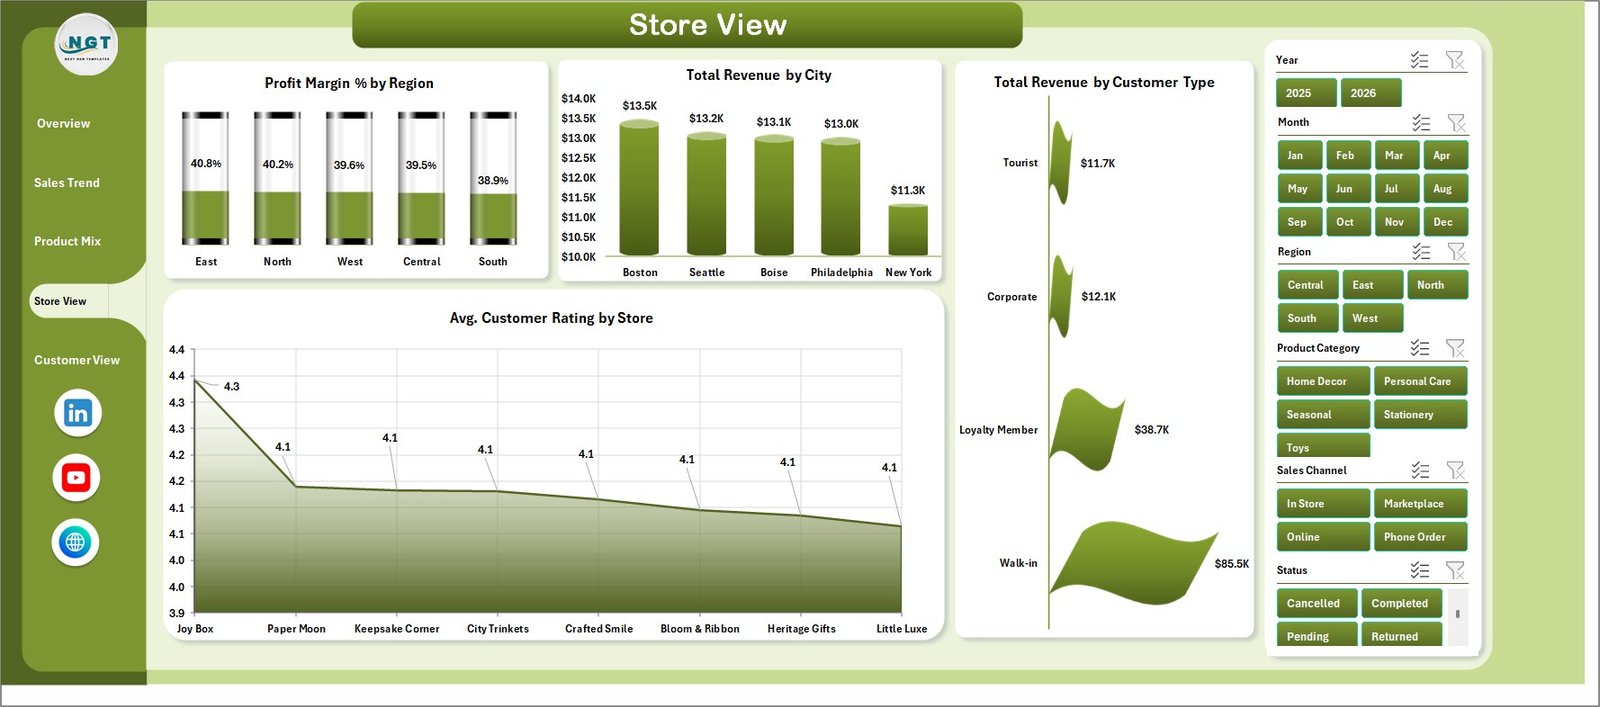
The Store View page is built for location-level analysis. It includes Profit Margin % by Region, Total Revenue by City, Total Revenue by Customer Type, and Avg. Customer Rating by Store.
Profit Margin % by Region helps compare profitability across territories. Total Revenue by City shows where demand is strongest. Total Revenue by Customer Type helps separate tourists, local customers, members, wholesale buyers, or other segments if your data uses those groups. Avg. Customer Rating by Store highlights service and experience differences by location.
Store View
5. Customer View
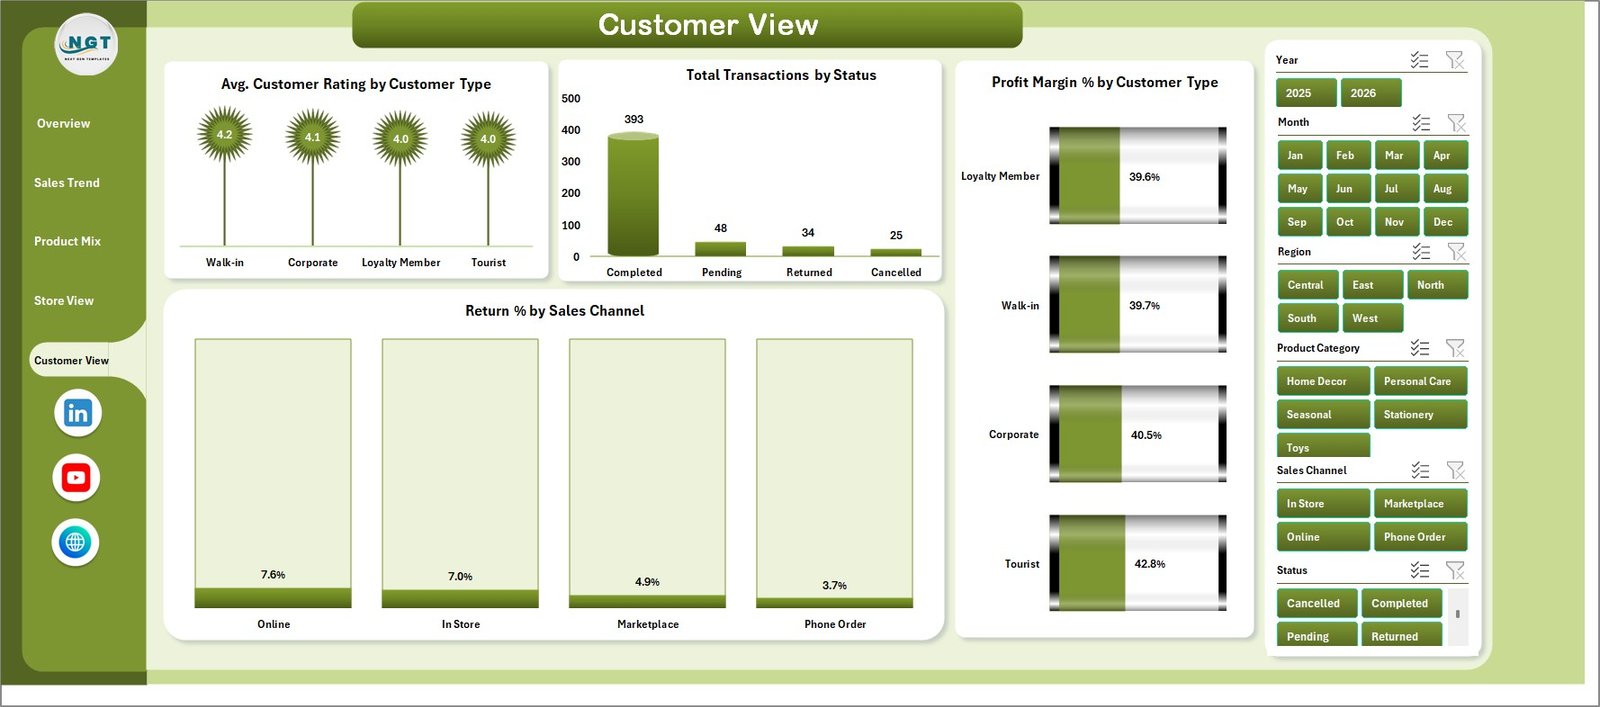
The Customer View page connects customer type, transaction status, margin, and returns. It includes Avg. Customer Rating by Customer Type, Total Transactions by Status, Profit Margin % by Customer Type, and Return % by Sales Channel.
Avg. Customer Rating by Customer Type shows satisfaction differences by segment. Total Transactions by Status helps monitor completed, pending, cancelled, or returned transactions. Profit Margin % by Customer Type reveals which segments create stronger profit. Return % by Sales Channel helps identify channels with higher return risk.
Customer View
6. Data Sheet Tab
The Data sheet is the input area for the workbook. Add your own data in the same format as the sample file, keep the column names consistent, and avoid changing the structure unless you also update the related pivot tables.

Data Sheet tab
7. Support Sheet
The Support sheet contains the pivot tables used to build the dashboard pages dynamically. After updating the Data sheet, go to the Data tab in the Excel ribbon and click Refresh All. You can keep this sheet hidden so day-to-day users only work with the dashboard pages.

Support sheet tab
Gift Shops Dashboard in Excel vs. Google Sheets vs. Paid Retail SaaS – Feature Comparison
| Feature | Gift Shops Dashboard in Excel | Google Sheets alternative | Paid retail SaaS |
|---|---|---|---|
| Cost | $17.99 one-time | Low one-time or free template cost | Monthly or annual subscription |
| Platform | Microsoft Excel | Browser-based spreadsheet | Vendor cloud platform |
| Setup time | Under 10 minutes | Under 15 minutes | Days or weeks |
| Real-time team collaboration | Limited unless shared through OneDrive | Strong | Strong |
| Mobile access | Limited | Good | Good |
| Customizable fields | High, because the workbook is editable | High | Depends on plan |
| Share with link | Possible through OneDrive or SharePoint | Built in | Built in |
| Year-1 cost at 5 users | $17.99 total | Low fixed cost | Often hundreds or thousands of dollars |
| Product mix analysis | Pre-built | May need formulas | Depends on retail setup |
| Offline use | Yes | Limited | No |
Who Should Use This Template
This dashboard is a good fit for independent gift shop owners, souvenir stores, boutique stores, museum shops, tourist retail outlets, multi-location gift retailers, finance analysts, store managers, and consultants who need a repeatable Excel reporting file.
It is not the right fit if you need live POS integration, barcode inventory automation, warehouse replenishment, accounting system sync, role-based permissions, or a mobile-first operations app. In those cases, a dedicated retail system may be more appropriate.
Real-World Use Cases
Maya, an independent gift shop owner, uses Total Revenue by Month to prepare for holiday demand and plan product displays before peak shopping periods.
Daniel, a regional retail manager, reviews Profit Margin % by Region and Avg. Customer Rating by Store to compare branches and coach store teams.
Sophia, a retail analyst, studies Return % by Product Category and Net Profit by Product to recommend changes to product mix and supplier strategy.
Advantages of Gift Shops Dashboard in Excel
The main advantage is speed. You do not need to design charts, build pivots, or decide which metrics to track before getting started. The workbook already includes pages for sales, product, store, and customer views.
Another advantage is flexibility. Because it is an Excel file, you can edit formulas, chart titles, colors, columns, and slicers. You can also use the workbook for weekly reviews, monthly reporting, seasonal campaign analysis, and management presentations.
Opportunities for Improvement
This template works best when your data is entered consistently. If your source data uses different category names, inconsistent dates, or missing values, clean the data before refreshing the dashboard.
For a future advanced version, useful additions could include automated POS import, inventory reorder alerts, basket analysis, staff productivity tracking, or a dedicated Power BI version for larger retail teams.
Best Practices
- Keep the Data sheet column structure unchanged unless you also update the pivot tables.
- Use consistent product category, store, region, city, and customer type names.
- Refresh the workbook after every data update.
- Review returns and margin together, not only sales volume.
- Keep a backup copy before making structural edits to formulas or pivots.
Explore Relevant Templates
You can download the Gift Shops Dashboard in Excel from NextGenTemplates. You may also find these related retail dashboard templates useful: Discount Stores Dashboard in Excel, Outlet Stores Dashboard in Excel, Baby Products Retail Dashboard in Excel, and the Excel Dashboard Templates category.
Frequently Asked Questions
What does the Gift Shops Dashboard in Excel track?
It tracks revenue, net profit, transactions, quantity, customer rating, costs, product categories, promotions, sales channels, regions, cities, stores, returns, customer types, and transaction status.
How do I update the dashboard?
Add or replace records in the Data sheet, keep the same structure, then click Data > Refresh All in the Excel ribbon.
Can I use it for multiple stores?
Yes. The Store View page includes region, city, store, customer type, and rating analysis so you can compare locations.
Can I customize the workbook?
Yes. You can edit charts, colors, formulas, pivot tables, page names, and layout because it is a standard Excel workbook.
Do I need Excel macros?
No macros are required for the dashboard workflow described here. The workbook uses Excel tables, charts, slicers, and pivot-based reporting.
Is this a subscription?
No. It is a one-time purchase with access to the downloadable Excel file.
About the Author
Built by PK – Microsoft Certified Professional with 15+ years of Excel, Google Sheets, and Power BI experience. Founder of NextGenTemplates, reaching 300K+ subscribers across YouTube channels. Every template is hand-built and tested before release.
Conclusion
The Gift Shops Dashboard in Excel is designed for retail teams that want a practical way to monitor sales, profit, products, stores, and customers in one workbook. With ready-made pages, KPI cards, slicers, charts, a Data sheet, and a Support sheet, it gives you a strong starting point for gift shop reporting.
Visit YouTube.com/@PKAnExcelExpert for more Excel dashboard tutorials and template walkthroughs.