The mining industry runs on tonnage, time, and tight margins — and yet most multi-site mine operators are still reporting weekly KPIs in disconnected spreadsheets that surface problems weeks after they could have been fixed. Industry benchmarks show that mining companies lose an average of 27% of potential revenue each year to undetected production gaps, equipment downtime, and uncontrolled cost overruns. According to McKinsey’s mining productivity research, even a 5% improvement in equipment utilization can lift site EBITDA by double digits.
The Mining Operations Dashboard in Excel closes that visibility gap. It consolidates production tonnage, revenue, operating cost, safety incidents, and equipment performance across every mine site, mineral type, and shift into a single, ready-to-use workbook — built on a pivot-driven architecture that refreshes in seconds. This blog post walks through every page in detail so you can see exactly how the dashboard is structured before you decide to purchase the template.
Why a Mining Operations Dashboard in Excel Matters
Most mining operations dashboards in the market come in two flavours: enterprise platforms like SAP Mining or Hexagon that cost $50,000+ per year, or BI tools like Power BI and Tableau that require a license per user and an in-house developer. Both work — but neither fits a junior miner, a regional operator, or a consultancy that needs an offline, fully editable, audit-ready dashboard to drop into a board pack.
The Mining Operations Dashboard in Excel covers 7 fully-linked sheets, 5 KPI cards, 15+ charts, and slicers across every page. Setup takes under 10 minutes — replace the sample rows in the Data Sheet with your own production records, click Data > Refresh All, and every chart, KPI, and pivot updates instantly. It’s the same operational logic as the classic Mining Dashboard in Excel with a deeper focus on cost control, safety, and equipment availability.
Key Features of the Mining Operations Dashboard in Excel
- Pivot-driven architecture — every chart and KPI is wired to a centralized pivot table on the Support Sheet, so refreshing one place refreshes the whole workbook.
- Slicer filters on every page — Mine Site, Region, Mineral Type, Shift, Mining Method, and Equipment Type slicers work as a connected filter pane.
- Tested with 100,000+ rows on a typical office laptop — no Power Query staging required for typical operational datasets.
- 5 KPI cards on the Overview Page — Total Tons Extracted, Total Revenue, Total Operating Cost, Net Profit, and Total Safety Incidents.
- Five analysis tabs covering Production Trends, Site Analysis, Cost & Profit, and Safety & Equipment.
- 100% offline and on your machine — no cloud subscription, no per-user fees, no IT ticket.
- Lifetime updates — re-download future enhancements free from your NextGenTemplates account.
Dashboard Pages Explained
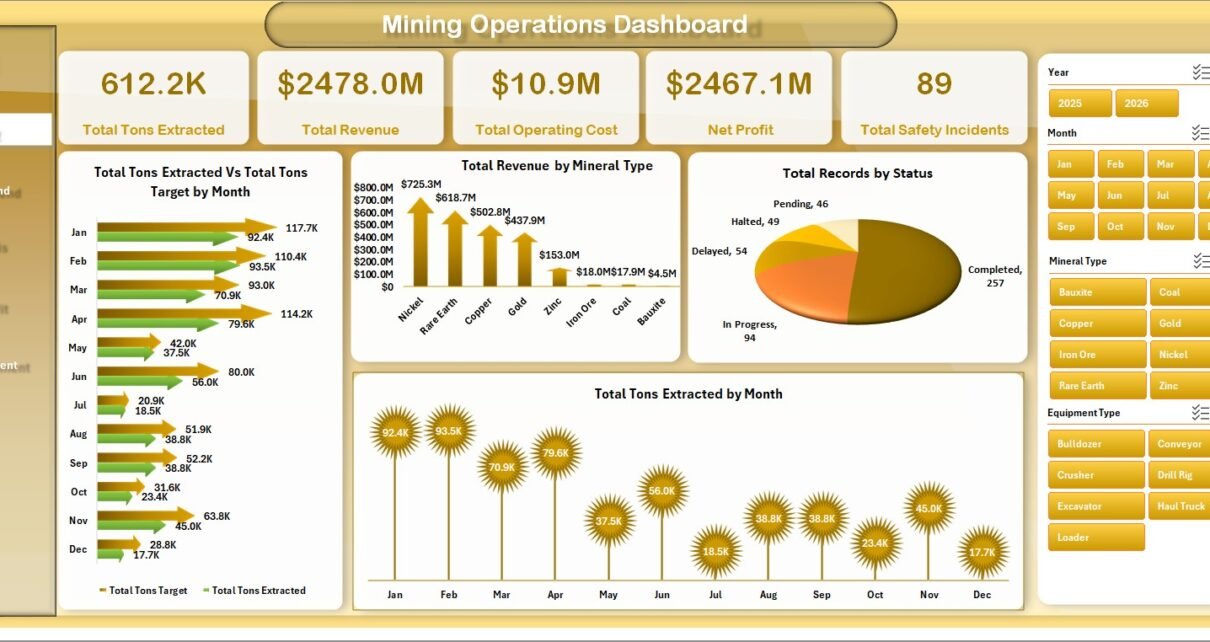
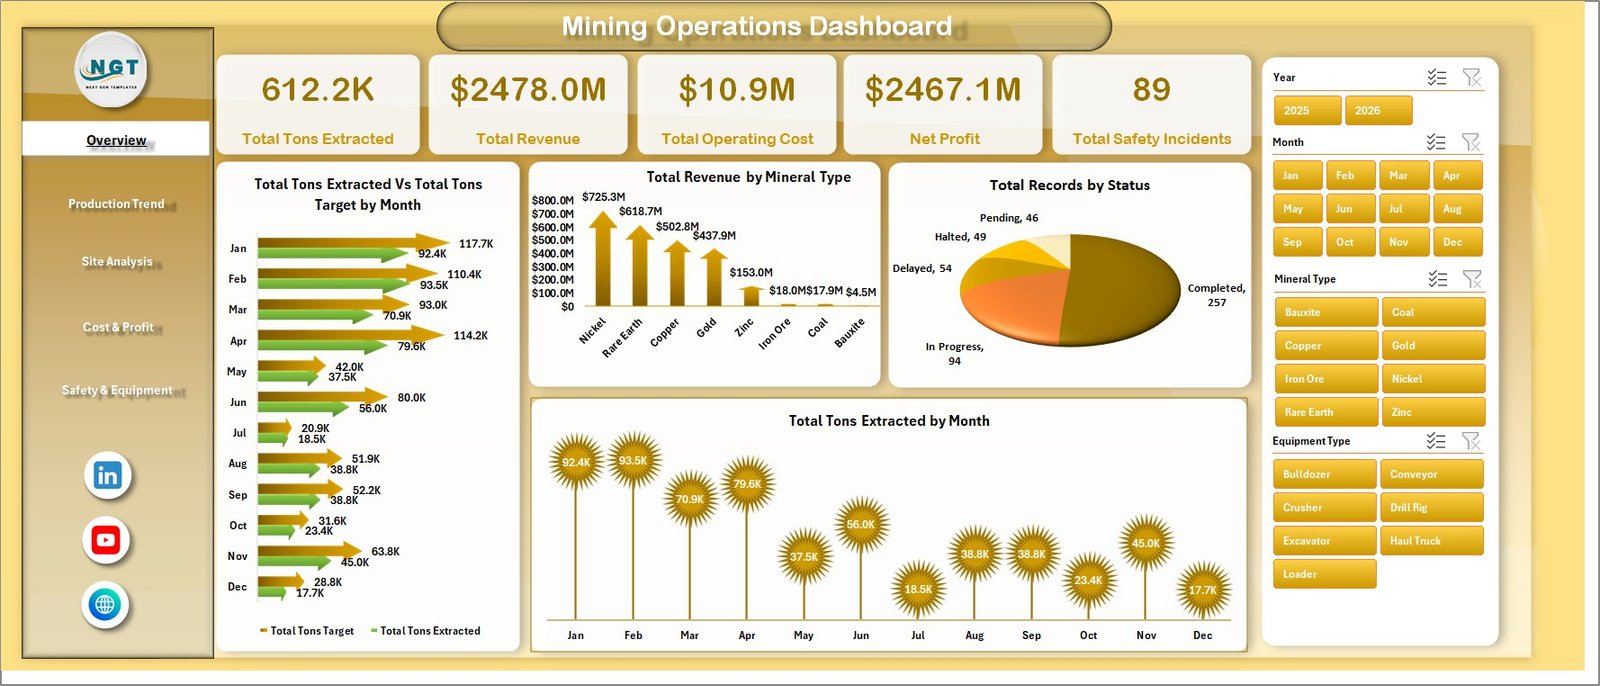
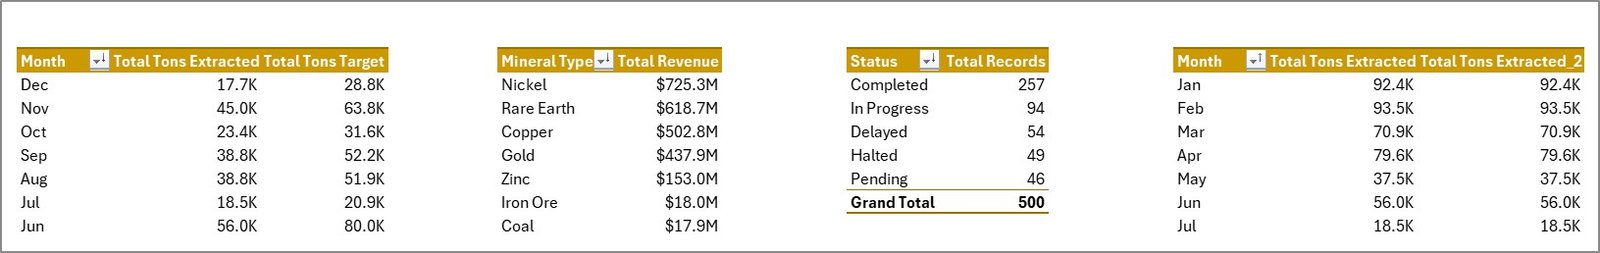
1. Overview Page
The Overview Page is your daily executive summary. KPI cards at the top of the sheet display Total Tons Extracted, Total Revenue, Total Operating Cost, Net Profit, and Total Safety Incidents — the five numbers every mining executive needs at a glance. Slicers let you instantly filter the entire dashboard by Mine Site, Region, Mineral Type, or Date.
- Total Tons Extracted Vs Total Tons Target by Month — A combo chart that compares actual extraction against monthly tonnage targets, making variance and trend deviations visible immediately.
- Total Revenue by Mineral Type — Shows which minerals (coal, iron ore, copper, gold, etc.) drive your top-line revenue.
- Total Records by Status — Breaks down operational records by status (Completed, In Progress, Delayed, On Hold) for fast operational health checks.
- Total Tons Extracted by Month — Highlights seasonality, ramp-ups, and unexpected dips in production output.
Mining Operations Dashboard
2. Production Trend
The Production Trend tab drills into how output is shifting across years, methods, shifts, and sites — essential for capacity planning and shift optimization.
- Total Tons Extracted Vs Total Tons Target by Year — Multi-year comparison of annual production against targets to highlight long-term performance gaps.
- Total Tons Extracted by Mining Method — Compares output across Open-Pit, Underground, Strip, and Placer methods to identify your most productive technique.
- Total Tons Extracted Vs Total Operating Hours by Shift — Reveals throughput per shift (Morning, Afternoon, Night) and helps balance crew loading.
- Total Tons Extracted Vs Total Revenue by Mine Site — Pairs volume with revenue to show which sites are tons-heavy but margin-light.
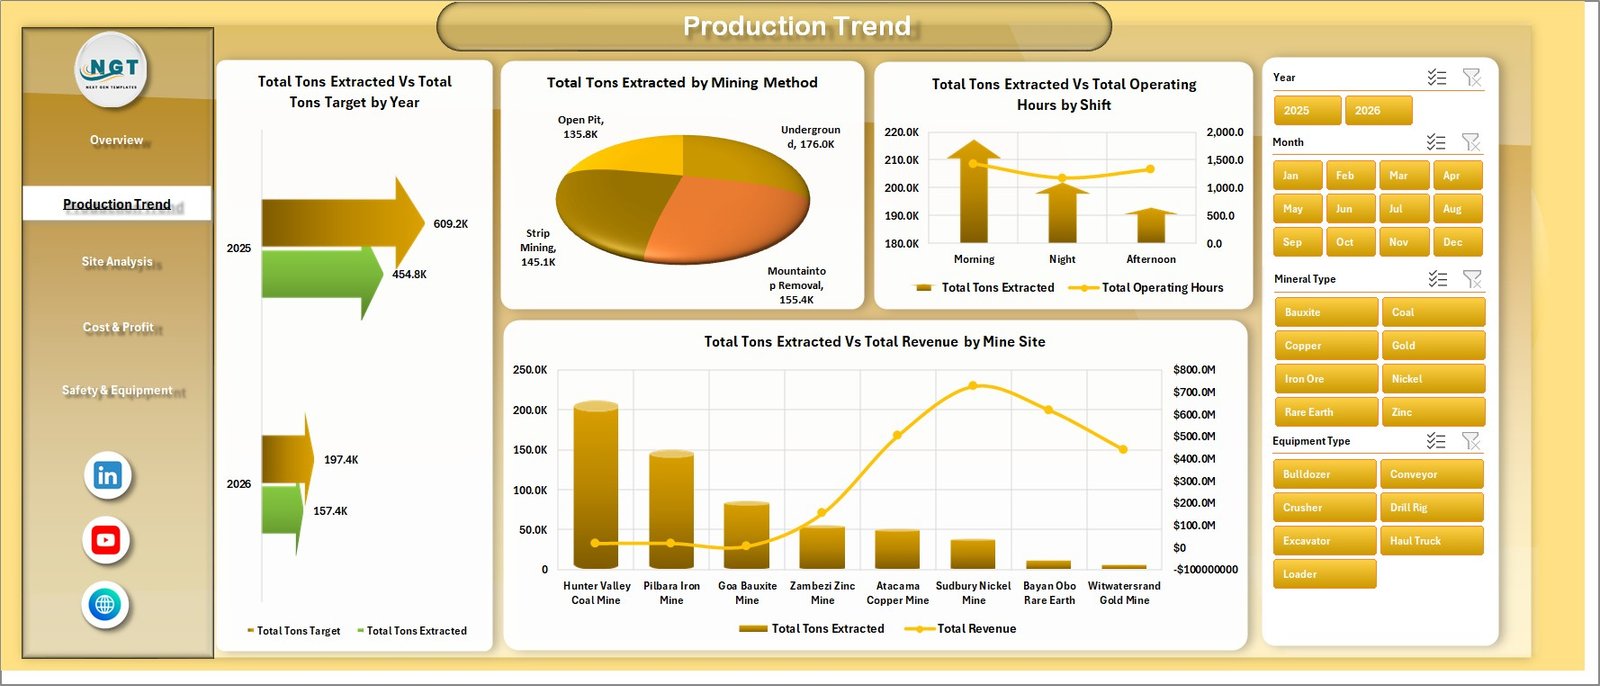
Production Trend
3. Site Analysis
The Site Analysis tab compares profitability and target attainment across your entire mine portfolio.
- Net Profit by Region — Geographic profitability breakdown showing which regions deliver the strongest bottom line.
- Profit Margin % by Mineral Type — Identifies which minerals carry the healthiest margins after all costs are stripped out.
- Target Achievement % by Mine Site — Variance chart highlighting over- and under-performing sites against quarterly targets.
- Total Fuel Cost Vs Total Labor Cost by Mineral Type — Stacked comparison that exposes which minerals are fuel-intensive versus labor-intensive.
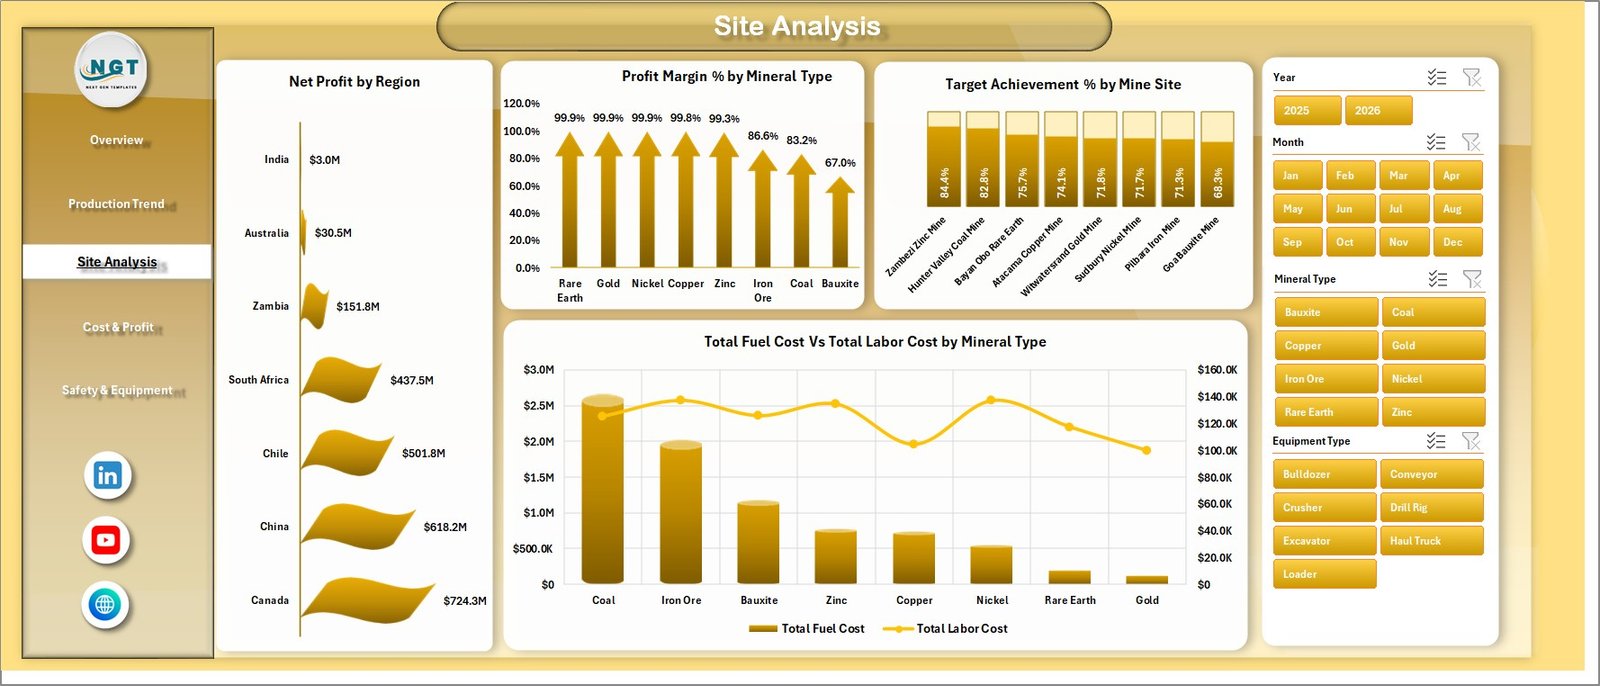
Site Analysis
4. Cost & Profit
The Cost & Profit tab is where finance controllers spend most of their time — surfacing every dollar of maintenance, downtime, and operating overhead.
- Total Maintenance Cost by Mine Site — Pinpoints sites with disproportionate maintenance spend so root causes can be investigated.
- Total Operating Cost by Month — Monthly cost trendline for cash-flow planning and budget reforecasts.
- Net Profit by Mining Method — Shows which mining method contributes the most to profitability after direct costs.
- Total Downtime Hours Vs Total Operating Hours by Equipment Type — Reveals reliability ratios for haul trucks, excavators, drills, loaders, and conveyors.
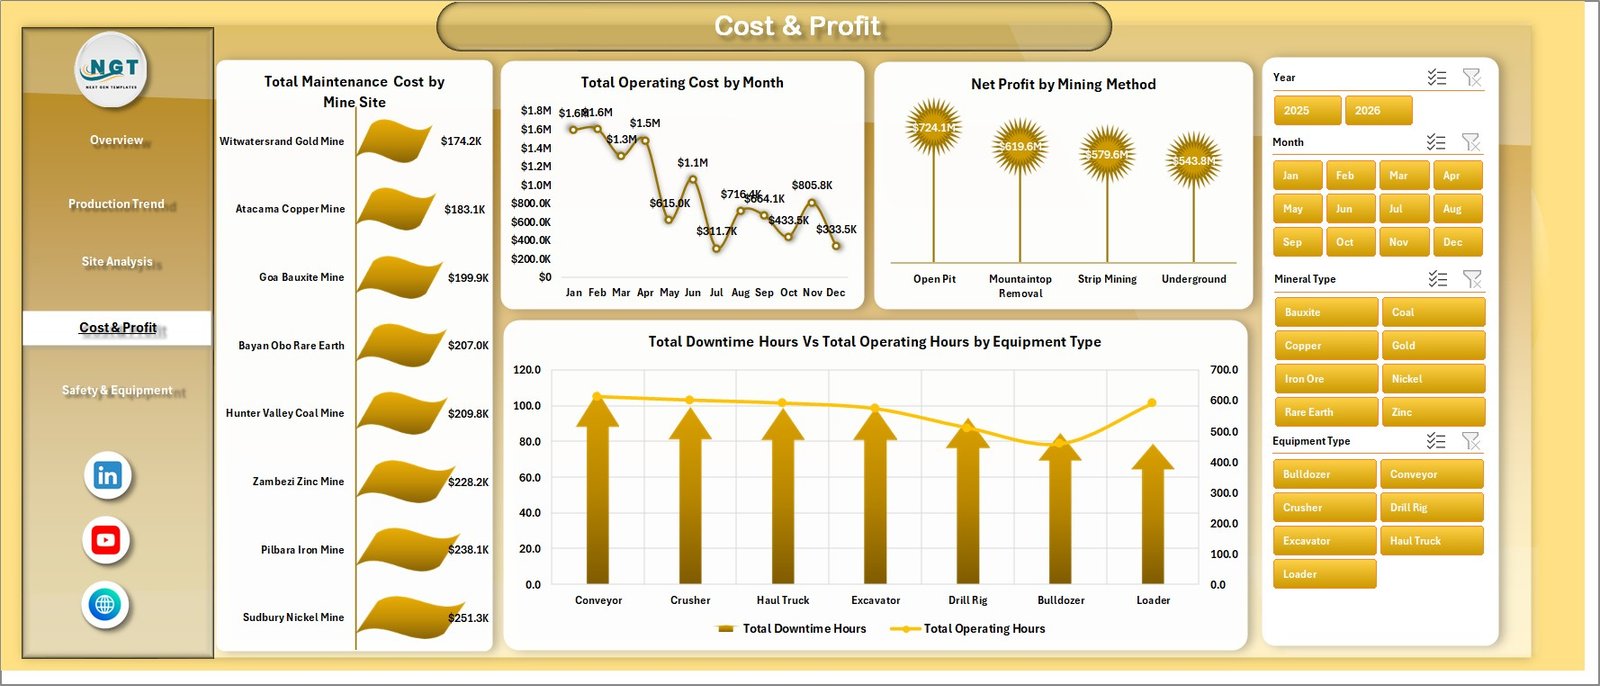
Cost & Profit
5. Safety & Equipment
Safety performance is non-negotiable in mining, and this tab keeps every supervisor accountable for incidents and equipment uptime.
- Total Safety Incidents by Mine Site — Site-by-site incident count to focus safety interventions where they matter most.
- Avg. Safety Score by Supervisor — Holds supervisors accountable for crew safety performance with a rolling average score.
- Downtime Rate % by Priority — Categorizes equipment downtime by priority (Critical, High, Medium, Low) so maintenance teams can triage faster.
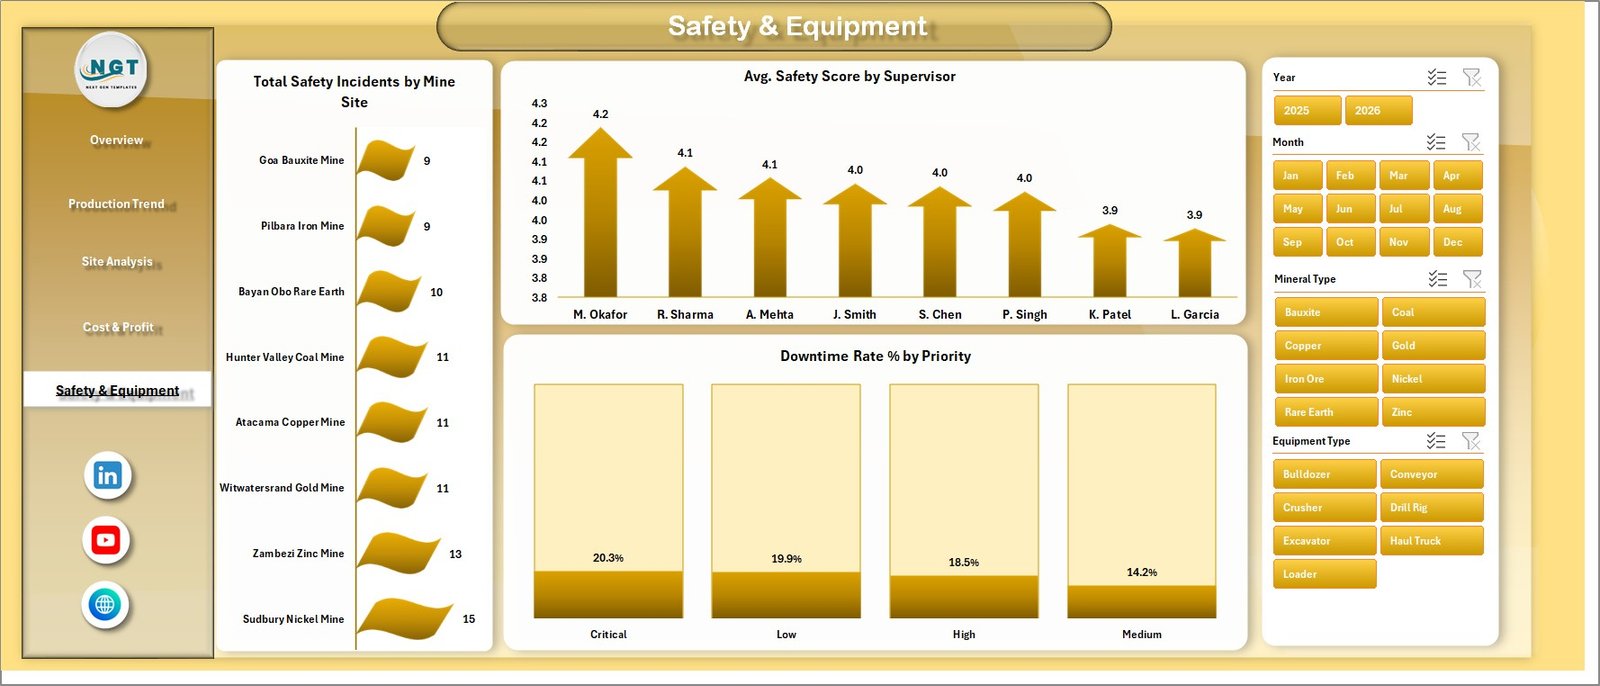
Safety & Equipment
6. Data Sheet
The Data Sheet is where you paste your operational records. Keep the column headers identical and the dashboard will pick up your data automatically. The template ships with structured sample data showing the exact format expected — production date, mine site, region, mineral type, mining method, shift, supervisor, equipment type, tons extracted, target tons, operating hours, downtime hours, fuel cost, labor cost, maintenance cost, revenue, safety incidents, safety score, and status.
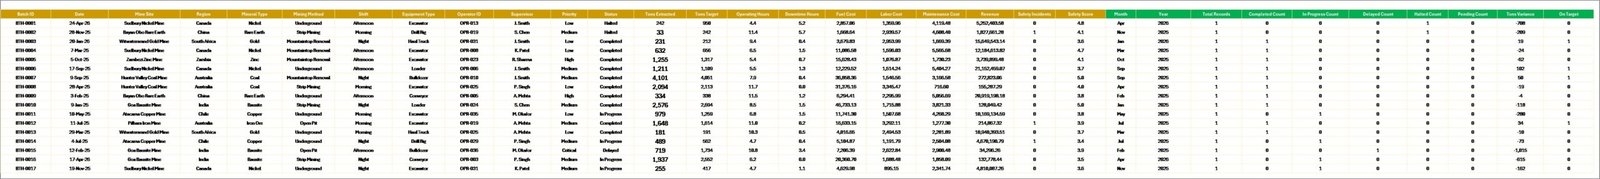
Data Sheet tab
7. Support Sheet
The Support Sheet contains all the pivot tables that power the dashboard. After updating the Data Sheet, go to the Data tab in the Excel ribbon and click Refresh All — every pivot, KPI card, and chart updates instantly. You can keep this sheet hidden in production use; it is shown here so you can see exactly how the dashboard is wired. Microsoft has a great primer on pivot refresh behaviour in the official Excel documentation if you want to dig deeper.
Support sheet tab
Mining Operations Dashboard in Excel vs. Google Sheets vs. Paid Mining Software — Feature Comparison
| Feature | Mining Operations Dashboard in Excel | Google Sheets equivalent | SAP Mining / Hexagon Mining |
|---|---|---|---|
| Cost | $17.99 one-time ✅ | $9.99 – $14.99 one-time | $50,000 – $250,000+ /year |
| Setup time | Under 10 minutes ✅ | 15 – 30 minutes | 3 – 9 month implementation |
| Real-time team collaboration | Excel co-authoring (M365) | ✅ Native multi-user | ✅ Native multi-user |
| Customizable fields | Fully editable, no code ✅ | Editable, Apps Script for advanced | Consultant-led, expensive |
| Data ownership | 100% on your machine ✅ | Stored in Google cloud | Vendor cloud / hybrid |
| Year-1 cost at 5 users | $17.99 (lifetime) ✅ | $9.99 + Workspace fees | $50,000+ implementation |
| Future updates | Free lifetime updates ✅ | Free lifetime updates | Annual maintenance fee |
For mining teams that want a board-ready operational view without spending a quarter of their budget on enterprise software, the Mining Operations Dashboard in Excel sits in the sweet spot — cheap, offline, fully editable, and audit-ready.
Who Should Use This Template
Perfect for:
- Mine General Managers and COOs who need a single-page operational view across multiple sites
- Mining finance controllers tracking margin by mineral, region, and method
- Production planners reconciling tonnage targets against actuals every week
- Safety officers monitoring incidents and supervisor scorecards
- Equipment maintenance leads tracking downtime by priority and equipment type
- Mining consultants who deliver client reports and need a credible, brandable Excel deliverable
Not a fit if:
- You need real-time IoT/SCADA integration — this is a structured Excel reporting layer, not a streaming telemetry tool
- You require automatic ERP/SAP synchronization on a 5-minute cycle
- You need browser-first multi-user concurrent editing — use the Mining Dashboard in Google Sheets instead
- You need certified geological reserve reporting (JORC / NI 43-101) — that requires specialist software
Real-World Use Cases
1. Multi-site coal operator in Indonesia — A regional coal producer running 4 open-pit sites used the dashboard to consolidate weekly tonnage reports from each site. Within the first month they identified a 12% target shortfall at one site that had been hidden inside aggregated reports, and reallocated equipment to recover production.
2. Junior gold miner in Australia — A junior listed company used the Cost & Profit tab to present monthly performance to its board. The pivot-driven structure let them slice net profit by mining method instantly, replacing a 3-day month-end report cycle with a 30-minute refresh.
3. Mining consulting firm in Canada — A boutique advisory firm rebranded the template for client deliverables, using it to benchmark fuel and labor costs across 11 client mine sites. The Site Analysis tab became the centerpiece of every quarterly review meeting.
Advantages of the Mining Operations Dashboard in Excel
- Replaces a $50,000+ /year enterprise platform for the operational reporting use case at less than 0.04% of the cost.
- Cuts month-end reporting from days to under an hour — paste data, refresh, screenshot for the board pack.
- Surfaces hidden tonnage shortfalls with the Target vs Actual chart on the Overview Page.
- Standardizes safety reporting across sites and supervisors with the Avg. Safety Score by Supervisor analysis.
- Audit-friendly — every chart traces back to the Support Sheet pivot, which traces back to the raw Data Sheet.
Opportunities for Improvement
To stay honest about what this dashboard is and isn’t: it does not include real-time SCADA streaming, predictive maintenance modelling, or geological reserve estimation. If your organisation needs those capabilities, this dashboard works best as the operational reporting layer sitting alongside specialist tools — not as a replacement for them. It also assumes you have a clean, structured operational dataset; if your data is fragmented across 10 different systems, you will need to consolidate it into the Data Sheet first.
Best Practices
- Update the Data Sheet weekly rather than monthly — trends are easier to act on when you spot them within 7 days.
- Lock the Support Sheet before sending the file to operational users so the pivot structure does not get accidentally edited.
- Use the Mine Site slicer combined with the Mineral Type slicer to find under-performing site/mineral combinations.
- Pair the dashboard with the related Heavy Machinery Dashboard in Excel for deeper equipment lifecycle analysis.
Explore Relevant Templates
- Mining Dashboard in Power BI — same operational logic for teams already on Power BI.
- Mining Dashboard in Google Sheets — browser-first version for distributed teams.
- Mining KPI Scorecard in Google Sheets — single-page scorecard for executive reporting.
- All Excel Dashboard Templates — browse the full Excel dashboard catalog on NextGenTemplates.
Frequently Asked Questions
Which version of Microsoft Excel do I need to run the Mining Operations Dashboard in Excel?
The Mining Operations Dashboard in Excel is built for Microsoft Excel 2016, 2019, 2021, and Microsoft 365 (Windows and Mac). Excel for the web has limited pivot-refresh support, so the desktop version is recommended for full functionality.
How do I update the dashboard with my own mining data?
Open the Data Sheet tab, replace the sample rows with your own production records while keeping the column headers identical, then go to Data > Refresh All in the Excel ribbon. Every chart, KPI card, and pivot in the Mining Operations Dashboard updates automatically.
How does this compare to SAP Mining or Hexagon Mining Solutions?
SAP Mining and Hexagon are full enterprise platforms costing $50,000+ per year with multi-month implementations. The Mining Operations Dashboard in Excel is a $17.99 one-time reporting layer — perfect for operational visibility, board reporting, and consulting deliverables, but not a replacement for ERP-grade workflows.
How long does setup take?
Setup takes under 10 minutes. Open the Mining Operations Dashboard in Excel, paste your operational data into the Data Sheet keeping the column headers identical, and click Data > Refresh All. Every chart and KPI card on the 5 dashboard pages will update instantly.
Can I add my company logo and rebrand the dashboard?
Yes — every element of the Mining Operations Dashboard in Excel is unprotected and fully editable. You can change colors, fonts, logos, and chart types without breaking the underlying pivot structure. Mining consultants regularly white-label the template for client deliverables.
How many records can the Mining Operations Dashboard handle?
The Mining Operations Dashboard in Excel has been tested with 100,000+ rows on a typical office laptop. For datasets larger than 250,000 rows we recommend converting the data range to an Excel Table and using Power Query for staging.
Is there a Power BI or Google Sheets version available?
Yes. The same operational logic is also available as the Mining Dashboard in Power BI and the Mining Dashboard in Google Sheets for teams already standardized on those platforms.
About the Author
Built by PK — Microsoft Certified Professional with 15+ years of Excel, Google Sheets, and Power BI experience designing dashboards for industrial and operations teams. Founder of NextGenTemplates, reaching 300,000+ subscribers across YouTube channels (@PK-AnExcelExpert, @NextGenTemplates). Every template is hand-built and tested before release against real industry datasets.
Conclusion
The Mining Operations Dashboard in Excel gives mine general managers, finance controllers, and consultants a single-file operational view across production, cost, profit, safety, and equipment — without the price tag, complexity, or vendor lock-in of an enterprise mining platform. Five dashboard pages, slicer-driven filtering, and a pivot-driven Support Sheet keep the entire workbook in sync with one click.
👉 Click here to Purchase the Mining Operations Dashboard in Excel
✅ Instant download · One-time payment of $17.99 · No subscription · 30-day money-back guarantee
🎥 Visit our YouTube channel for step-by-step video tutorials: YouTube.com/@PK-AnExcelExpert
📅 Last updated: May 2026