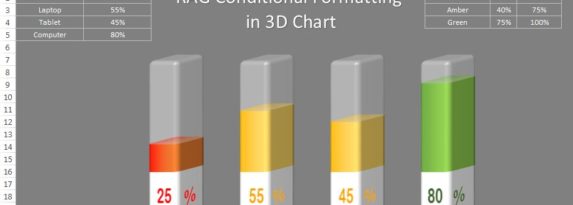
RAG Conditional Formatting in 3D Chart
In this article, we have created a beautiful 3D chart to display the Sales conversion for different products. We have used RAG (Red, Amber and Green) Conditional Formatting in this chart. This is a dynamic conditional formatting and it is connected with the color condition table. You can change the color range from the color … Continue reading RAG Conditional Formatting in 3D Chart
Copy and paste this URL into your WordPress site to embed
Copy and paste this code into your site to embed