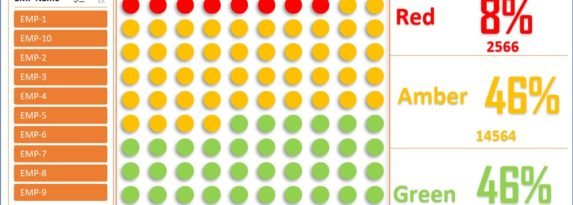
RAG waffle Chart visualization with Slicer
In this article, we have create a RAG waffle Chart visualization with slicer to display the Red, Amber and Green percentage. We have used Conditional Formatting and linked picture feature to create this beautiful visualization. RAG waffle Chart visualization with Slicer Below is the snapshot for the Chart. This chart shows Part of Red, Amber … Continue reading RAG waffle Chart visualization with Slicer