Managing inventory in the construction and real estate industry can be challenging. From tracking available stock and ensuring timely deliveries to balancing project budgets, the complexity increases with scale. Without proper monitoring, organizations may face delays, budget overruns, and loss of productivity.
A Construction and Real Estate Inventory Management KPI Dashboard in Excel is a powerful solution to simplify this process. It centralizes all inventory-related data, helps track performance against set targets, and provides actionable insights for better decision-making. This tool is ideal for project managers, inventory controllers, and business owners who want to manage inventory more efficiently without investing in complex software.
In this article, we will explore the structure, features, advantages, and best practices for using this dashboard. We will also answer common questions to help you get started.
Click to Purchases Construction and Real Estate Inventory Management KPI Dashboard in Excel
What is a Construction and Real Estate Inventory Management KPI Dashboard?
A KPI (Key Performance Indicator) dashboard is a visual tool that presents the most important metrics for tracking inventory performance. For the construction and real estate sector, this dashboard focuses on monitoring stock levels, material usage, supplier performance, and overall inventory efficiency.
The dashboard in Excel is fully customizable, user-friendly, and works without the need for complex coding or expensive software. It allows you to track metrics on both Month-to-Date (MTD) and Year-to-Date (YTD) basis, compare against targets, and review performance against the previous year.
Key Features of the Dashboard
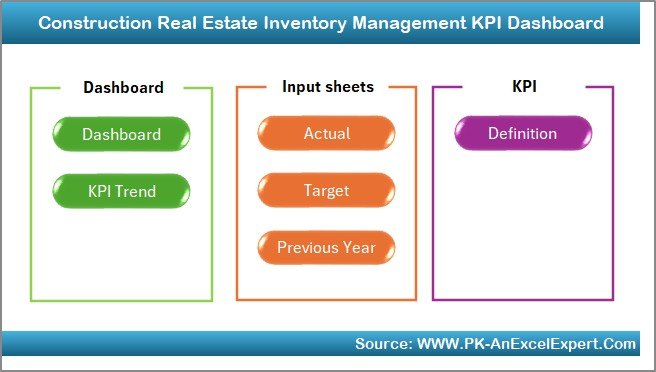
This dashboard contains seven worksheets designed for different purposes. Let’s look at them in detail:
Home Sheet
-
Purpose: Acts as an index page for the entire file.
-
Functionality: Contains six clickable buttons to navigate quickly to other sheets.
-
Benefit: Saves time and ensures smooth navigation between different sections.
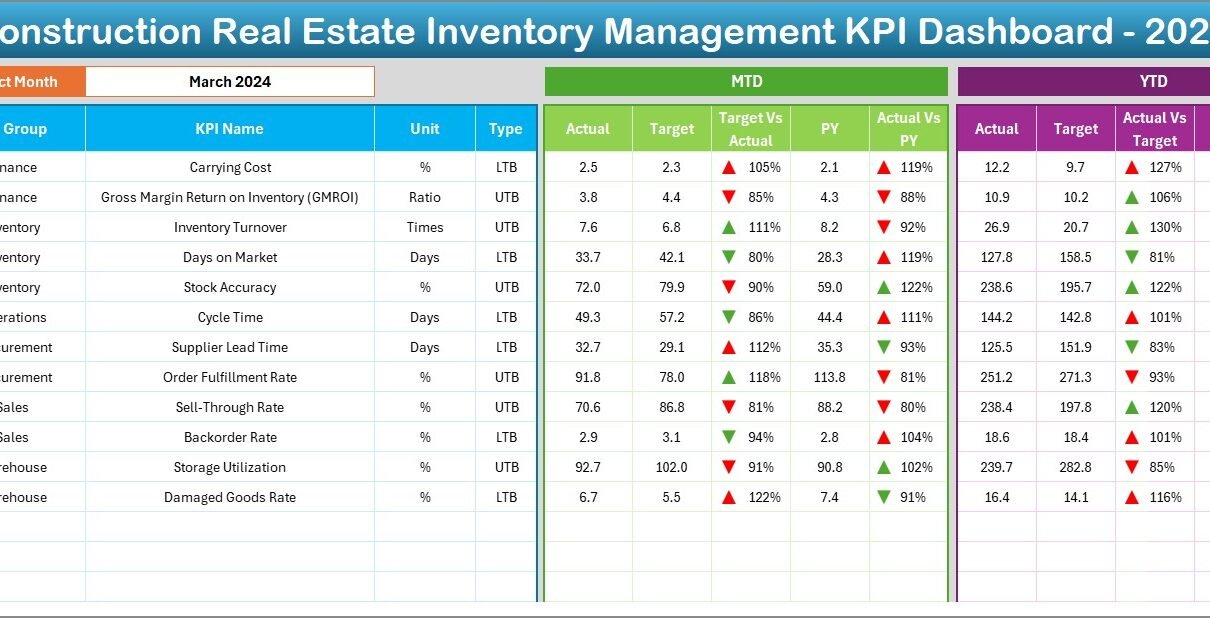
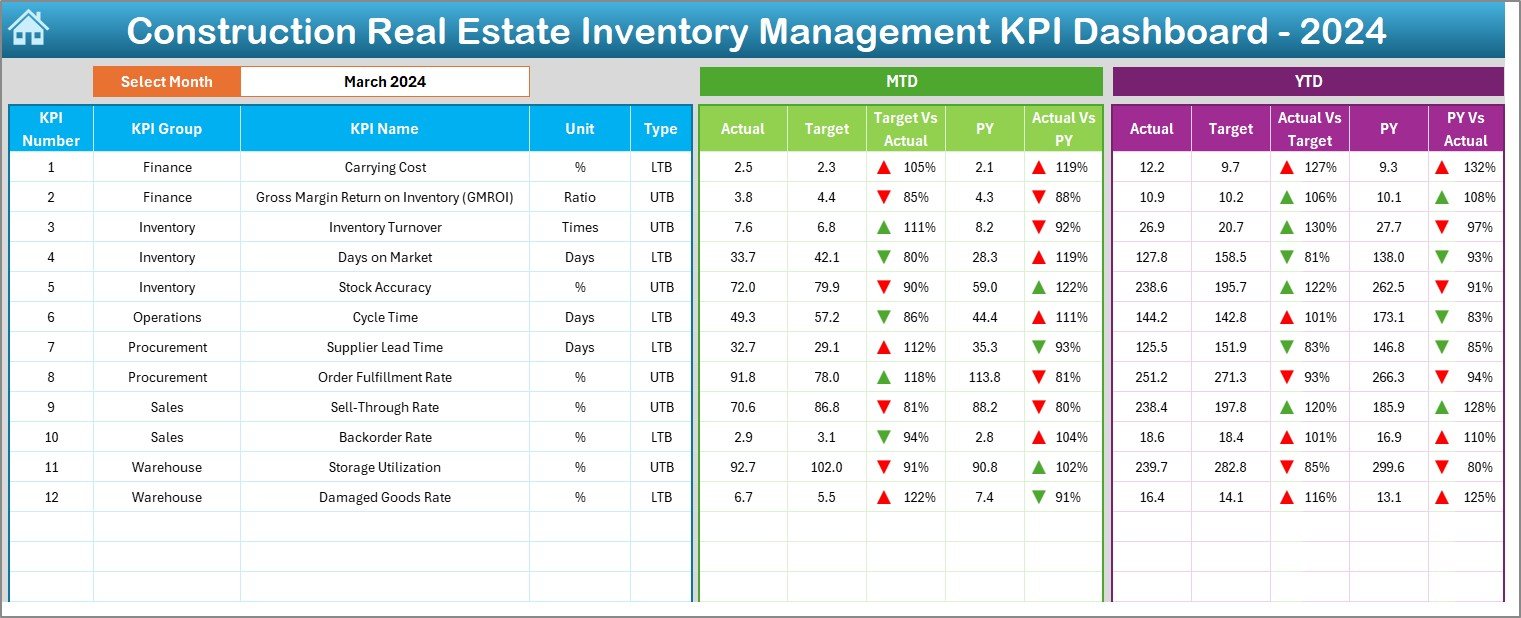
Dashboard Sheet Tab
-
Purpose: The main analytical page that gives a full performance overview.
Features:
- A Month selection drop-down in cell D3 allows you to filter the dashboard data.
- Displays MTD Actual, Target, and Previous Year values.
- Compares Target vs Actual and Previous Year vs Actual using conditional formatting with up/down arrows.
- Shows YTD Actual, Target, and Previous Year data for a broader trend analysis.
-
Benefit: Allows quick understanding of inventory health and progress in real time.
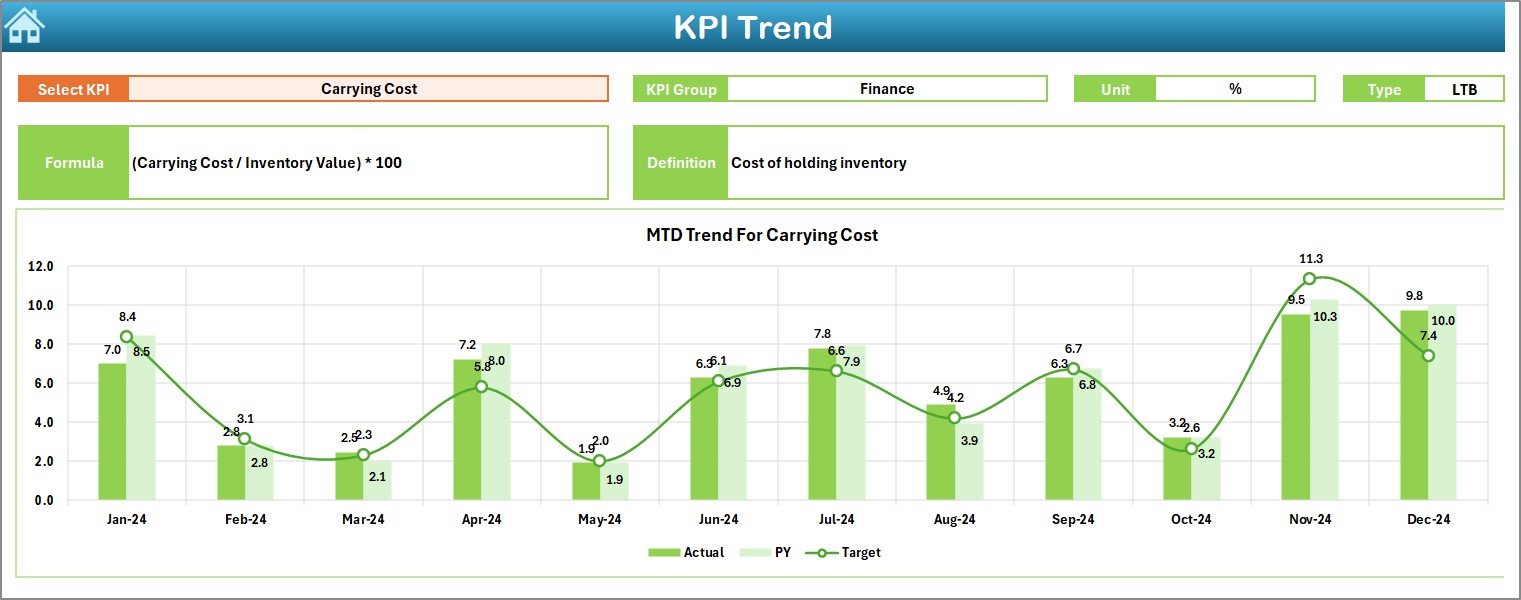
KPI Trend Sheet Tab
-
Purpose: Provides detailed performance trends for a selected KPI.
Features:
- Drop-down in cell C3 to select a specific KPI.
- Displays KPI Group, Unit, Type (Lower the Better or Upper the Better), formula, and definition.
- Includes MTD and YTD trend charts for Actual, Target, and Previous Year data.
-
Benefit: Enables in-depth KPI analysis to identify problem areas and improvement opportunities.
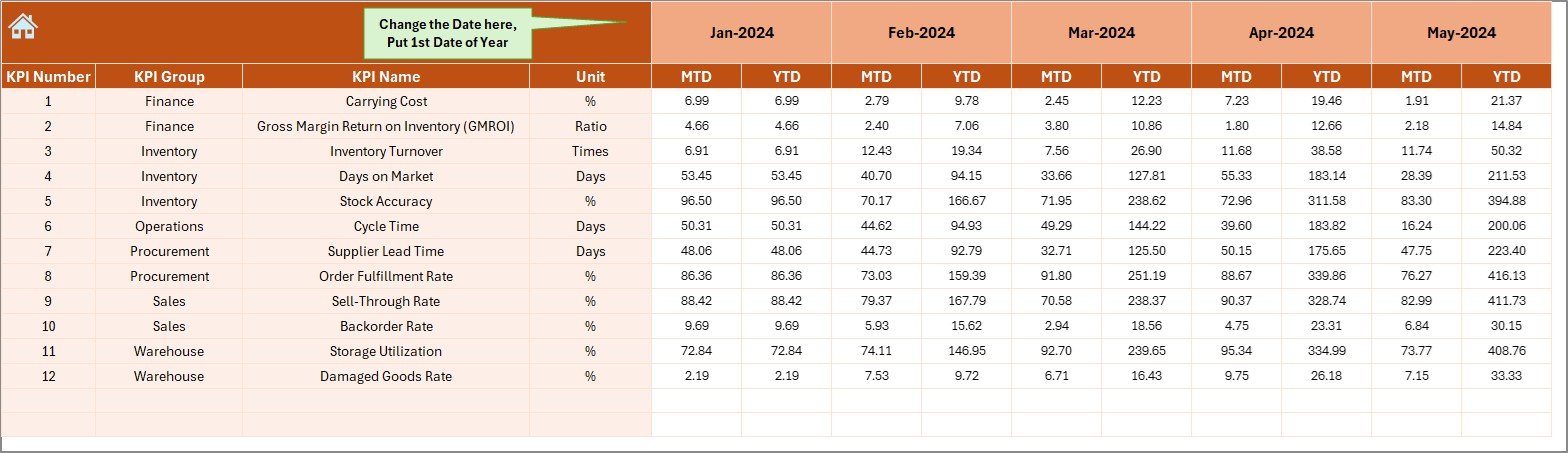
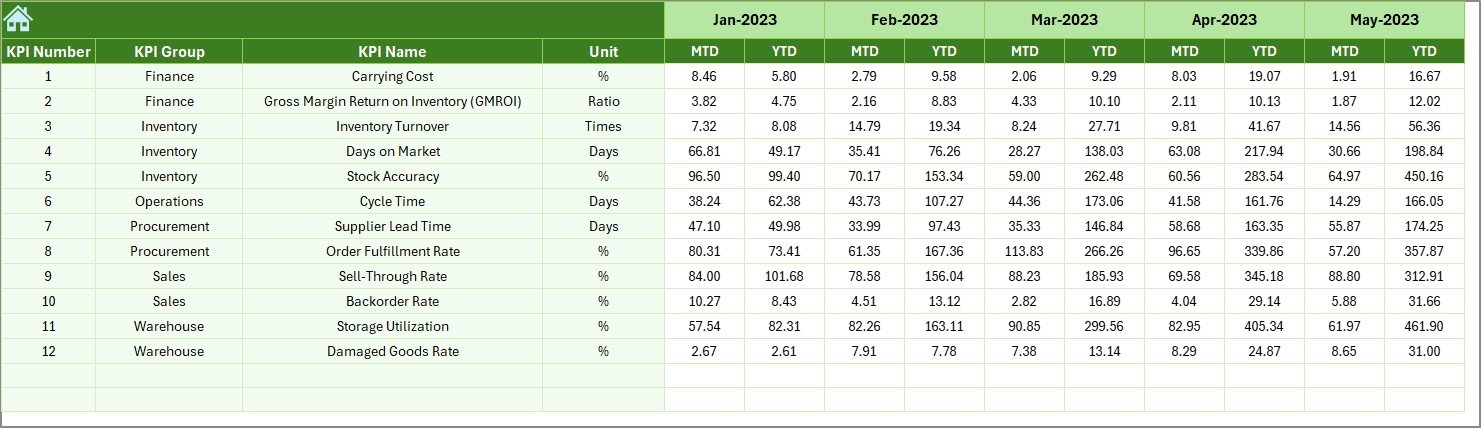
Actual Numbers Input Sheet
-
Purpose: Data entry area for recording actual results.
Features:
- Allows monthly MTD and YTD actual number entry.
- Month can be set in cell E1.
-
Benefit: Ensures accurate tracking by feeding real performance data into the dashboard.
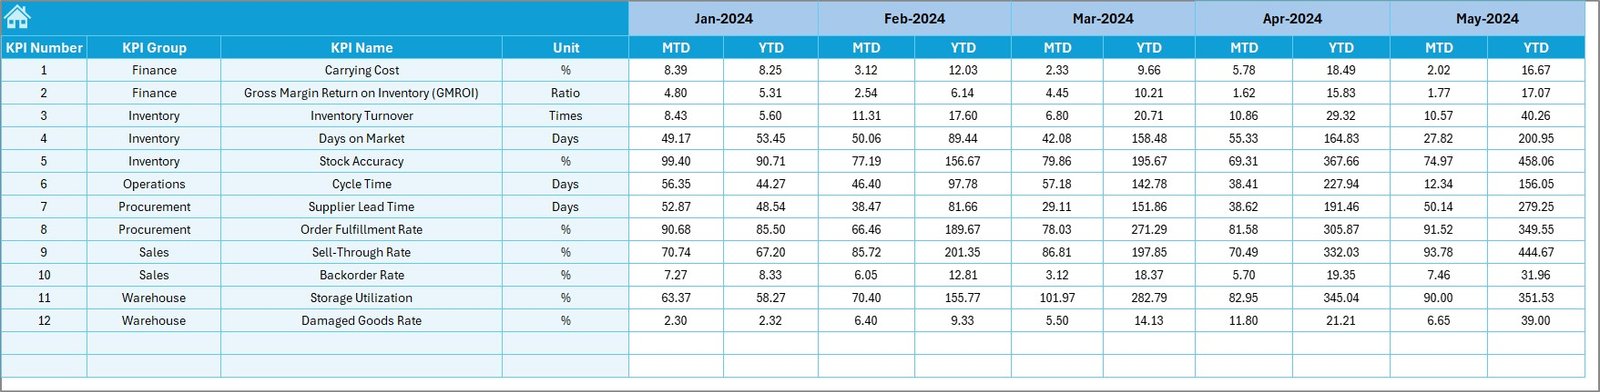
Target Sheet Tab
-
Purpose: Stores target values for each KPI.
Features:
- MTD and YTD targets for each month.
-
Benefit: Helps measure progress and determine if performance is meeting expectations.
Click to Purchases Construction and Real Estate Inventory Management KPI Dashboard in Excel
Previous Year Number Sheet Tab
-
Purpose: Stores last year’s data for comparison.
-
Benefit: Enables year-on-year performance analysis, which is essential for understanding growth or decline.
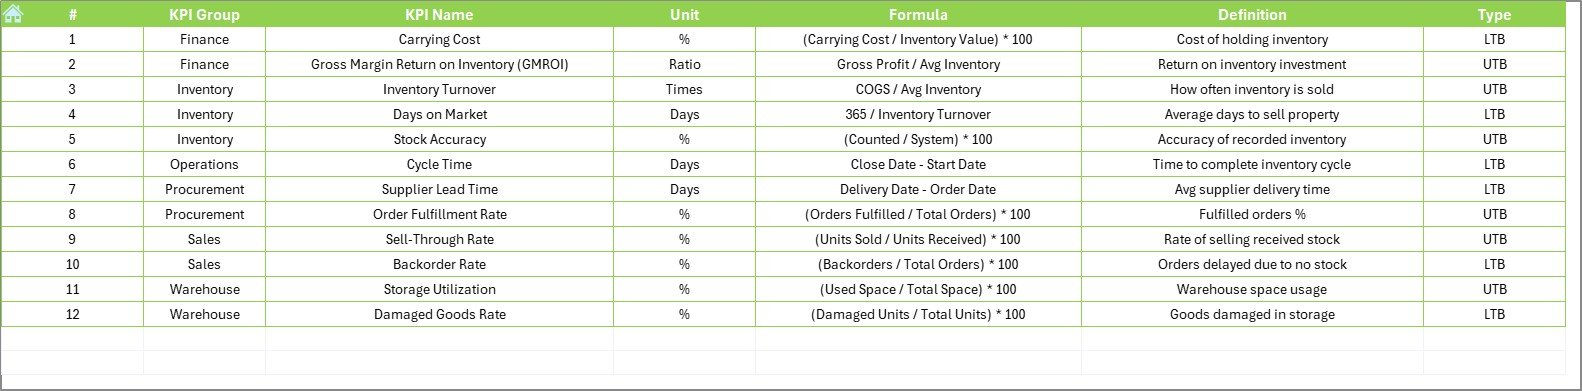
KPI Definition Sheet Tab
-
Purpose: Documents all KPI details.
Features:
- Includes KPI Name, Group, Unit, Formula, and Definition.
-
Benefit: Ensures transparency and standard understanding of all metrics.
Advantages of the Construction and Real Estate Inventory Management KPI Dashboard
Using this dashboard offers several benefits:
-
Centralized Data Management: All inventory performance data is stored in one file.
-
Improved Decision Making: Real-time insights enable faster and better decisions.
-
Customizable for Projects: Can be tailored for small, medium, or large-scale projects.
-
Time-Saving: Automated calculations and visuals reduce manual reporting work.
-
User-Friendly Interface: Easy navigation and simple data entry make it suitable for all skill levels.
-
Year-on-Year Comparison: Historical data tracking improves forecasting accuracy.
Key KPIs You Can Track in the Dashboard
Here are examples of KPIs you might include:
-
Inventory Turnover Ratio
-
Stock-Out Rate
-
Inventory Accuracy %
-
On-Time Delivery %
-
Average Days to Use Stock
-
Inventory Carrying Cost %
-
Material Waste Percentage
-
Purchase Order Lead Time
-
Storage Utilization %
-
Inventory Value vs Budget
Best Practices for Using the Dashboard
To maximize the benefits of your KPI dashboard, follow these best practices:
-
Update Data Regularly: Enter actual numbers consistently to maintain accuracy.
-
Review Trends Monthly: Use the KPI Trend sheet to spot issues early.
-
Set Realistic Targets: Base targets on historical data and realistic project timelines.
-
Standardize KPI Definitions: Ensure all team members understand KPI meanings.
-
Leverage Conditional Formatting: Use colors and arrows to highlight critical variances.
-
Backup Your File: Maintain multiple copies to prevent data loss.
How This Dashboard Helps Construction and Real Estate Companies
This tool provides a clear visual story of your inventory performance. For example:
-
Project Managers can identify material shortages before they affect project timelines.
-
Procurement Teams can track supplier delivery performance.
-
Finance Teams can monitor inventory cost against budgets.
-
Executives can evaluate overall efficiency at a glance.
By aligning everyone with the same data, the dashboard reduces miscommunication and increases accountability.
Step-by-Step Guide to Using the Dashboard
-
Open the Home Sheet and click the button for the data entry section.
-
Enter Actual Data in the Actual Numbers Input sheet.
-
Set Targets for each KPI in the Target Sheet.
-
Add Previous Year Data for comparison.
-
Go to the Dashboard Sheet and select the desired month from the drop-down.
-
Review KPI Performance and check trends in the KPI Trend Sheet.
-
Take Corrective Actions if actual values are below targets.
Conclusion
The Construction and Real Estate Inventory Management KPI Dashboard in Excel is a cost-effective, efficient, and user-friendly way to track inventory performance. By combining visual analytics with detailed KPI data, it helps businesses optimize inventory, reduce costs, and improve project delivery.
With regular use and adherence to best practices, this dashboard can become a key decision-making tool for your organization.
Frequently Asked Questions (FAQs)
1. Can I customize the KPIs in the dashboard?
Yes. You can add, remove, or modify KPIs in the KPI Definition Sheet based on your project needs.
2. Do I need advanced Excel skills to use this dashboard?
No. Basic Excel knowledge is enough to operate this dashboard, as it uses drop-down menus and simple data entry fields.
3. Can this dashboard be used for multiple projects at once?
Yes. You can create separate copies for each project or customize it to handle multiple projects in one file.
4. How often should I update the data?
It is recommended to update the data at least once a month or as soon as actual performance numbers are available.
5. Can I use this dashboard in Google Sheets?
Yes, but some advanced formatting and conditional formatting may need adjustments.
Visit our YouTube channel to learn step-by-step video tutorials