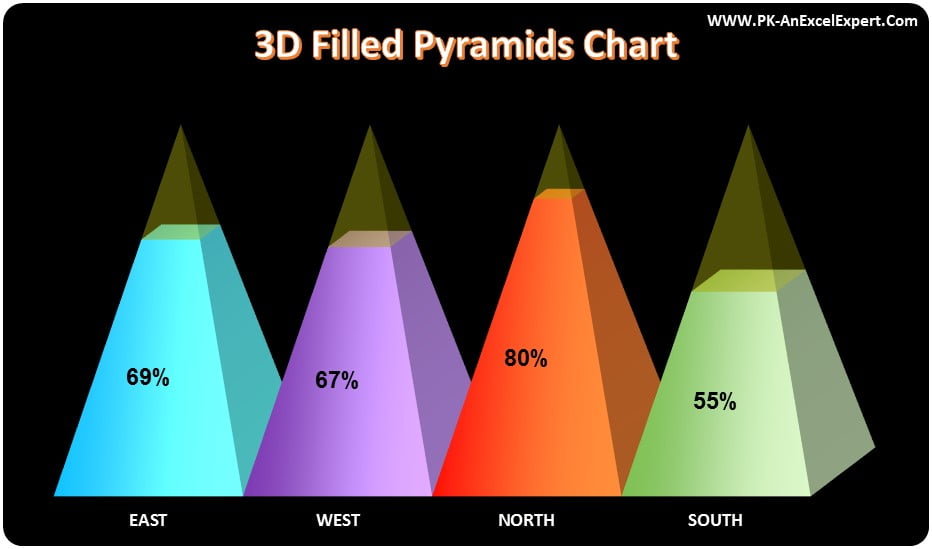
3D Filled Pyramids Chart in Excel
Creating a 3D Filled Pyramids Chart in Excel allows you to visualize data in a visually appealing and easily understandable format. This chart type adds depth and style to your
Transforming Data into Decisions