Managing procurement in clinics is never simple. Clinics must handle multiple vendors, hundreds of invoices, strict budgets, shipping costs, and approval processes at the same time. However, when procurement data stays scattered across Excel files, emails, and manual registers, decision-making slows down. As a result, costs increase, visibility drops, and compliance risks grow.
That is exactly why a Clinic Procurement Dashboard in Excel becomes a powerful and practical solution.
In this detailed guide, you will learn what a Clinic Procurement Dashboard in Excel is, how it works, why clinics need it, and how each dashboard page supports procurement decisions. Moreover, you will explore advantages, best practices, and frequently asked questions so you can confidently implement this dashboard in real-world clinic operations.
Click to Purchases Clinic Procurement Dashboard in Excel
What Is a Clinic Procurement Dashboard in Excel?
A Clinic Procurement Dashboard in Excel is a ready-to-use, interactive reporting tool that tracks, analyzes, and visualizes procurement performance across clinics.
Instead of reviewing thousands of rows of purchase data, you can monitor procurement KPIs through charts, cards, and slicers. Therefore, procurement managers, finance teams, and clinic administrators gain instant clarity.
This dashboard focuses on:
-
Procurement cost control
-
Vendor performance monitoring
-
Invoice approval efficiency
-
Budget tracking and variance analysis
-
Category-wise and department-wise spending
Because Excel powers the dashboard, teams can use it without investing in expensive BI tools. At the same time, the dashboard delivers professional-grade insights.
Why Do Clinics Need a Procurement Dashboard in Excel?
Clinic procurement involves more than purchasing supplies. Clinics must ensure quality, control costs, and meet compliance standards. However, manual tracking makes this task difficult.
A Clinic Procurement Dashboard in Excel helps because:
-
It centralizes procurement data in one place
-
It improves cost visibility across departments
-
It highlights high-priority invoices instantly
-
It supports faster approvals and better vendor selection
As a result, clinics can make informed procurement decisions while staying within budget.
How Does a Clinic Procurement Dashboard in Excel Work?
The dashboard connects structured procurement data with visual analytics. First, users maintain a clean Data Sheet. Then, Excel formulas, pivot tables, and charts process the data. Finally, interactive slicers allow users to filter insights by clinic type, department, category, or month.
Because everything stays within Excel, updates happen instantly when users refresh the data.
Dashboard Structure: What Pages Are Included?
This Clinic Procurement Dashboard in Excel includes five analytical pages along with supporting sheets. Each page focuses on a specific procurement dimension.
Let us explore each page in detail.
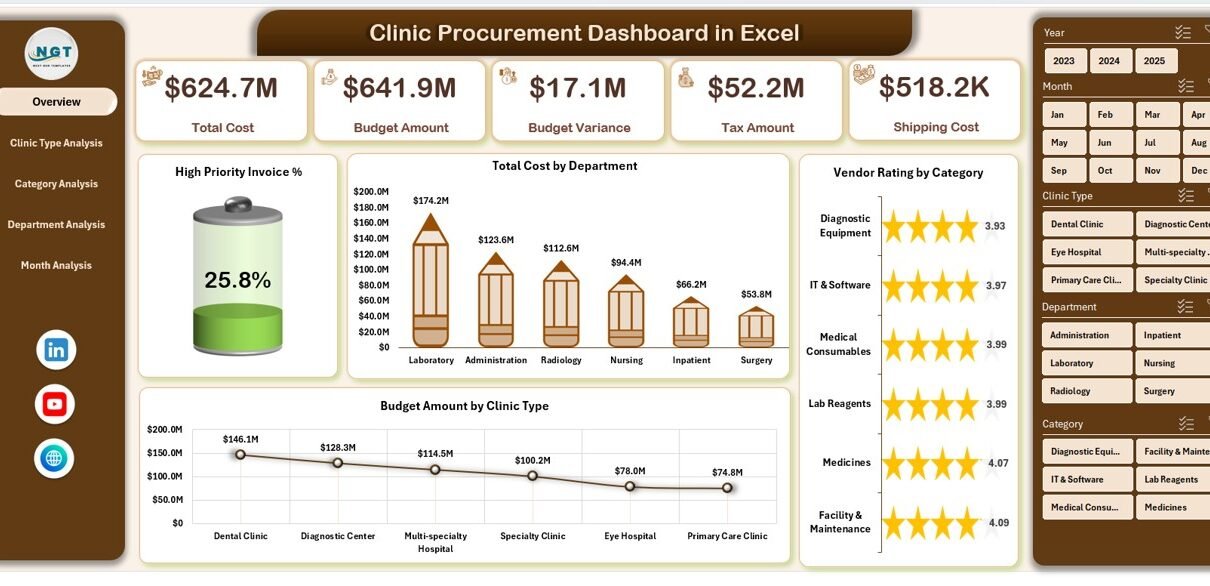
Overview Page: How Does the Overview Page Help Decision-Makers?
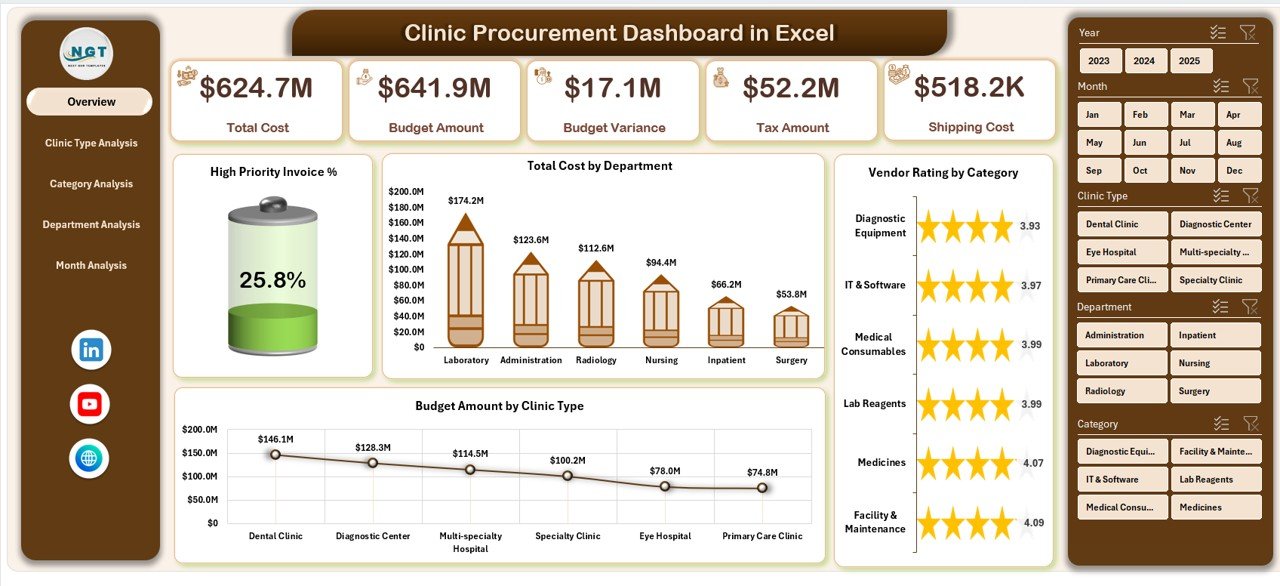
The Overview Page works as the command center of the dashboard. From this page, users can quickly understand overall procurement performance.
Click to Purchases Clinic Procurement Dashboard in Excel
Key Elements of the Overview Page
📍 Page Navigator
-
Located on the left side
-
Enables smooth navigation across all dashboard pages
📊 KPI Cards
-
High Priority Invoice %
-
Total Procurement Cost
📈 Key Charts
-
High Priority Invoice %
-
Total Cost by Department
-
Vendor Rating by Category
-
Budget Amount by Clinic Type
Why the Overview Page Matters
The Overview Page provides instant answers to critical questions:
-
Which departments spend the most?
-
Which categories show vendor quality issues?
-
Which clinic types consume higher budgets?
Therefore, management can identify problem areas without deep analysis.
Clinic Type Analysis Page: Why Compare Procurement by Clinic Type?
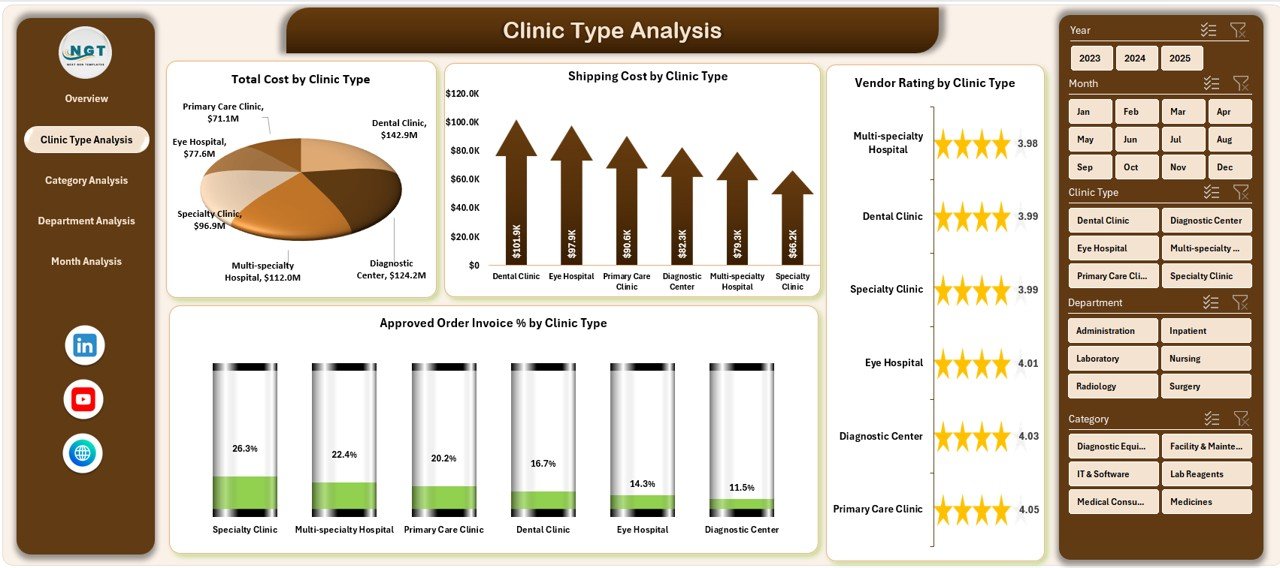
Different clinic types follow different procurement patterns. For example, specialty clinics may require higher-cost equipment, while general clinics focus on consumables.
Charts Included in Clinic Type Analysis
-
Total Cost by Clinic Type
-
Shipping Cost by Clinic Type
-
Vendor Rating by Clinic Type
-
Approved Order Invoice % by Clinic Type
Insights You Can Gain
This page helps answer:
-
Which clinic types generate higher shipping costs?
-
Which clinic types face approval delays?
-
Where does vendor quality differ across clinics?
As a result, procurement teams can optimize purchasing strategies for each clinic type.
Category Analysis Page: How Does Category-Level Tracking Improve Control?
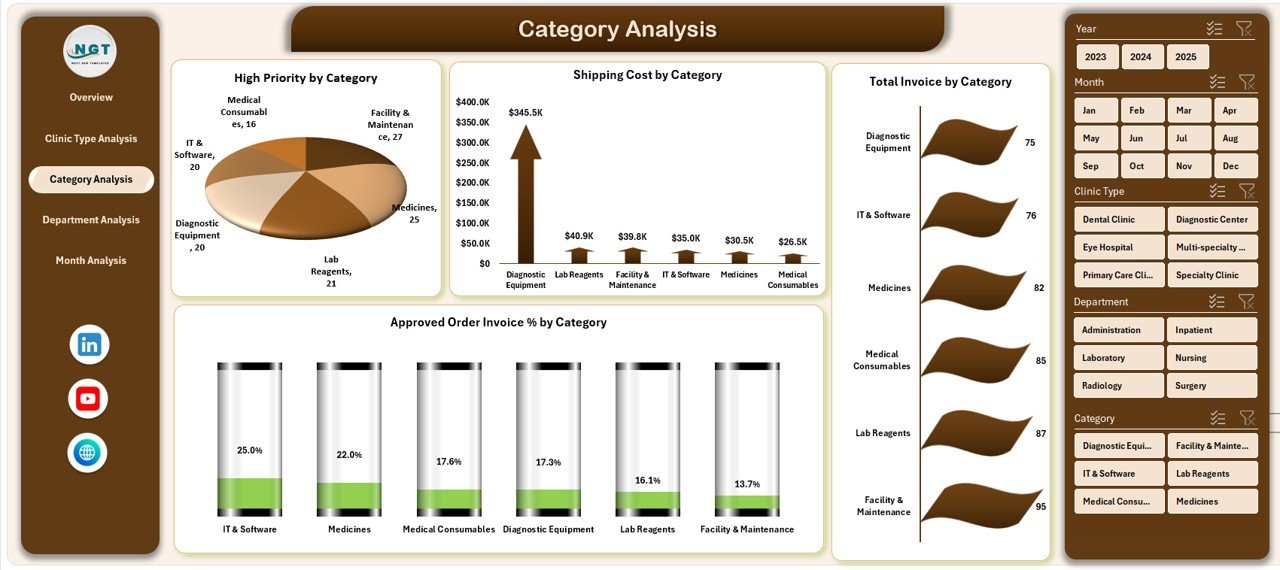
Procurement categories play a crucial role in cost and quality management. Without category-level visibility, clinics often overspend.
Click to Purchases Clinic Procurement Dashboard in Excel
Charts Included in Category Analysis
-
High Priority Invoices by Category
-
Shipping Cost by Category
-
Total Invoice Amount by Category
-
Approved Order Invoice % by Category
Benefits of Category Analysis
This page helps clinics:
-
Identify cost-heavy categories
-
Reduce unnecessary shipping expenses
-
Improve approval efficiency
-
Focus negotiations on high-impact categories
Therefore, category-level insights support smarter sourcing decisions.
Department Analysis Page: Why Track Procurement by Department?
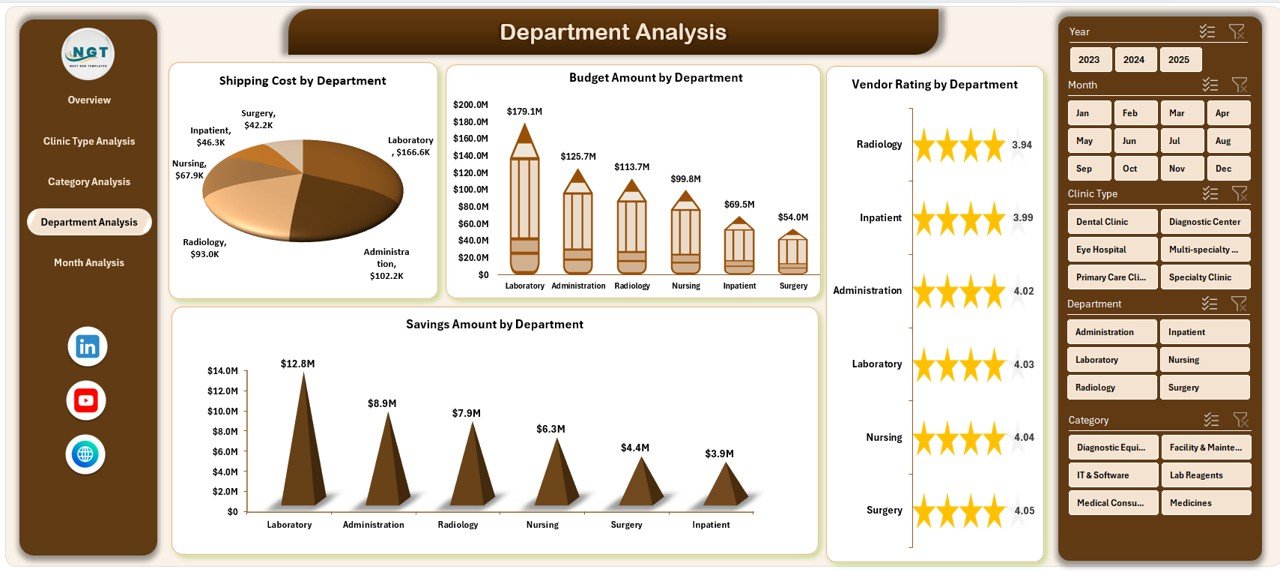
Each department follows unique procurement behavior. Some departments may overspend, while others manage budgets efficiently.
Charts Included in Department Analysis
-
Shipping Cost by Department
-
Budget Amount by Department
-
Vendor Rating by Department
-
Savings Amount by Department
What This Page Reveals
Using this page, managers can:
-
Compare department-wise spending
-
Identify departments with poor vendor ratings
-
Track savings achieved through negotiation
-
Monitor shipping cost efficiency
As a result, clinics can enforce accountability across departments.
Month Analysis Page: How Does Monthly Tracking Improve Forecasting?
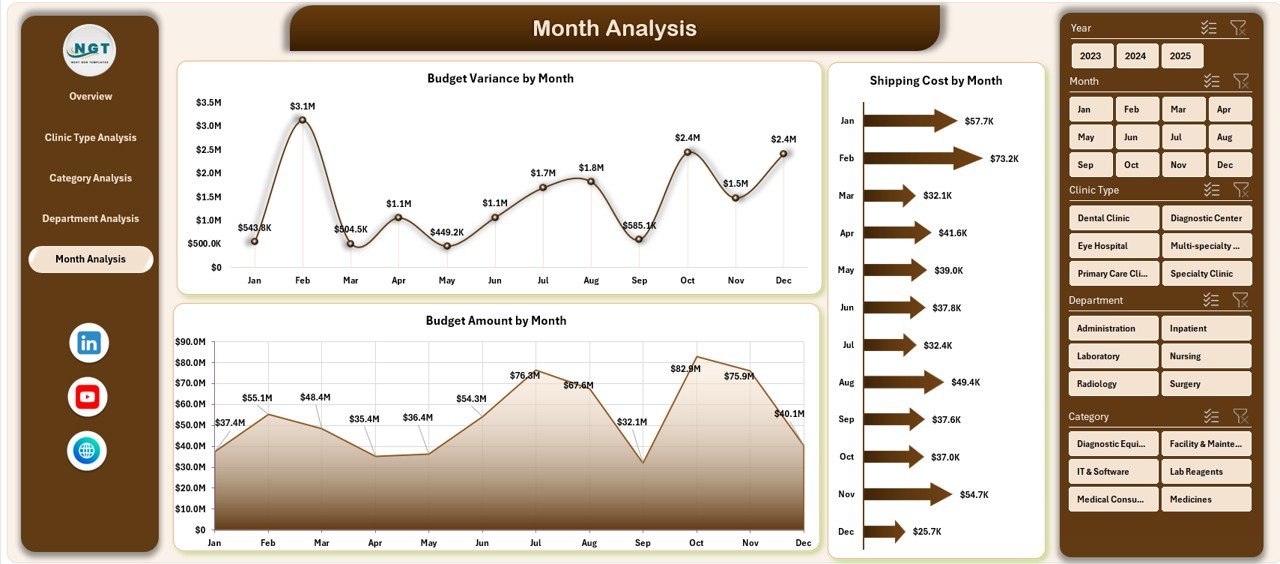
Procurement performance changes throughout the year. Therefore, month-wise analysis plays a critical role.
Charts Included in Month Analysis
-
Shipping Cost by Month
-
Budget Amount by Month
-
Budget Variance by Month
Why Monthly Analysis Matters
This page helps users:
-
Detect seasonal procurement trends
-
Identify months with budget overruns
-
Improve future budget forecasting
Because of this, finance teams can plan procurement budgets more accurately.
Supporting Sheets: Why Are They Important?
Click to Purchases Clinic Procurement Dashboard in Excel
Data Sheet
The Data Sheet stores raw procurement data such as:
-
Invoice details
-
Department names
-
Categories
-
Clinic types
-
Vendor ratings
-
Budget and actual amounts
Clean and structured data ensures accurate dashboard outputs.
Support Sheet
The Support Sheet manages:
-
Drop-down lists
-
Validation rules
-
Lookup tables
As a result, data entry stays consistent and error-free.
Advantages of Clinic Procurement Dashboard in Excel
Using a Clinic Procurement Dashboard in Excel delivers multiple business benefits.
Key Advantages
-
✅ Centralized procurement reporting
-
✅ Real-time cost visibility
-
✅ Improved invoice approval tracking
-
✅ Better vendor performance evaluation
-
✅ Strong budget control
-
✅ No additional software cost
Moreover, Excel familiarity reduces training effort.
Who Can Use a Clinic Procurement Dashboard in Excel?
This dashboard suits multiple roles:
-
Clinic administrators
-
Procurement managers
-
Finance teams
-
Operations heads
-
Compliance officers
Because the dashboard uses Excel, both technical and non-technical users can operate it easily.
How Does This Dashboard Support Better Decision-Making?
The dashboard converts raw procurement data into actionable insights. Instead of guessing, decision-makers rely on facts.
For example:
-
High shipping costs trigger vendor renegotiation
-
Low approval rates signal process bottlenecks
-
Poor vendor ratings prompt supplier reviews
As a result, clinics improve procurement efficiency and reduce waste.
Best Practices for the Clinic Procurement Dashboard in Excel
Click to Purchases Clinic Procurement Dashboard in Excel
To get maximum value from the dashboard, follow these best practices.
1. Maintain Clean Data
-
Use standardized department names
-
Avoid duplicate vendor entries
-
Validate invoice dates
2. Update Data Regularly
-
Update procurement data weekly or monthly
-
Refresh pivot tables after updates
3. Use Slicers Effectively
-
Filter by clinic type
-
Compare departments side by side
-
Analyze category trends quickly
4. Review KPIs Periodically
-
Track high priority invoice trends
-
Monitor budget variance monthly
5. Combine Dashboard Insights with Action
-
Use insights to renegotiate contracts
-
Improve approval workflows
-
Optimize vendor selection
Following these practices ensures long-term dashboard success.
Can This Dashboard Replace Procurement Software?
In many cases, yes. For small and medium clinics, this Excel dashboard provides sufficient insights without expensive procurement software. However, large hospital networks may use it as a complementary reporting tool.
How Customizable Is the Clinic Procurement Dashboard in Excel?
The dashboard offers high customization:
-
Add new KPIs
-
Modify charts
-
Include additional clinic types
-
Adjust budget logic
Because Excel supports flexibility, clinics can adapt the dashboard as requirements change.
Is This Dashboard Suitable for Multi-Clinic Networks?
Yes. The dashboard can scale for multiple clinics by:
-
Adding clinic identifiers
-
Expanding data rows
-
Using slicers for filtering
As a result, multi-clinic networks gain centralized procurement visibility.
Conclusion: Why Should Clinics Use a Procurement Dashboard in Excel?
A Clinic Procurement Dashboard in Excel transforms procurement data into powerful insights. It simplifies tracking, improves cost control, enhances vendor evaluation, and supports smarter budgeting.
Because it runs in Excel, clinics avoid high software costs while still gaining advanced analytics. When used correctly, this dashboard becomes an essential decision-support tool for healthcare procurement teams.
Frequently Asked Questions (FAQs)
What is a Clinic Procurement Dashboard in Excel?
A Clinic Procurement Dashboard in Excel is an interactive tool that tracks procurement KPIs, costs, vendor performance, and budget utilization using charts and slicers.
Who should use a Clinic Procurement Dashboard?
Procurement managers, finance teams, clinic administrators, and operations leaders can use this dashboard for better procurement decisions.
Can beginners use this dashboard?
Yes. The dashboard uses Excel features like charts and slicers, making it easy for beginners.
How often should the dashboard be updated?
You should update procurement data monthly or weekly, depending on transaction volume.
Can the dashboard handle large datasets?
Yes. Excel can handle thousands of records efficiently when structured properly.
Does this dashboard require VBA?
No. The dashboard works with standard Excel formulas, pivot tables, and slicers.
Can I customize KPIs?
Yes. You can easily add, remove, or modify KPIs based on clinic requirements.
Is this dashboard suitable for audits?
Yes. The dashboard improves transparency and supports audit reviews with clear data trails.
Visit our YouTube channel to learn step-by-step video tutorials