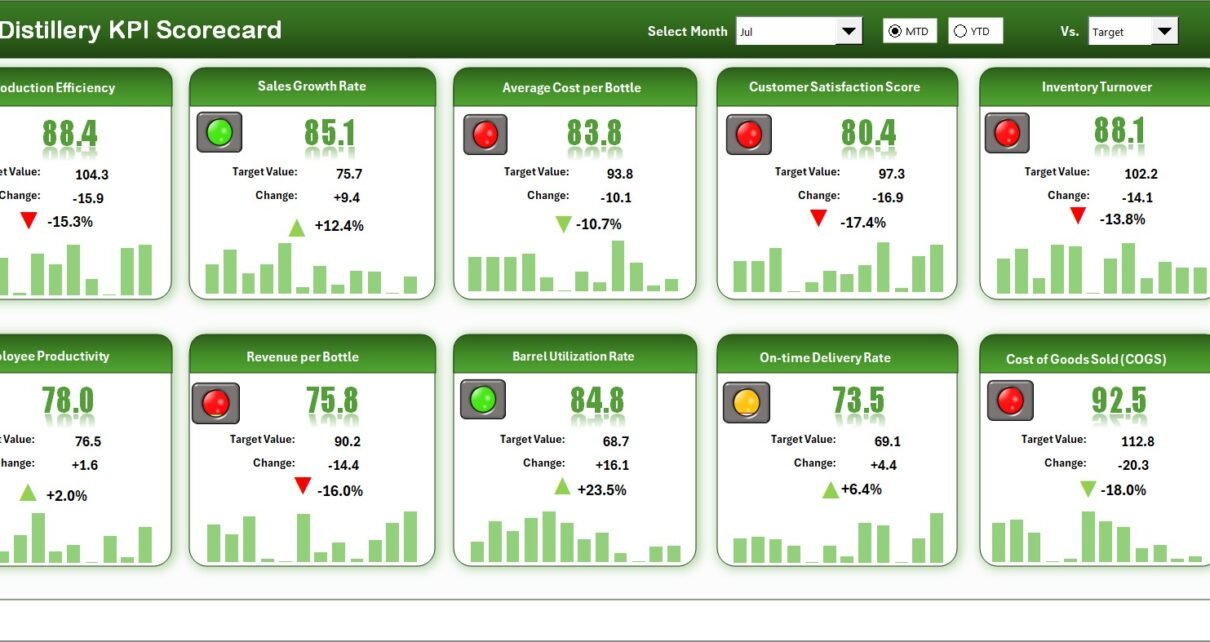
The Distillery KPI Scorecard in Excel tracks 10+ distillery KPIs across 4 structured worksheets, with MTD and YTD trend analysis, color-coded performance indicators, and dropdown-driven filtering. Setup takes under 10 minutes — just replace the sample data and every metric updates automatically.
🌍 Join 8,400+ teams in 40+ countries using NextGenTemplates to replace paid SaaS tools with one-time-purchase Excel, Google Sheets, Power BI, and HTML templates.
✅ Instant download · One-time payment · No subscription · No per-user fees · Lifetime access
🔑 Key Features of Distillery KPI Scorecard in Excel
📊 Scorecard Sheet (Main Interface) — The Distillery KPI Scorecard in Excel displays all KPI performance in a single view. Select the month, MTD, or YTD using dropdown menus. Compare actual values against targets with color-coded visual indicators that flag underperforming metrics instantly. This scorecard tracks distillery-specific KPIs including spirit yield per batch, fermentation efficiency, cask fill rate, revenue per liter, aging loss percentage, and distribution fill rate.
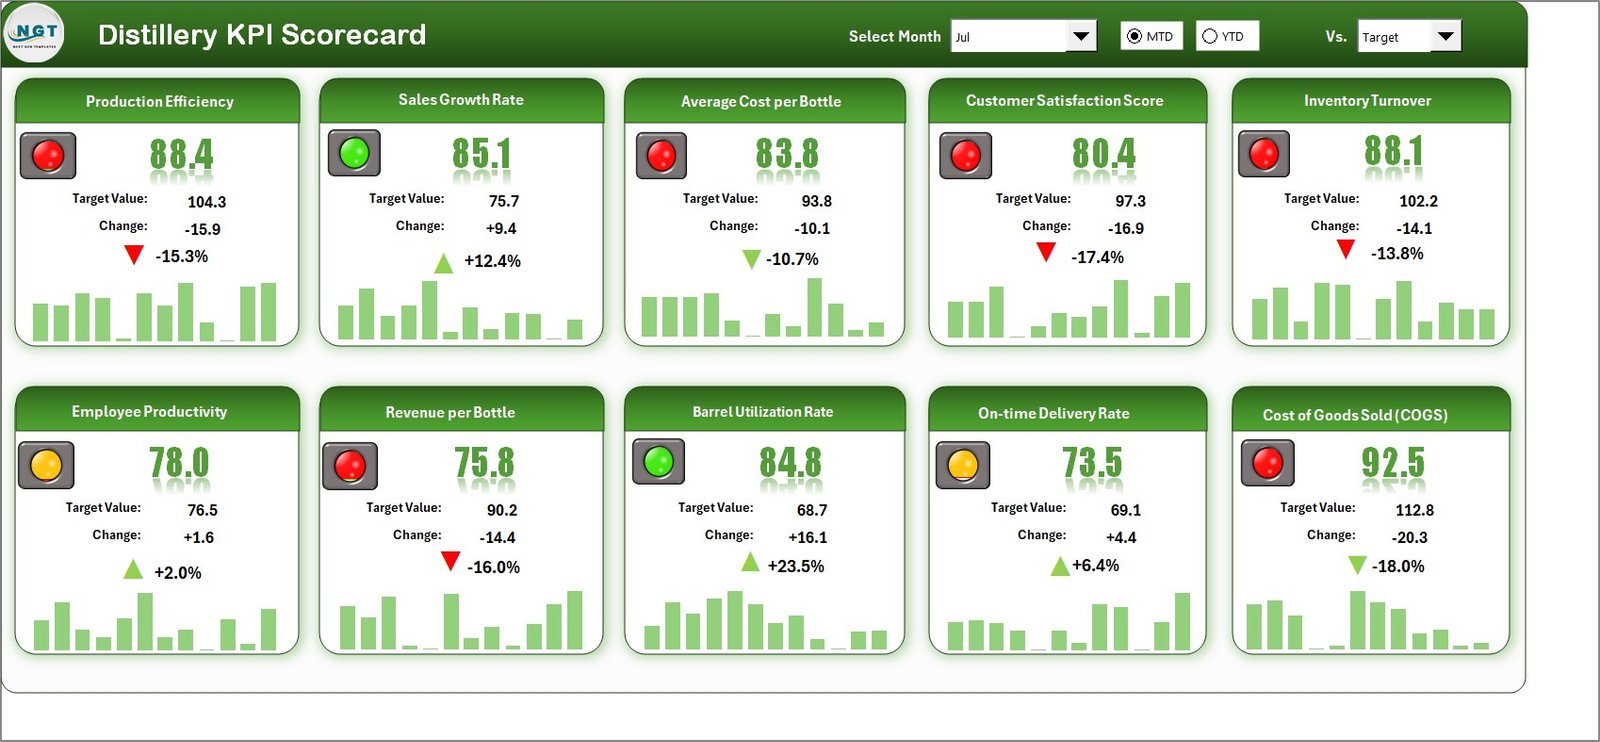 Distillery KPI Scorecard in Excel
📈 KPI Trend Sheet — Select any KPI name from the dropdown at cell C3. The sheet displays KPI Group, Unit of KPI, Type (Lower the Better or Upper the Better), Formula, and Definition. MTD and YTD trend charts show Actual, Target, and Previous Year numbers side by side for each month, making seasonal patterns visible at a glance.
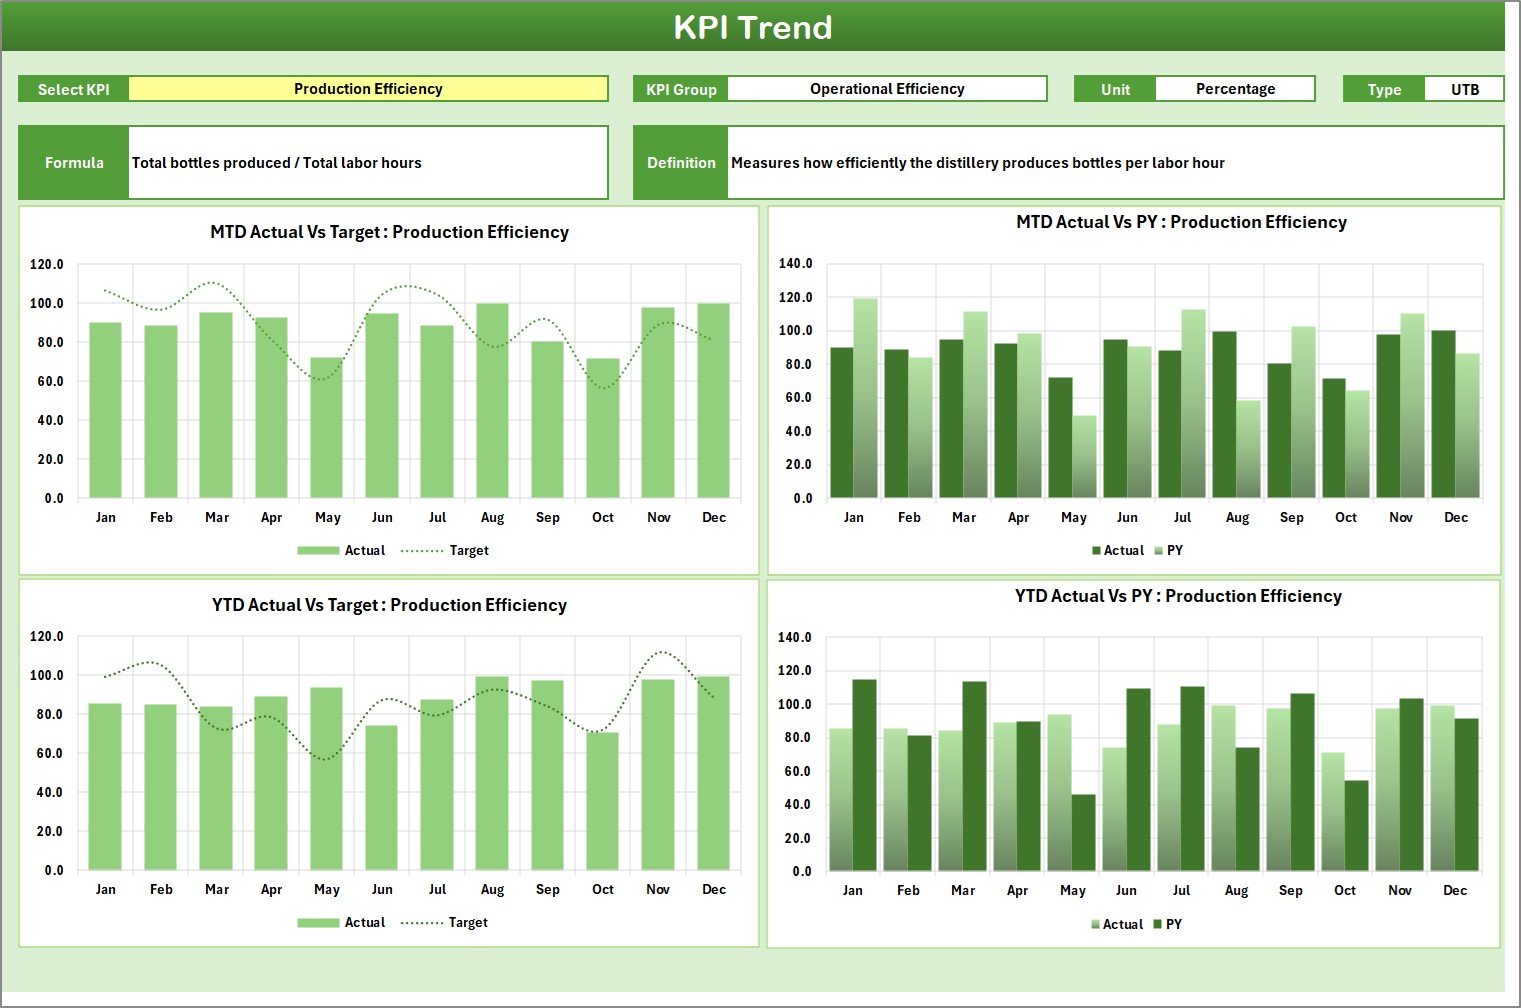 KPI Trend Sheet
🧾 Input Data Sheet — Enter actual values, targets, and other metrics for each KPI in this centralized data entry area. Update monthly data as new results become available to keep the scorecard current. The sheet supports both MTD and YTD calculations automatically.
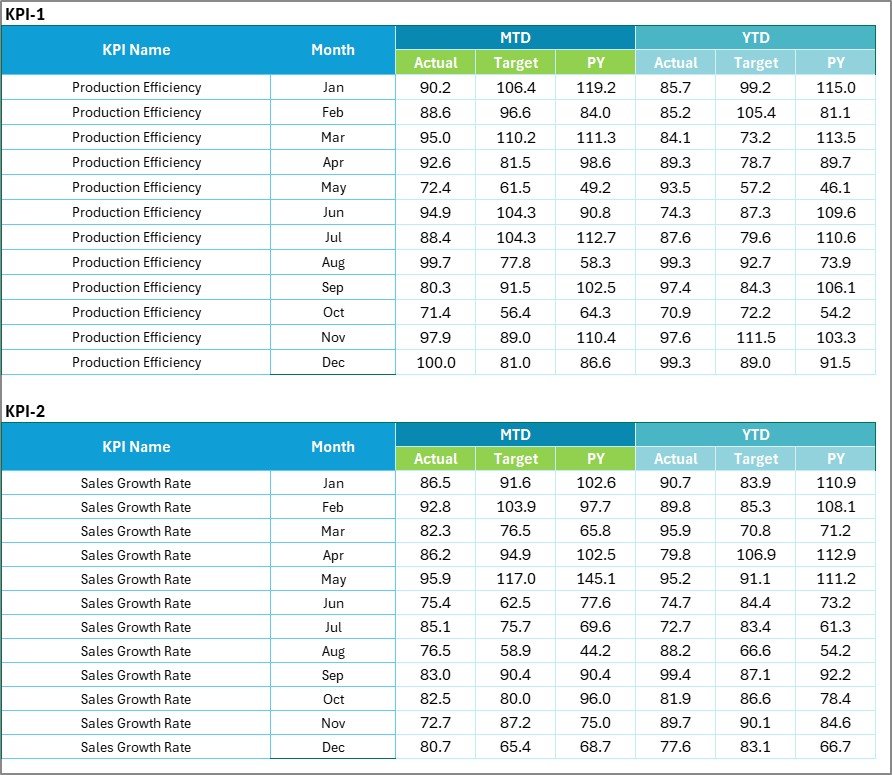 Input Data Sheet
📘 KPI Definition Sheet — Enter the KPI Name, KPI Group, Unit, Formula, and KPI Definition for each metric you track. This acts as a central reference ensuring consistency across your distillery team and reporting cycles.
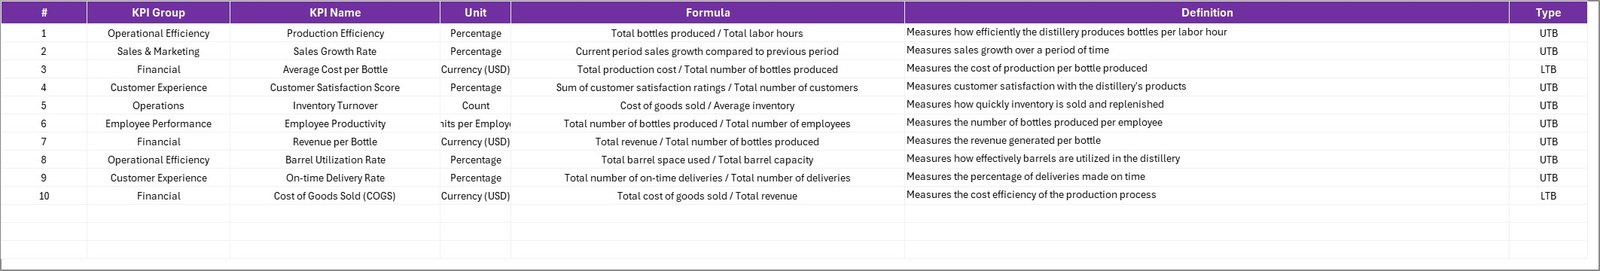 KPI Definition Sheet
📦 What’s Inside the Distillery KPI Scorecard in Excel
✅ Scorecard Sheet — Real-time KPI overview with MTD and YTD comparison, actual vs target vs previous year tracking, and color-coded performance arrows
✅ KPI Trend Sheet — Individual KPI trend analysis with monthly charts for Actual, Target, and PY values
✅ Input Data Sheet — Centralized monthly data entry for all distillery KPIs
✅ KPI Definition Sheet — Standardized reference for KPI names, groups, units, formulas, and definitions
✅ Sample Data Included — Pre-loaded with realistic distillery metrics for immediate use
📊 Distillery KPI Scorecard in Excel vs. Google Sheets Equivalent vs. Drams / Orchestrated Spirits — Where This Fits
| Feature | Distillery KPI Scorecard in Excel | Google Sheets Version | Drams / Orchestrated Spirits |
|---|---|---|---|
| Cost | $12.99 one-time ✅ | $9.99 one-time | $300–$1,500/month |
| Platform | Microsoft Excel (desktop) ✅ | Google Sheets (browser) | Cloud SaaS |
| Setup Time | Under 10 minutes ✅ | Under 10 minutes | 2–6 weeks |
| Real-Time Team Collaboration | Via SharePoint/OneDrive | Built-in | Built-in |
| Customizable KPIs | Unlimited ✅ | Unlimited | Limited to plan |
| Offline Access | Full offline ✅ | Limited | No |
| MTD & YTD Trend Analysis | Yes ✅ | Yes | Yes |
| Year-1 Cost at 5 Users | $12.99 total ✅ | $9.99 total | $3,600–$18,000 |
For distilleries that want structured KPI tracking without paying $300+/month for spirits management SaaS, the Distillery KPI Scorecard in Excel sits in the sweet spot.
👥 Who This Template Is For — and Who It’s Not For
✅ This template is built for:
- 🥃 Distillery owners and production managers tracking spirit yield, fermentation efficiency, and aging metrics
- ⚙️ Operations managers at small-to-mid-size distilleries (1–50 employees)
- 📊 Spirits industry consultants who need a client-ready performance tracking tool
- 💰 Finance teams monitoring cost-per-liter, revenue, and margin metrics for craft spirits
❌ This template is NOT for:
- Enterprise distilleries needing real-time IoT sensor integration with fermentation and aging systems
- Teams requiring TTB regulatory compliance automation and excise tax reporting
⚙️ How to Use the Distillery KPI Scorecard in Excel
- Open the Excel file and navigate to the KPI Definition sheet
- Define your KPIs — enter KPI Name, Group, Unit, Formula, and Definition for each metric you want to track
- Enter target values — input monthly targets in the Input Data sheet
- Add actual performance data — update monthly actuals as results come in
- Select the month on the Scorecard sheet to view MTD and YTD performance
- Analyze trends — use the KPI Trend sheet to drill into individual KPI performance over time
💼 Real-World Use Cases
James runs a craft whiskey distillery in Kentucky with 12 employees. He uses the Distillery KPI Scorecard in Excel to track spirit yield per batch, mash efficiency, and barrel fill rates across 8 product lines. Each month, he compares actual output against targets and presents the YTD trend charts to his investors — replacing a manual spreadsheet that took 4 hours to update.
Priya manages operations at a gin distillery in Goa, India. She tracks 14 KPIs including production volume, botanical extraction rate, quality rejection rate, and inventory days on hand. The color-coded scorecard helps her flag underperforming areas in weekly team meetings without building charts from scratch every time.
David consults for three craft distilleries in Scotland. He uses the KPI Definition sheet to standardize metrics across all clients, then delivers monthly performance reports using the Scorecard sheet — saving 5+ hours per client compared to building reports manually.
❓ Frequently Asked Questions
What KPIs does the Distillery KPI Scorecard in Excel track?
The Distillery KPI Scorecard in Excel tracks 10+ customizable KPIs including spirit yield per batch, fermentation efficiency, cask fill rate, revenue per liter, aging loss percentage, and distribution fill rate. All metrics update automatically when you enter your data.
How long does it take to set up the Distillery KPI Scorecard?
Setup takes under 10 minutes. Define your KPIs in the Definition sheet, enter targets and actual data, and the scorecard generates MTD and YTD comparisons with color-coded indicators instantly.
Can I customize the KPIs in this distillery scorecard?
Yes. The KPI Definition sheet lets you add, remove, or modify any metric. Change the KPI name, group, unit, formula, and definition to match your distillery’s operations and reporting needs exactly.
How does this compare to distillery management software like Drams?
The Distillery KPI Scorecard costs $12.99 one-time versus $300–$1,500/month for Drams or Orchestrated Spirits. It covers KPI tracking and trend analysis without the complexity of full distillery management software. Ideal for distilleries wanting structured performance monitoring at a fraction of the cost.
Does this scorecard work with both MTD and YTD data?
Yes. The Scorecard sheet displays both Month-to-Date and Year-to-Date metrics side by side. The KPI Trend sheet shows monthly trend charts comparing Actual, Target, and Previous Year data for any selected KPI.
Which version of Excel do I need?
The Distillery KPI Scorecard works with Microsoft Excel 2016 and later, including Microsoft 365. No macros or VBA required — it runs entirely on formulas and conditional formatting.
Is there a Google Sheets version of this distillery scorecard?
Check our Google Sheets KPI Dashboards collection for similar distillery and beverage industry templates with real-time collaboration and cloud access.
🎥 Visit our YouTube channel for step-by-step video tutorials
👉 YouTube.com/@NextGenTemplates