In today’s fast-moving manufacturing environment, automotive parts companies generate a massive amount of data every single day. They track production quantity, material usage, costs, defects, delayed orders, revenue, and profit. However, when teams manage this data across multiple spreadsheets, they often struggle to find clear insights. As a result, decision-making becomes slow, and performance issues remain hidden.
So, how can manufacturers bring all this data together and make better decisions quickly?
The answer is the Automotive Parts Manufacturing Dashboard in Power BI.
This powerful and interactive dashboard helps manufacturers monitor production, quality, and financial performance in one place. Moreover, it transforms raw data into meaningful insights through charts, KPIs, and trend analysis. Therefore, managers can easily identify problems, improve efficiency, and increase profitability.
In this detailed guide, you will learn everything about this dashboard, including its features, benefits, best practices, and FAQs.
Click to buy Automotive Parts Manufacturing Dashboard in Power BI
An Automotive Parts Manufacturing Dashboard in Power BI is a smart reporting tool that helps manufacturing companies track key performance indicators (KPIs) in real time.
What Is an Automotive Parts Manufacturing Dashboard in Power BI?
Instead of using multiple reports, this dashboard centralizes all critical data into one interactive system. As a result, users can:
- Monitor production performance
- Track defects and quality issues
- Analyze costs and revenue
- Identify trends over time
- Make faster, data-driven decisions
Moreover, Power BI allows dynamic filtering, interactive visuals, and drill-down capabilities. Therefore, users can explore data in detail without any technical complexity.
Why Do Automotive Manufacturers Need This Dashboard?
Automotive manufacturing involves multiple processes, locations, materials, and teams. Because of this complexity, tracking performance manually becomes difficult.
However, this dashboard solves that problem effectively.
Key reasons why this dashboard is essential:
- It provides real-time insights into production and operations
- It helps identify bottlenecks and inefficiencies
- It improves quality control and defect tracking
- It enhances financial visibility and profitability analysis
- It supports faster and smarter decision-making
Therefore, companies that use such dashboards gain a strong competitive advantage.
What Are the Key Features of the Automotive Parts Manufacturing Dashboard in Power BI?
This dashboard includes 5 powerful and interactive pages, each designed to provide a specific set of insights.
Let’s explore each page in detail.
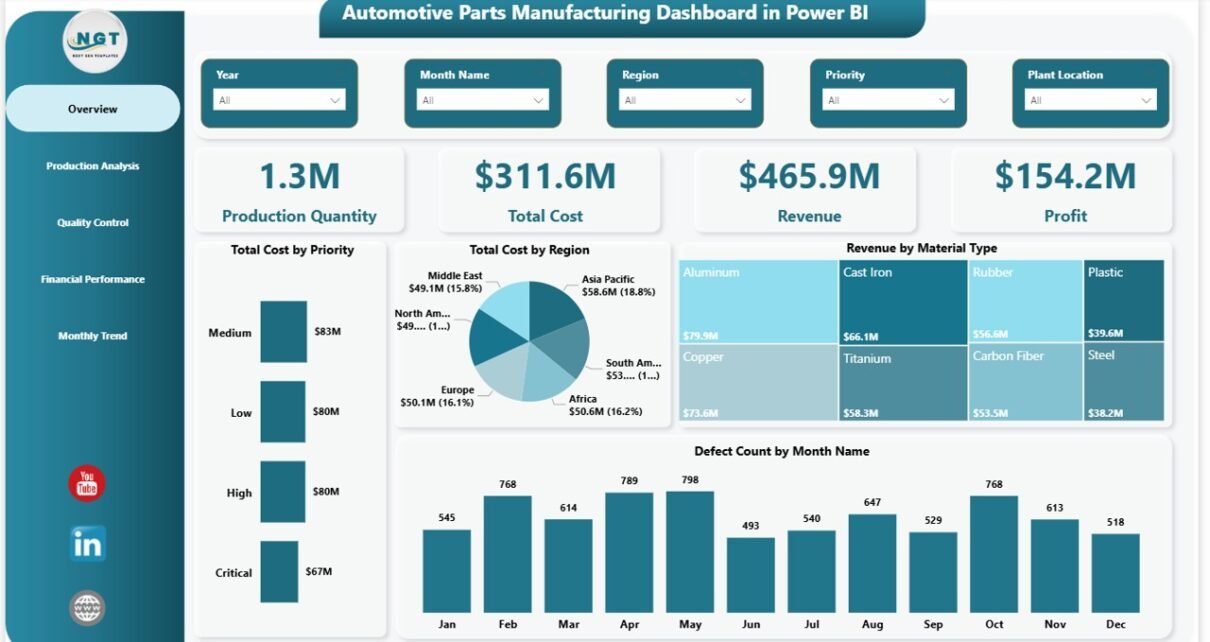
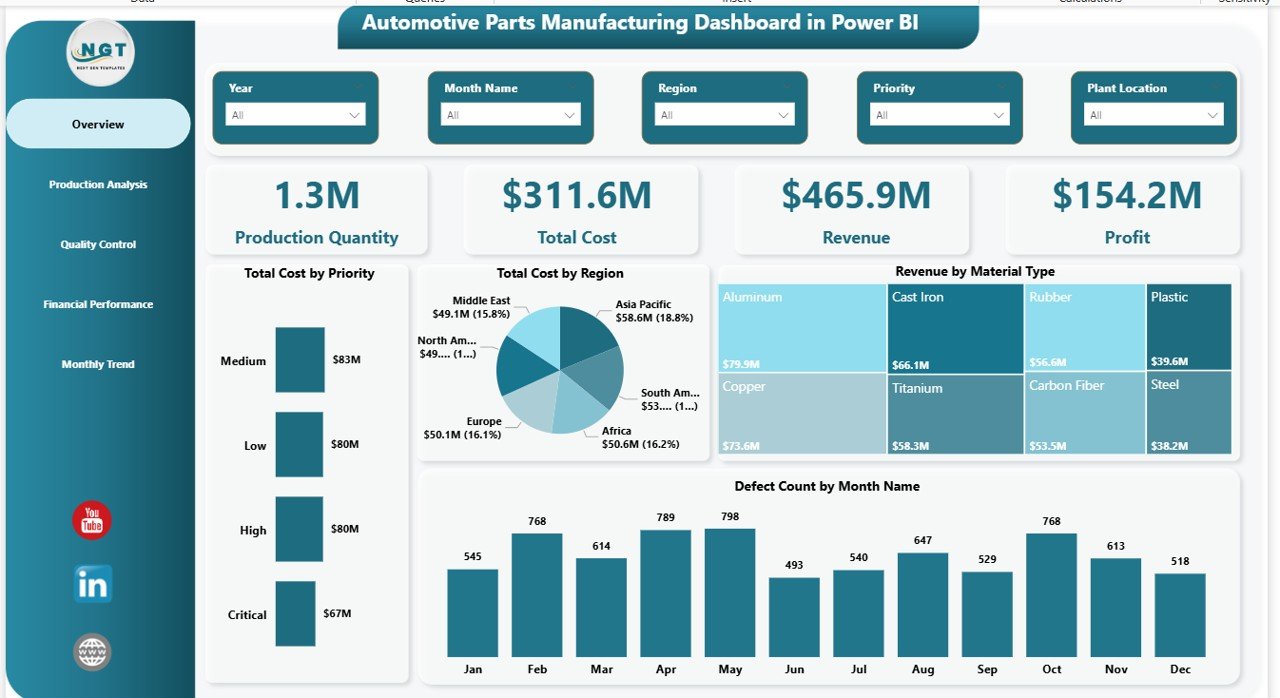
Overview Page – What Does It Show?
The Overview Page acts as the main summary of the entire dashboard. It gives a quick snapshot of business performance.
KPI Cards on Overview Page:
- Production Quantity
- Total Cost
- Revenue
- Profit
These KPIs provide a quick understanding of overall performance.
Charts Included:
- Total Cost by Priority
- Total Cost by Region
- Revenue by Material Type
- Defect Count by Month Name
Why is this page important?
Because it gives decision-makers a quick and clear overview, they can instantly identify whether performance is improving or declining.
Click to buy Automotive Parts Manufacturing Dashboard in Power BI
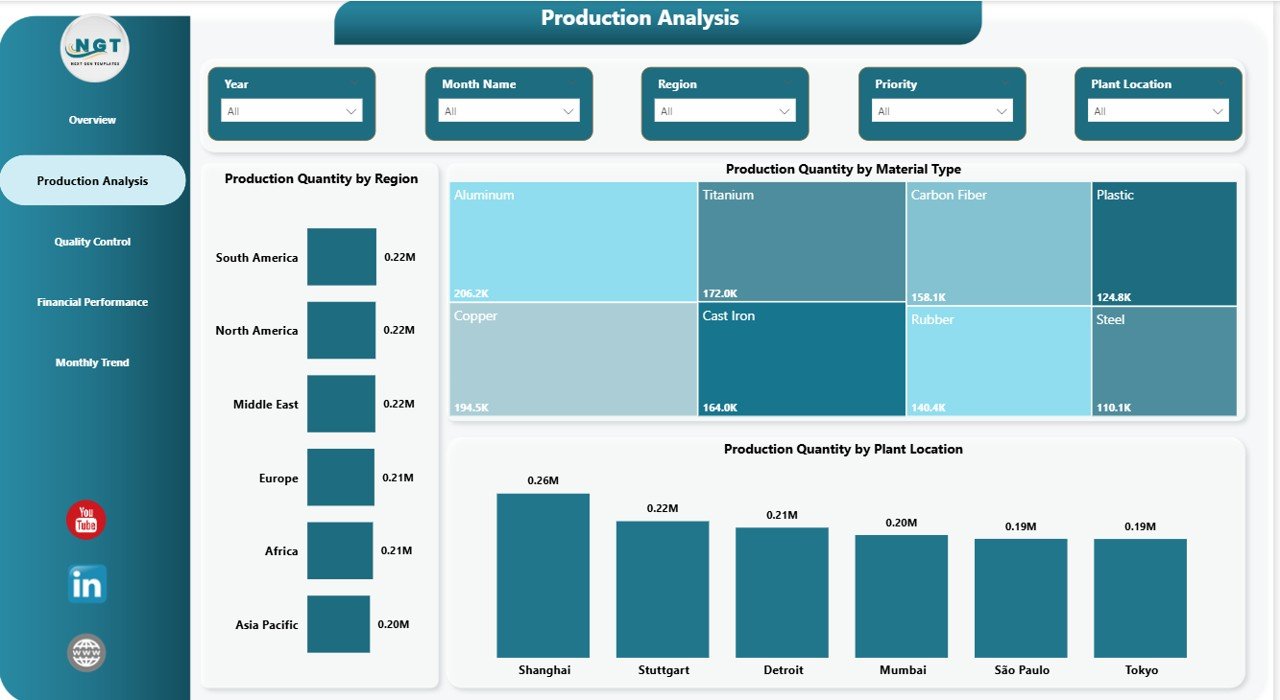
Production Analysis – How Can You Track Production Performance?
The Production Analysis Page focuses on production efficiency across different dimensions.
Charts Included:
- Production Quantity by Region
- Production Quantity by Material Type
- Production Quantity by Plant Location
Key Insights You Can Get:
- Which region produces the most parts
- Which material contributes to higher production
- Which plant performs better
As a result, managers can optimize production planning and resource allocation.
Click to buy Automotive Parts Manufacturing Dashboard in Power BI
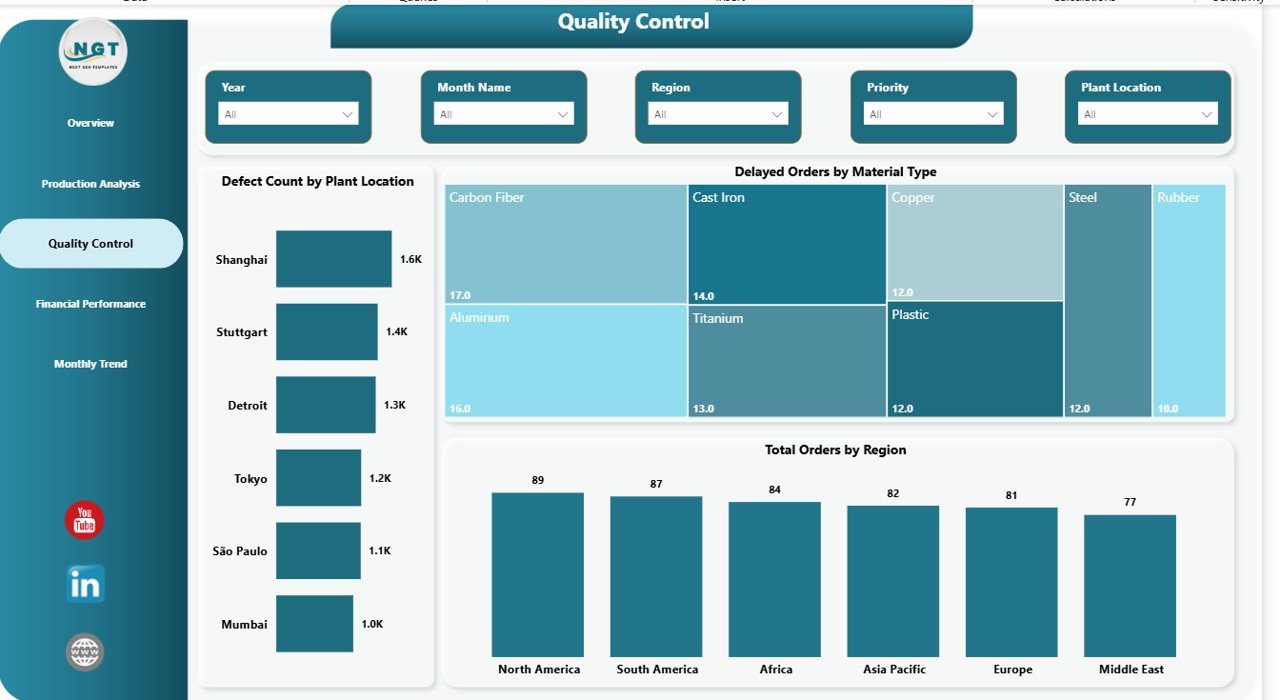
Quality Control – How Can You Improve Product Quality?
Quality plays a critical role in automotive manufacturing. Therefore, the Quality Control Page helps track defects and operational issues.
Charts Included:
- Defect Count by Plant Location
- Delayed Orders by Material Type
- Total Orders by Region
Why This Page Matters:
- It helps identify high-defect plants
- It highlights materials causing delays
- It improves order fulfillment performance
Therefore, companies can take corrective actions quickly and reduce quality issues.
Click to buy Automotive Parts Manufacturing Dashboard in Power BI
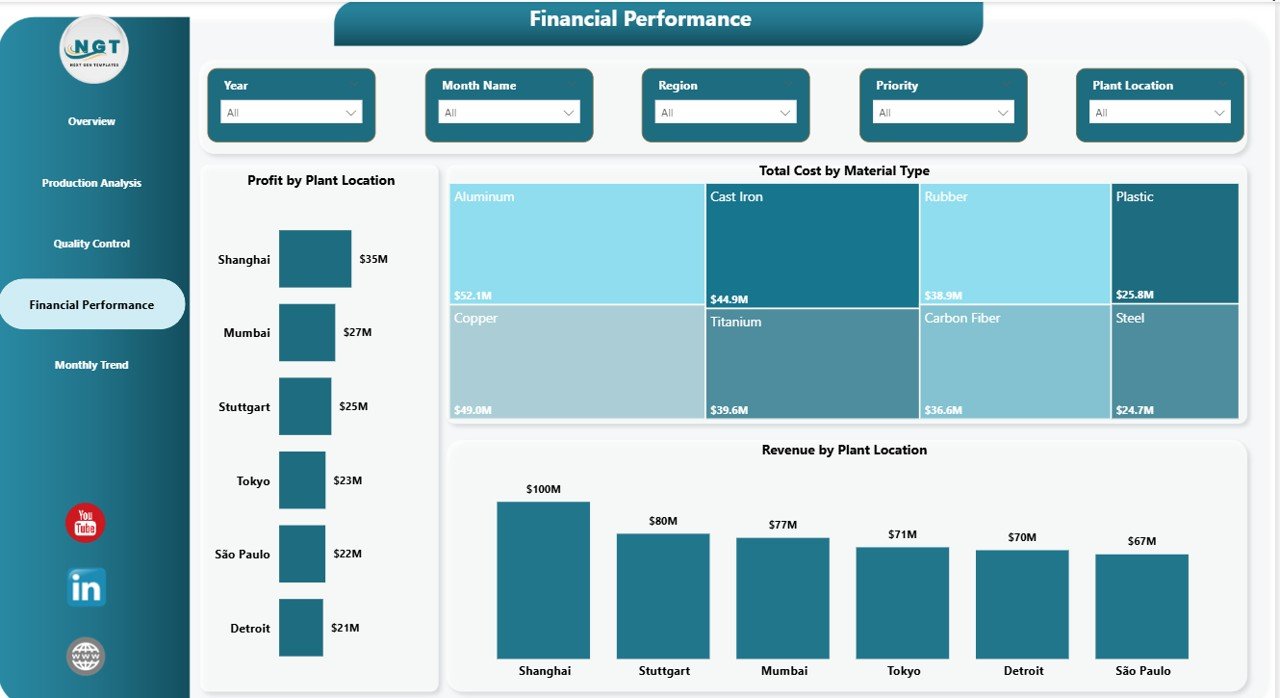
Financial Performance – How Can You Analyze Profitability?
The Financial Performance Page focuses on revenue, cost, and profit analysis.
Charts Included:
- Profit by Plant Location
- Total Cost by Material Type
- Revenue by Plant Location
Key Benefits:
- Identify high-profit plants
- Track cost-heavy materials
- Analyze revenue contribution by location
As a result, businesses can improve profitability and control costs effectively.
Click to buy Automotive Parts Manufacturing Dashboard in Power BI
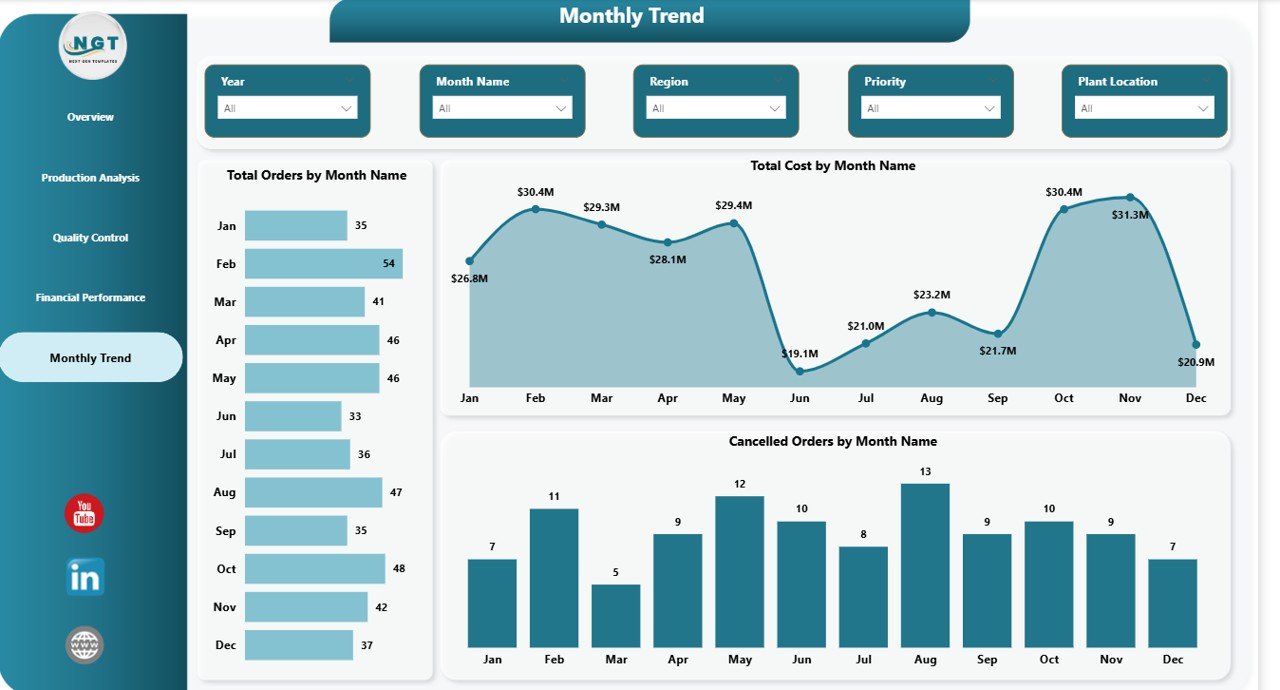
Monthly Trend – How Can You Track Performance Over Time?
The Monthly Trend Page helps users analyze trends and patterns over time.
Charts Included:
- Total Orders by Month Name
- Total Cost by Month Name
- Cancelled Orders by Month Name
Why This Page Is Valuable:
- It shows seasonal trends
- It helps identify cost spikes
- It tracks order cancellations over time
Therefore, companies can plan better and avoid future issues.
Click to buy Automotive Parts Manufacturing Dashboard in Power BI
What Are the Advantages of Automotive Parts Manufacturing Dashboard in Power BI?
Using this dashboard offers several powerful benefits.
Advantages of Automotive Parts Manufacturing Dashboard in Power BI
Centralized Data Management
- Combine all data in one place
- Avoid scattered spreadsheets
- Improve data consistency
Real-Time Insights
- Get instant updates
- Monitor live performance
- Take quick action
Better Decision-Making
- Use data-driven insights
- Reduce guesswork
- Improve strategic planning
mproved Quality Control
- Identify defect patterns
- Reduce production errors
- Improve product quality
Cost Optimization
- Track cost drivers
- Reduce unnecessary expenses
- Improve profit margins
Easy Visualization
- Understand data through charts
- Simplify complex information
- Improve reporting clarity
How Does This Dashboard Help Different Users?
Different roles in a manufacturing company benefit from this dashboard.
Production Managers
- Track production efficiency
- Identify underperforming plants
Business Owners
- Monitor profitability
- Make strategic decisions
Data Analysts
- Analyze trends
- Generate reports quickly
Quality Teams
- Track defects
- Improve quality standards
Best Practices for the Automotive Parts Manufacturing Dashboard in Power BI
To get the best results, you should follow these best practices.
Best Practices for the Automotive Parts Manufacturing Dashboard in Power BI
. Keep Data Clean and Updated
- Always use accurate data
- Update data regularly
- Remove duplicates
Use Proper Data Modeling
- Build relationships correctly
- Avoid unnecessary tables
- Optimize performance
Focus on Key KPIs
- Track only important metrics
- Avoid clutter
- Keep dashboards simple
Use Interactive Filters (Slicers)
- Allow users to filter data easily
- Improve user experience
Optimize Visual Design
- Use consistent colors
- Highlight important KPIs
- Avoid too many visuals
Regularly Review Performance
- Analyze trends weekly or monthly
- Take corrective actions
How to Use the Automotive Dashboard Effectively?
To maximize the value of this dashboard, follow these steps:
- Import your manufacturing data into Power BI
- Connect tables properly
- Use slicers to filter data
- Analyze KPIs regularly
- Take action based on insights
As a result, you will improve efficiency and decision-making.
Conclusion
The Automotive Parts Manufacturing Dashboard in Power BI is a powerful tool for modern manufacturing businesses. It helps companies track production, monitor quality, analyze financial performance, and identify trends—all in one place.
Moreover, it simplifies complex data and turns it into actionable insights. Therefore, businesses can improve efficiency, reduce costs, and increase profitability.
If you want to stay competitive in today’s manufacturing industry, you should definitely use this dashboard.
Frequently Asked Questions (FAQs)
1. What is the main purpose of this dashboard?
The main purpose is to track manufacturing performance, including production, quality, and financial metrics in one place.
2. Can beginners use this Power BI dashboard?
Yes, beginners can use it easily because it includes simple visuals and interactive filters.
3. What data is required for this dashboard?
You need production data, cost data, revenue data, defect records, and order details.
4. How often should I update the dashboard?
You should update it regularly, preferably daily or weekly, for accurate insights.
5. Can this dashboard improve profitability?
Yes, it helps identify cost issues and revenue opportunities, which improves profitability.
6. Is Power BI better than Excel for dashboards?
Yes, Power BI offers better visualization, automation, and real-time insights compared to Excel.
Visit our YouTube channel to learn step-by-step video tutorials
Click to buy Automotive Parts Manufacturing Dashboard in Power BI