The Digital Wallets KPI Dashboard in Excel tracks 15+ key performance indicators across 7 worksheets with MTD and YTD comparisons, conditional formatting arrows, and trend charts. Digital wallet providers processed over $9 trillion in global transactions in 2024, and operations teams managing these platforms need structured KPI reporting that goes beyond raw data exports. This ready-to-use Excel template delivers exactly that — monthly performance tracking with target variance analysis and year-over-year comparison in a single file.
Whether you manage a mobile money platform, an e-wallet service, or a neobank payments team, tracking metrics like transaction success rate, average transaction value, customer acquisition cost, and churn rate month-over-month is non-negotiable for growth. The Digital Wallets KPI Dashboard in Excel replaces scattered spreadsheets and expensive SaaS analytics tools with a clean, formula-driven reporting system that any Excel user can operate. Explore our full library of KPI Dashboard Templates for more industry-specific options.
Key Features of Digital Wallets KPI Dashboard in Excel
👉 Click here to Purchase Digital Wallets KPI Dashboard in Excel
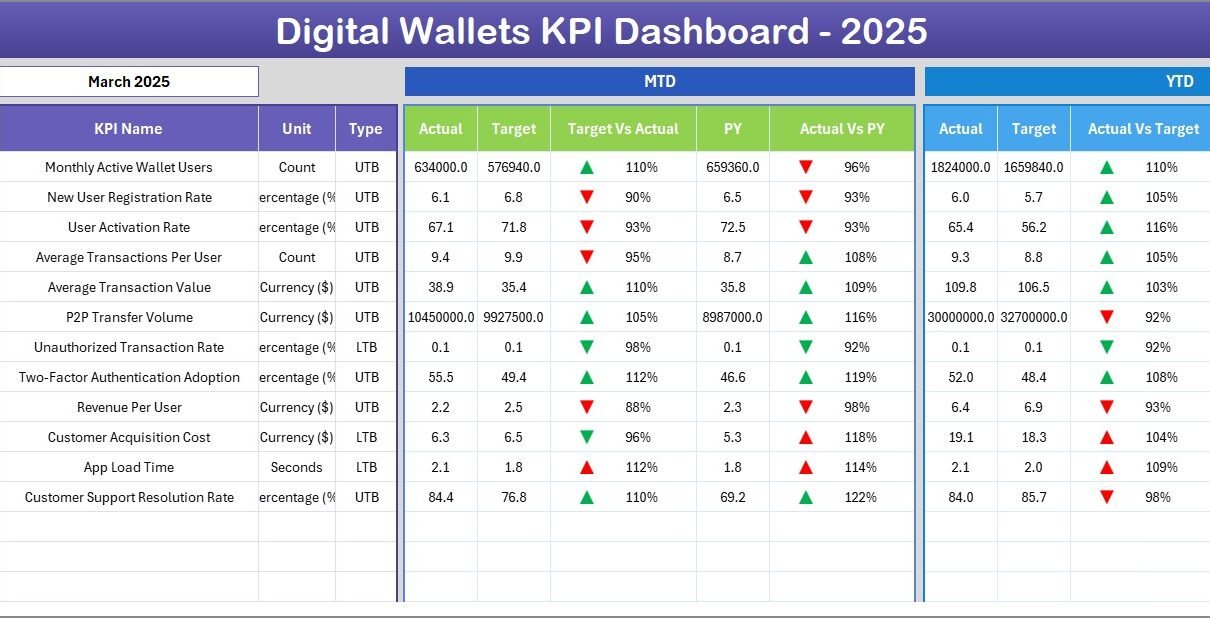
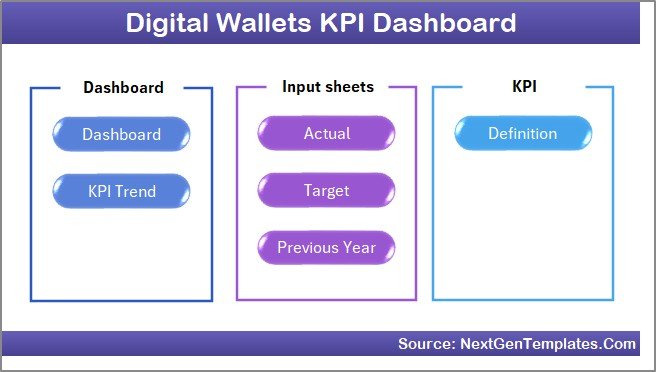
The Digital Wallets KPI Dashboard in Excel includes 7 purpose-built worksheets covering navigation, dashboard analytics, trend analysis, data input, and KPI definitions. The Dashboard sheet displays MTD Actual, Target, and Previous Year data alongside YTD equivalents for every KPI, with conditional formatting up/down arrows that instantly flag whether each metric is on track or falling behind. The KPI Trend sheet lets you select any individual KPI from a dropdown and view its 12-month trend chart comparing Actual vs Target vs Previous Year for both MTD and YTD.
Three structured input sheets — Actual Numbers, Target Numbers, and Previous Year Numbers — keep data organized and separate from the visual output. A dedicated KPI Definition sheet stores each metric’s name, group, unit, formula, definition, and type (LTB or UTB), which the KPI Trend sheet references automatically. The Home sheet includes 6 navigation buttons for one-click access to any worksheet. The entire template runs on standard Excel formulas with no macros or VBA, making it compatible with Excel 2016, 2019, 2021, Microsoft 365, and Excel for Mac.
Dashboard Pages Explanation
1. Home Sheet
This is an index sheet with 6 navigation buttons that jump to the respective worksheets. It serves as the central hub of the template, giving you instant access to the Dashboard, KPI Trend, Actual Input, Target Input, Previous Year, and KPI Definition sheets.
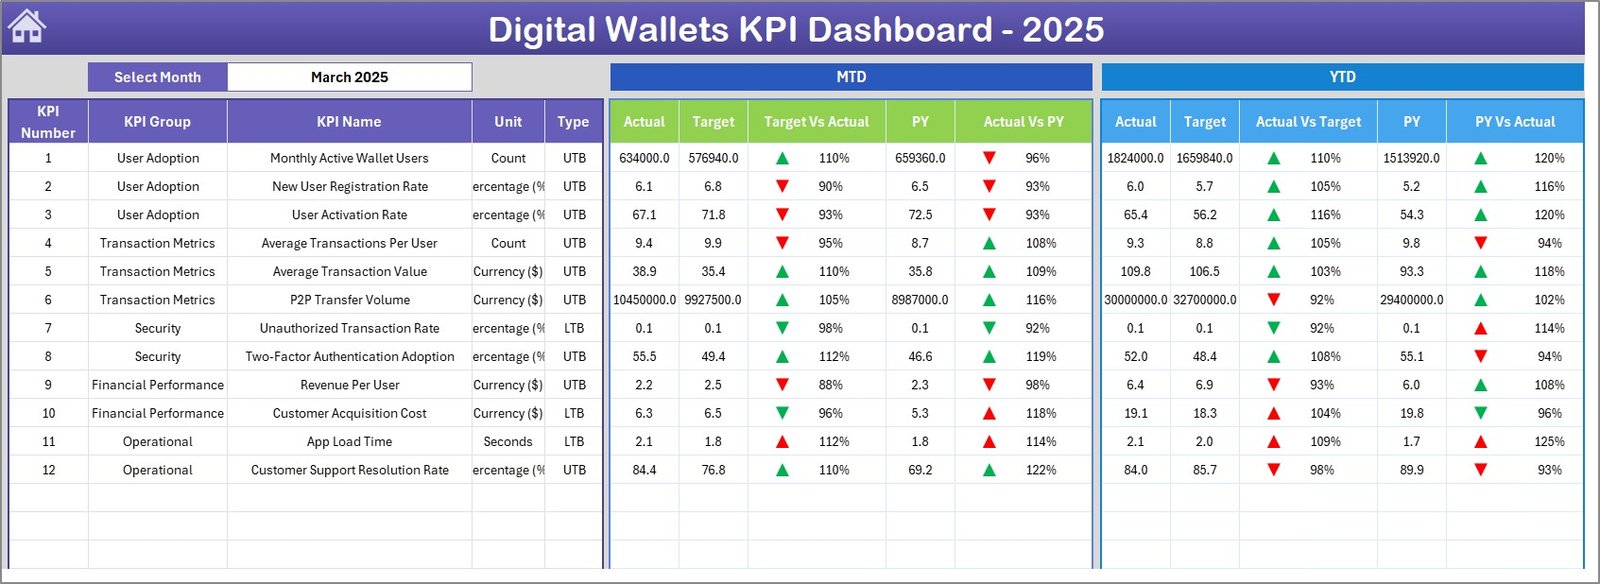
2. Dashboard Sheet
👉 Click here to Purchase Digital Wallets KPI Dashboard in Excel
This is the main analytics sheet. On cell D3, a month dropdown controls the entire page. For the selected month, you see MTD Actual, Target, Previous Year data along with Target vs Actual and PY vs Actual columns — each with conditional formatting up/down arrows. Below, YTD Actual, Target, Previous Year data appears with the same variance indicators. This single view tells you exactly which KPIs are on track and which need attention.
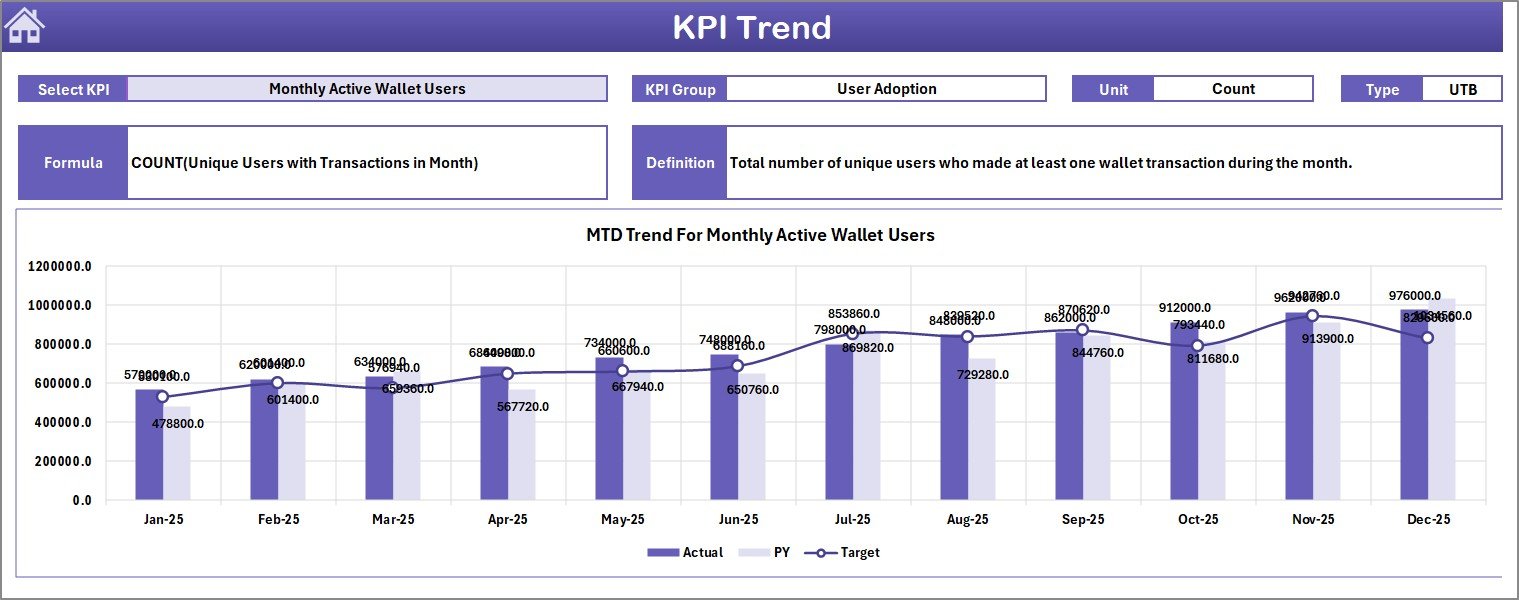
3. KPI Trend Sheet
Select any KPI from the dropdown on cell C3. The sheet displays the KPI Group, Unit, Type (Lower the Better or Upper the Better), Formula, and Definition. Below, MTD and YTD trend charts plot Actual, Target, and Previous Year lines across 12 months — making it easy to spot seasonal patterns, sustained improvements, or emerging gaps. For additional trend analysis capabilities, check out the Fintech KPI Dashboard in Power BI with drill-through functionality.
👉 Click here to Purchase Digital Wallets KPI Dashboard in Excel
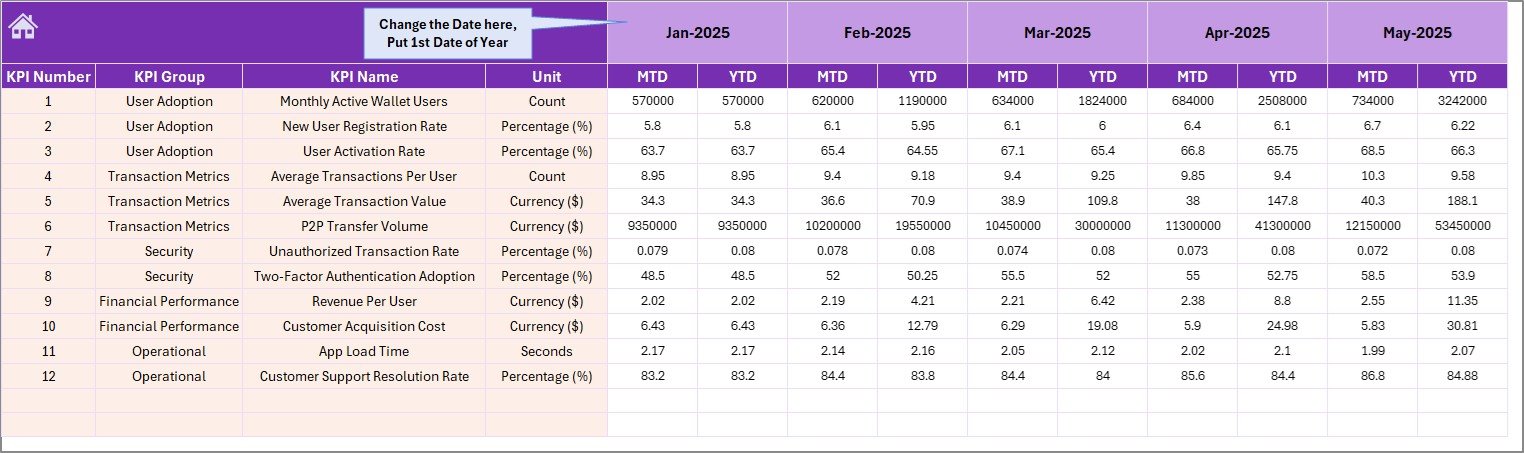
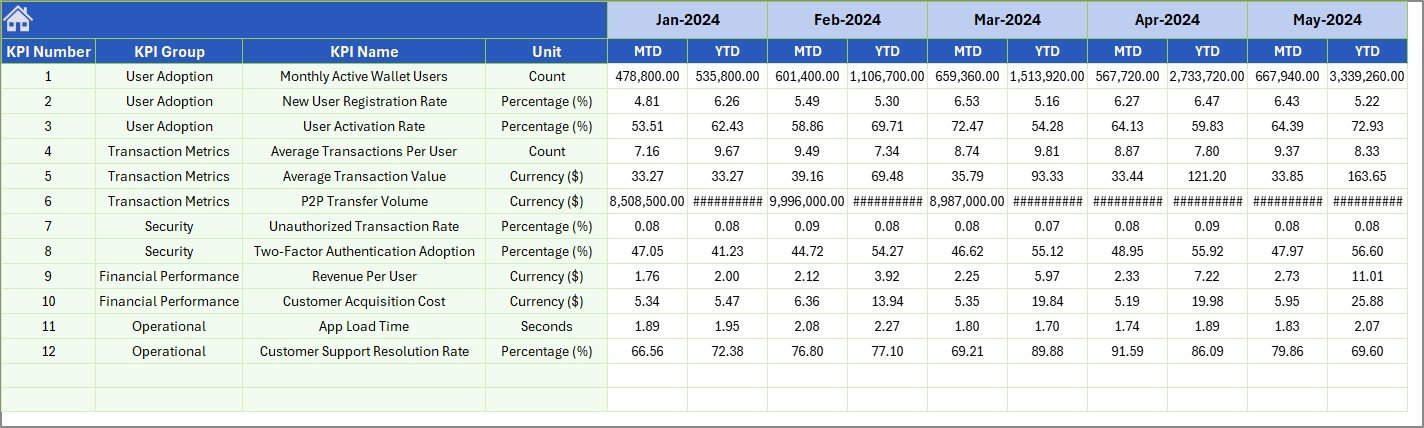
4. Actual Numbers Input Sheet
Enter actual MTD and YTD numbers for each KPI per month. Cell E1 lets you set the first month of your fiscal year, and all month headers adjust accordingly. Simply fill in your numbers and the Dashboard sheet reflects changes immediately.
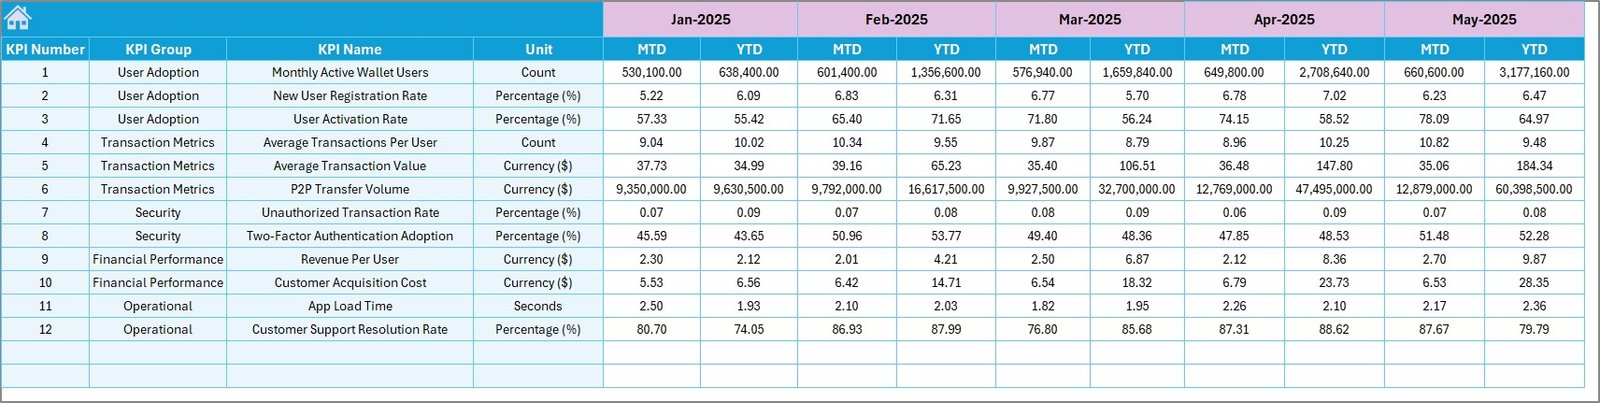
5. Target Number Input Sheet
👉 Click here to Purchase Digital Wallets KPI Dashboard in Excel
Enter target values for each KPI as MTD and YTD for every month. These targets feed directly into the Dashboard sheet’s variance calculations and the KPI Trend sheet’s target trend lines.
6. Previous Year Number Sheet
Enter previous year data in the same format as the current year. This enables year-over-year comparison on both the Dashboard and KPI Trend sheets, helping you track growth trajectory and identify seasonal patterns from the prior year.
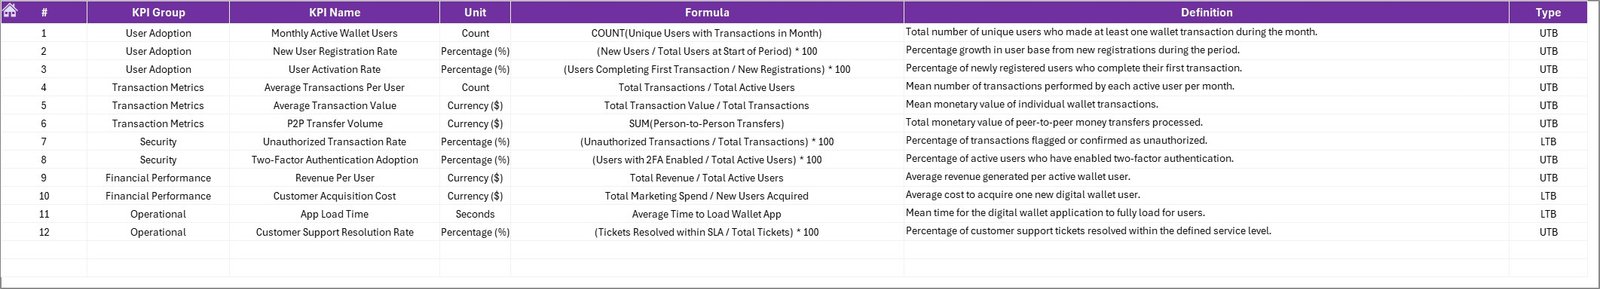
7. KPI Definition Sheet
👉 Click here to Purchase Digital Wallets KPI Dashboard in Excel
Enter each KPI’s Name, Group, Unit, Formula, Definition, and Type (LTB or UTB). The KPI Trend sheet pulls this metadata automatically, so you always see the definition and formula alongside the trend chart for any selected metric. For more on structuring KPI definitions, Microsoft’s documentation on KPI best practices provides useful guidance.
Digital Wallets KPI Dashboard in Excel vs. Google Sheets vs. Paid SaaS — Feature Comparison
| Feature | Digital Wallets KPI Dashboard in Excel | Google Sheets Equivalent | Stripe Dashboard / Plaid |
|---|---|---|---|
| Cost | $14.99 one-time | Free (DIY build) | $25–$300/month |
| Platform | Microsoft Excel | Google Sheets | Web-based SaaS |
| Setup Time | Under 10 minutes | Hours (manual build) | Days (API integration) |
| Real-time Collaboration | Via OneDrive/SharePoint | Built-in | Built-in |
| Customizable KPIs | Unlimited | Manual setup | Limited to plan |
| Offline Access | Full offline | Limited | No |
| Year-1 Cost (5 users) | $14.99 total | $0 (hours of work) | $1,500–$18,000 |
| MTD/YTD Trend Charts | Built-in | Manual | Varies by plan |
For fintech teams that want structured KPI tracking without paying $300/month for premium analytics or spending days on API integrations, the Digital Wallets KPI Dashboard in Excel sits in the sweet spot.
Who Should Use This Template
👉 Click here to Purchase Digital Wallets KPI Dashboard in Excel
Perfect for:
- Fintech operations managers tracking wallet transaction volume, success rates, and revenue per user
- Digital payment startups needing structured KPI reporting for investor meetings and board decks
- Finance teams at mobile money companies comparing monthly targets against actuals and prior year
- Analysts at e-wallet providers monitoring customer acquisition cost, churn, and average transaction value
Not a fit if:
- You need real-time API-connected dashboards pulling live transaction data from Stripe, PayPal, or banking APIs
- Your organization requires SOC 2 compliant analytics with enterprise-level access controls and audit trails
Real-World Use Cases
Ravi manages operations at a 50-person mobile wallet startup in Southeast Asia. He uses the Digital Wallets KPI Dashboard in Excel to track 18 KPIs including daily active users, transaction success rate, average wallet load, and customer acquisition cost. Before board meetings, he selects the relevant month and exports the dashboard as a PDF — replacing a 3-hour manual reporting process with a 10-minute refresh.
Priya leads finance at a digital lending fintech in India. She enters monthly targets for disbursement volume, NPA percentage, and collection efficiency. The conditional formatting arrows instantly show her which KPIs missed target — helping her prepare variance reports for the CFO without building pivot tables from scratch.
Carlos runs analytics at a Latin American neobank. He tracks wallet-to-wallet transfer volume, merchant payment adoption, and fraud detection rate using the KPI Trend sheet. Comparing Actual vs Target vs Previous Year across 12 months helps his team spot seasonal dips and plan marketing campaigns accordingly.
Advantages of Digital Wallets KPI Dashboard in Excel
👉 Click here to Purchase Digital Wallets KPI Dashboard in Excel
- 10-minute setup — No formulas to write, no pivot tables to build. Enter your KPI definitions and data, and the dashboard is ready.
- $14.99 one-time vs $300+/month — Eliminates recurring SaaS costs for teams that update metrics monthly rather than in real-time.
- Full offline access — Works without internet, unlike cloud-only analytics platforms. Share via email or OneDrive.
- YoY comparison built-in — Previous Year input sheet enables year-over-year analysis that most basic dashboards lack.
- LTB/UTB awareness — The KPI Definition sheet distinguishes between “Lower the Better” and “Upper the Better” metrics, which the trend analysis uses for directional context.
Opportunities for Improvement
- No automated data connection — you need to enter actual numbers manually each month (not a limitation for teams with monthly reporting cycles, but a gap for real-time needs).
- No multi-user concurrent editing in desktop Excel — use OneDrive/SharePoint for shared access.
- Conditional formatting arrows are visual only — they don’t trigger email alerts or Slack notifications when a KPI misses target.
- The template doesn’t include pre-built Power BI export — for that, see the Fintech KPI Dashboard in Power BI.
Best Practices
- Define all KPIs on the Definition sheet before entering data — this ensures the KPI Trend sheet displays complete metadata.
- Set the fiscal year start month on cell E1 of the Actual Input sheet so all month headers align with your reporting calendar.
- Update Actual numbers within the first week of each month to keep the Dashboard current for leadership reviews.
- Use the KPI Trend sheet during monthly reviews to discuss not just the current month but the 12-month trajectory.
- Back up the file monthly — save versioned copies (e.g., Digital-Wallet-KPIs-Jan2026.xlsx) for audit trails.
- Lock input sheets with Excel’s Protect Sheet feature to prevent accidental formula overwrites on the Dashboard and Trend sheets.
Explore Relevant Templates
🔹 Fintech KPI Dashboard in Power BI — Advanced Power BI analytics with slicers, combo charts, and drill-through KPI definitions.
🔹 Blockchain & Cryptocurrency Dashboard in Excel — Track wallet balances, transaction types, and profit/loss across blockchain networks.
🔹 Crypto Portfolio Dashboard in HTML — Browser-based crypto analytics with 5 pages and CSV export.
🔹 Browse All KPI Dashboard Templates
Frequently Asked Questions
👉 Click here to Purchase Digital Wallets KPI Dashboard in Excel
What KPIs does the Digital Wallets KPI Dashboard in Excel track?
The Digital Wallets KPI Dashboard in Excel tracks any KPI you define — transaction volume, success rate, average transaction value, customer acquisition cost, churn rate, wallet load amount, revenue per user, and more. Enter your KPIs on the Definition sheet and the entire dashboard adapts.
How long does setup take?
Under 10 minutes. Define your KPIs, enter actual and target numbers for the current month, and the Dashboard auto-populates with MTD/YTD comparisons and trend charts.
Does this work on Excel for Mac?
Yes. The template uses standard formulas only — no macros, no VBA. It works on Excel for Mac, Excel 2016, 2019, 2021, and Microsoft 365.
Can I customize this for industries beyond digital wallets?
Yes. The KPI Definition sheet is fully flexible. Rename KPIs for banking, insurance, lending, payments, or any industry that tracks monthly performance against targets.
How does this compare to Stripe Dashboard or Plaid analytics?
Stripe and Plaid analytics cost $25–$300/month and require API integration. This Excel template costs $14.99 one-time with no subscription. For teams with monthly reporting cycles, it delivers structured KPI tracking at a fraction of SaaS pricing.
Can I add more KPIs later?
Yes. Add rows on the KPI Definition sheet and matching rows on the three input sheets. The Dashboard and KPI Trend sheets reference these dynamically without formula changes.
Is there a Power BI version?
Yes. The Fintech KPI Dashboard in Power BI offers advanced filtering, drill-through pages, and DAX-powered calculations for teams needing more interactive analytics.
About the Author
Built by PK — Microsoft Certified Professional with 15+ years of Excel, Google Sheets, and Power BI experience. Founder of NextGenTemplates, reaching 300K+ subscribers across YouTube channels. Every template is hand-built and tested before release.
Conclusion
The Digital Wallets KPI Dashboard in Excel gives fintech teams, digital payment startups, and e-wallet providers a structured, affordable way to track monthly performance against targets and prior year benchmarks. With 7 worksheets, MTD/YTD conditional formatting, and 12-month trend charts, it replaces hours of manual reporting with a 10-minute data refresh.
👉 Click here to Purchase Digital Wallets KPI Dashboard in Excel
✅ Instant download · One-time payment · No subscription
🎥 Visit our YouTube channel: Youtube.com/@PK-AnExcelExpert