Artificial Intelligence continues to transform how organizations operate. Companies now use AI models for decision-making, automation, forecasting, fraud detection, customer service, and many other business functions. However, as organizations deploy more AI systems, they also face new challenges such as AI risk management, regulatory compliance, model transparency, and governance monitoring.
Therefore, organizations must manage AI models carefully. They must track model ownership, monitor compliance status, analyze risk levels, and evaluate operational costs. Without proper governance, AI systems may create operational risks, compliance violations, or financial losses.
However, many organizations still manage AI governance through scattered spreadsheets and manual reports. As a result, leaders struggle to track model performance, risk exposure, and compliance levels.
Click to Purchases AI Governance Dashboard in Excel
This is exactly where the AI Governance Dashboard in Excel becomes extremely valuable.
The AI Governance Dashboard in Excel provides a structured and interactive platform to monitor AI models, governance metrics, compliance status, risk levels, and cost analysis. Moreover, the dashboard transforms raw data into meaningful insights that help organizations manage AI systems responsibly.
In this detailed guide, we will explore everything about the AI Governance Dashboard in Excel, including its features, dashboard structure, advantages, best practices, and frequently asked questions.
What is an AI Governance Dashboard in Excel?
An AI Governance Dashboard in Excel is a data visualization and monitoring tool that helps organizations track and manage artificial intelligence models across departments, regions, and business functions.
Instead of reviewing multiple spreadsheets, organizations can view AI governance insights in a centralized dashboard.
The dashboard collects data such as:
-
AI model ownership
-
AI model status
-
Compliance status
-
Risk level indicators
-
Incident tracking
-
Model cost monitoring
-
Governance performance score
As a result, managers can quickly identify potential risks, compliance gaps, and operational inefficiencies.
Moreover, the dashboard enables data-driven governance decisions. Leaders can monitor how AI models perform and ensure they align with ethical, legal, and organizational standards.
Because Excel supports interactive charts, structured tables, and automated calculations, the dashboard provides an accessible and flexible governance monitoring solution.
Why Do Organizations Need an AI Governance Dashboard?
Organizations deploy AI models across many departments. For example, companies may use AI for marketing automation, fraud detection, predictive analytics, and customer behavior analysis.
However, AI systems introduce new governance challenges.
For example:
-
AI models may handle sensitive data
-
AI algorithms may create bias risks
-
AI models may require regulatory compliance checks
-
AI deployment may increase operational cost
Therefore, organizations need a structured monitoring framework.
An AI Governance Dashboard in Excel helps organizations:
-
Monitor AI models across departments
-
Track governance and compliance metrics
-
Identify high-risk models
-
Analyze AI incidents
-
Evaluate model cost and operational efficiency
-
Improve transparency in AI operations
As a result, businesses can maintain responsible and trustworthy AI usage.
Key Features of the AI Governance Dashboard in Excel
The AI Governance Dashboard in Excel includes several analytical pages that provide detailed insights into AI governance performance.
The dashboard contains five analytical pages along with data management sheets.
Page Navigator
The dashboard includes a Page Navigator located on the left side.
This feature allows users to quickly switch between analytical pages. As a result, users can explore different governance insights without navigating multiple files.
Overview Page: Central AI Governance Monitoring
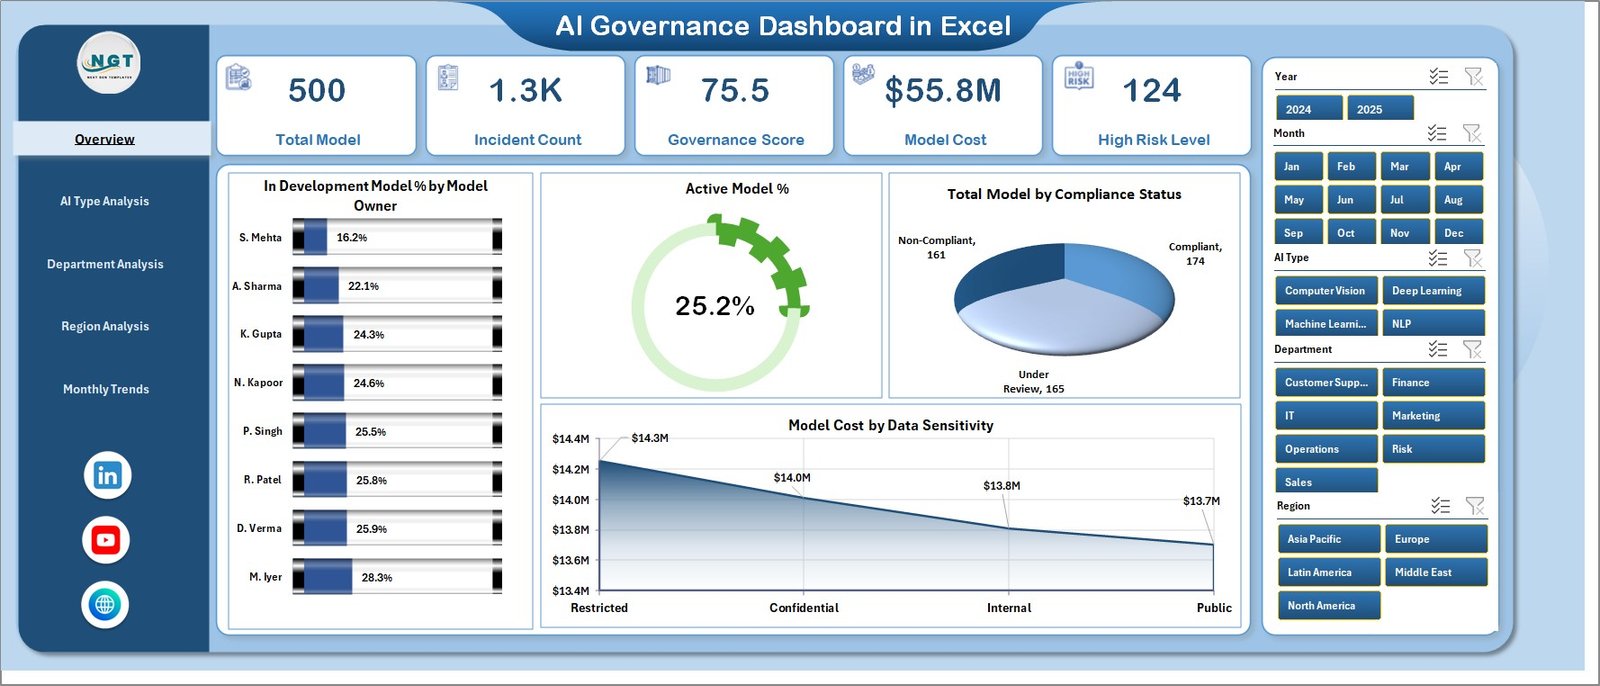
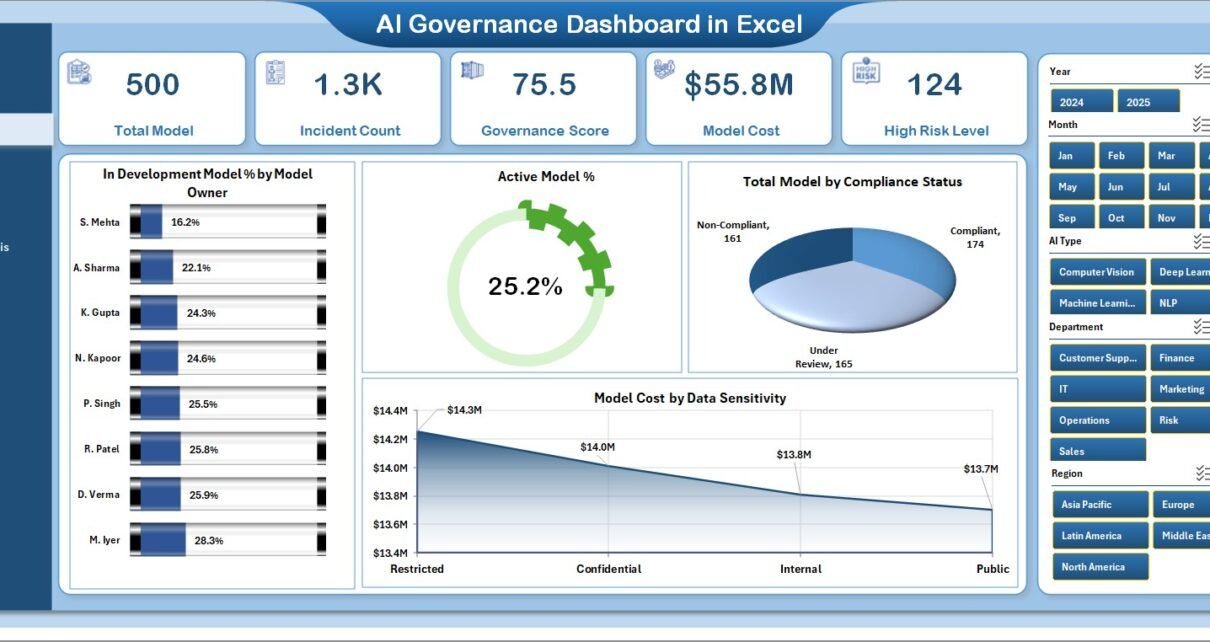
The Overview Page acts as the primary dashboard where users can view the most important governance metrics.
Users can apply filters using the right-side slicer panel to analyze specific segments.
The page includes four KPI cards and four analytical charts.
KPI Cards
Click to Purchases AI Governance Dashboard in Excel
The dashboard displays quick governance indicators through KPI cards.
These cards allow decision-makers to monitor the AI governance environment instantly.
Charts Available on the Overview Page
1. In Development Model % by Model Owner
This chart shows the percentage of AI models currently under development grouped by model owners.
As a result, organizations can identify teams working on new AI initiatives.
2. Active Model
This visualization highlights the number of AI models currently active in the system.
Therefore, leaders can track the operational footprint of AI systems.
3. Total Model by Compliance Status
This chart categorizes AI models based on compliance status.
For example:
-
Compliant
-
Under Review
-
Non-Compliant
Consequently, governance teams can quickly identify compliance gaps.
4. Model Cost by Data Sensitivity
This chart analyzes AI model cost based on the sensitivity of the data used.
Because sensitive data requires stricter governance, organizations can prioritize risk management for high-cost sensitive models.
AI Type Analysis Page
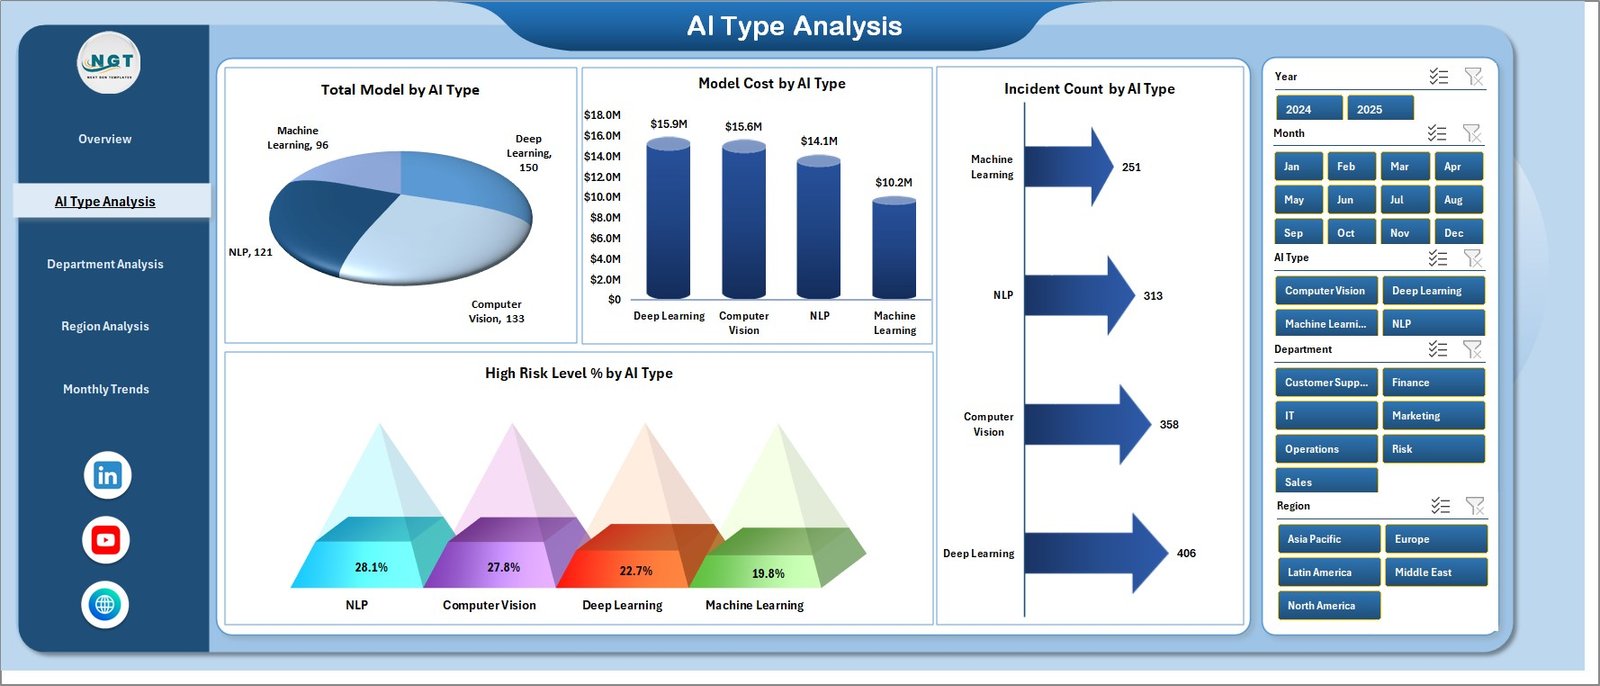
The AI Type Analysis page provides insights into how different AI technologies perform across the organization.
Users can filter results using the right-side slicer.
Charts Included in AI Type Analysis
1. Total Model by AI Type
This chart displays the number of AI models deployed by AI type.
For example:
-
Machine Learning
-
Deep Learning
-
Natural Language Processing
-
Computer Vision
Therefore, leaders can evaluate which AI technologies dominate the organization.
2. Model Cost by AI Type
This visualization tracks the operational cost associated with each AI category.
As a result, organizations can manage AI spending more effectively.
3. Incident Count by AI Type
This chart shows the number of governance incidents reported for each AI category.
Therefore, governance teams can identify technologies that require stronger monitoring.
4. High-Risk Level % by AI Type
This metric highlights the percentage of AI models classified as high-risk.
As a result, organizations can prioritize risk mitigation strategies.
Click to Purchases AI Governance Dashboard in Excel
Department Analysis Page
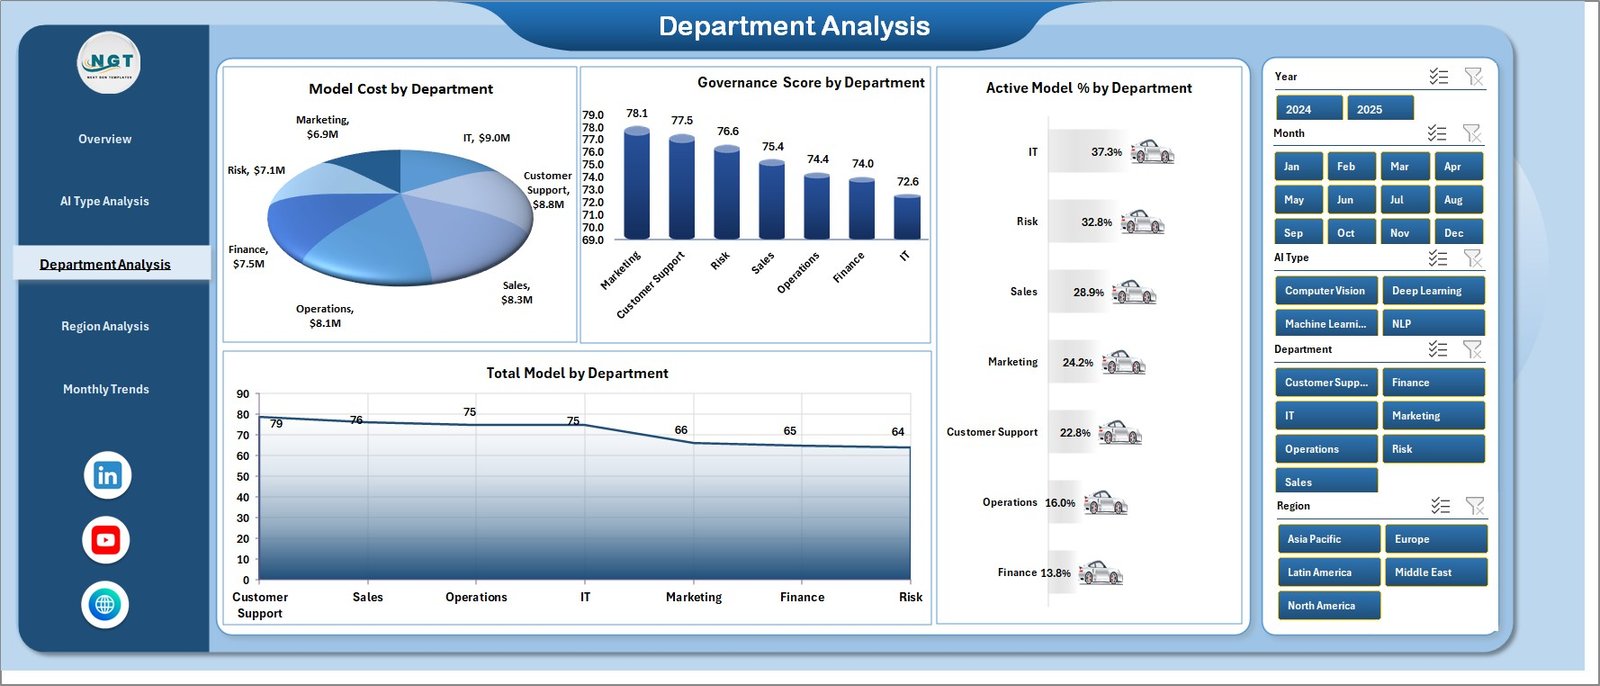
Organizations often deploy AI across multiple departments.
Therefore, governance teams must track AI usage across business functions.
The Department Analysis Page provides insights into departmental AI activities.
Charts Included in Department Analysis
1. Total Model by Department
This chart displays how many AI models each department manages.
Consequently, leadership can identify departments with high AI adoption.
2. Governance Score by Department
This visualization evaluates governance performance across departments.
A higher governance score indicates stronger compliance and risk management.
3. Active Model % by Department
This chart shows the percentage of active AI models across departments.
Therefore, managers can analyze operational AI usage.
4. Total Model by Department
This chart provides an additional breakdown of model distribution.
Region Analysis Page
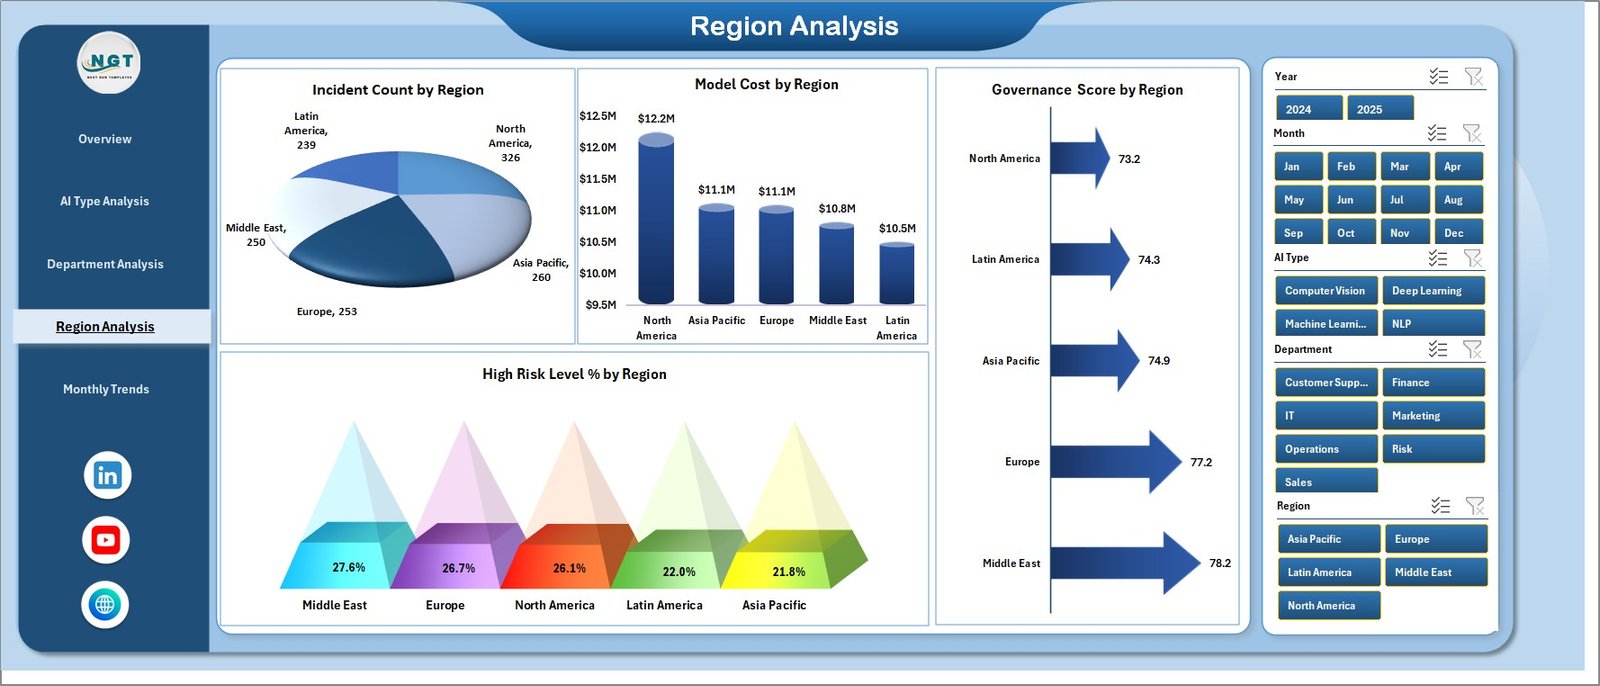
Many organizations operate globally. Therefore, they deploy AI systems across multiple regions.
The Region Analysis Page helps organizations evaluate AI governance performance geographically.
Charts Included in Region Analysis
1. Incident Count by Region
This chart displays the number of governance incidents recorded across regions.
Therefore, governance teams can identify locations with higher operational risks.
2. Model Cost by Region
This visualization highlights regional AI operational costs.
As a result, organizations can control regional spending.
3. Governance Score by Region
This chart evaluates governance maturity across different regions.
Therefore, organizations can benchmark governance practices.
4. High-Risk Level % by Region
This metric shows the percentage of high-risk models across regions.
Consequently, leadership can prioritize governance improvements.
Month Analysis Page
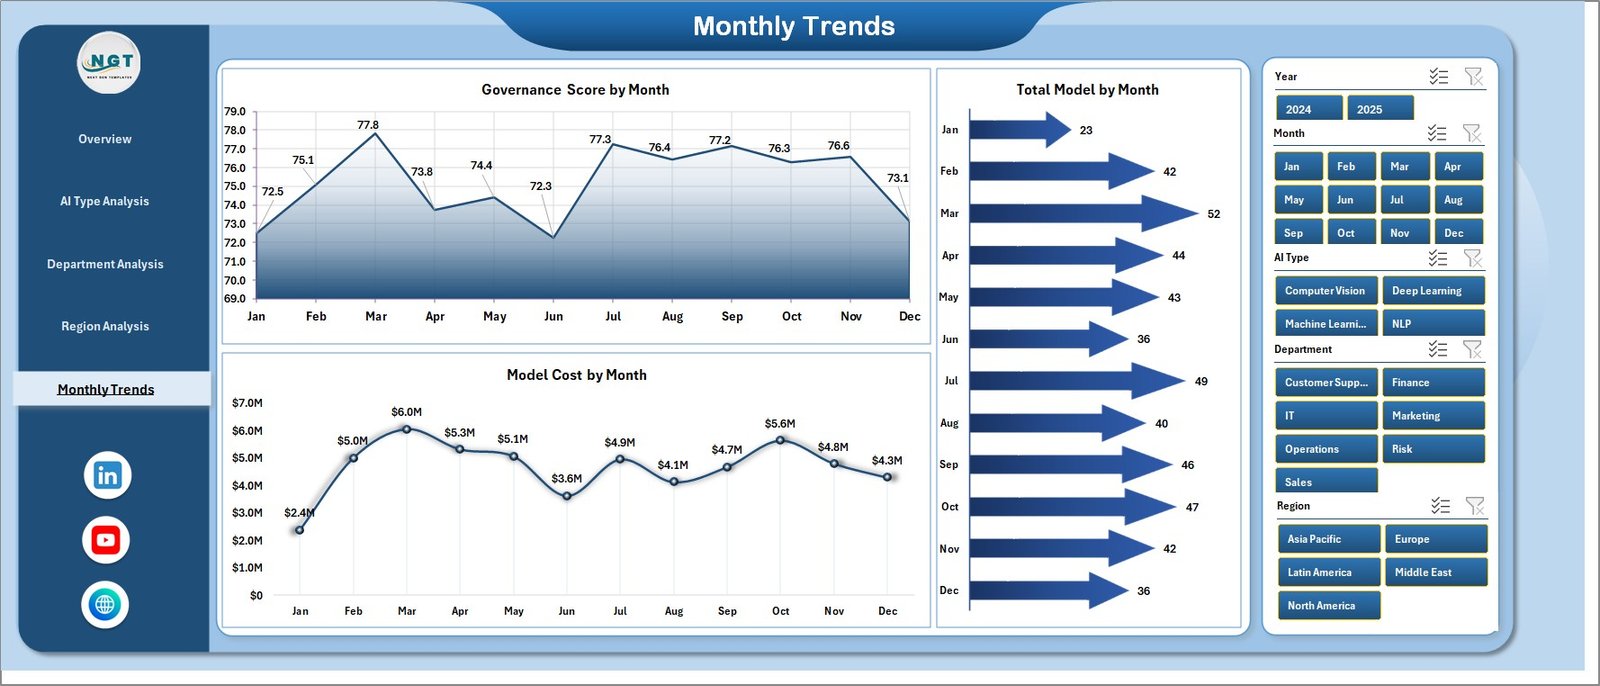
The Month Analysis Page provides time-based insights into AI governance performance.
This page allows organizations to analyze trends and monitor governance improvements over time.
Charts Included in Month Analysis
-
Governance Score by Month
-
Total Model by Month
-
Model Cost by Month
Because these charts display trends over time, organizations can track governance progress and evaluate strategic improvements.
Advantages of AI Governance Dashboard in Excel
Organizations gain several benefits when they implement the AI Governance Dashboard in Excel.
1. Centralized AI Monitoring
The dashboard consolidates governance data into one platform. As a result, organizations eliminate scattered reporting systems.
2. Improved Risk Management
The dashboard highlights high-risk models and incident trends. Therefore, governance teams can respond quickly.
3. Better Compliance Tracking
The dashboard allows organizations to monitor AI compliance status effectively.
4. Enhanced Decision Making
Leaders can analyze governance metrics visually. Consequently, they can make faster and better decisions.
5. Cost Visibility
The dashboard helps organizations understand AI operational costs.
6. Department-Level Governance Insights
The dashboard reveals how departments manage AI models.
7. Regional Governance Monitoring
Organizations can evaluate governance practices across geographic regions.
Click to Purchases AI Governance Dashboard in Excel
Best Practices for AI Governance Dashboard in Excel
Organizations should follow several best practices to maximize the value of an AI Governance Dashboard in Excel.
1. Maintain Accurate Data
Organizations should update governance data regularly to maintain accurate insights.
2. Monitor High-Risk AI Models
Governance teams should review high-risk models frequently.
3. Track Compliance Status Continuously
Organizations should ensure all AI systems meet regulatory standards.
4. Analyze Incident Trends
Governance teams should analyze incident patterns and prevent future issues.
5. Monitor Model Costs
Organizations should track AI operational costs to ensure cost efficiency.
6. Assign Clear Model Ownership
Each AI model should have a responsible owner.
7. Perform Regular Governance Reviews
Organizations should conduct regular governance audits.
Who Can Benefit from AI Governance Dashboard in Excel?
Many organizations and professionals can benefit from this dashboard.
AI Governance Teams
They can monitor risk, compliance, and governance performance.
Data Science Teams
They can track AI model lifecycle and performance.
Compliance Officers
They can evaluate regulatory compliance.
Technology Leaders
They can monitor AI adoption across the organization.
Risk Management Teams
They can identify and mitigate AI risks.
Executive Leadership
They can evaluate AI governance performance.
Conclusion
Artificial Intelligence plays a critical role in modern organizations. However, companies must govern AI responsibly to maintain compliance, transparency, and operational efficiency.
The AI Governance Dashboard in Excel provides a structured and easy-to-use solution for monitoring AI systems, evaluating governance performance, and identifying potential risks.
Because the dashboard includes multiple analytical pages, interactive charts, and governance indicators, organizations can analyze AI operations across departments, regions, and time periods.
Moreover, leaders can make informed decisions that improve governance maturity and reduce AI risks.
Therefore, organizations that adopt a structured AI governance dashboard gain better transparency, stronger compliance, and improved operational control over their AI systems.
Frequently Asked Questions (FAQs)
What is AI governance?
AI governance refers to the framework organizations use to manage AI systems responsibly. It includes policies, monitoring processes, compliance standards, and risk management strategies.
Why do organizations need AI governance?
Organizations need AI governance to ensure ethical AI usage, regulatory compliance, and risk management.
Why use Excel for an AI governance dashboard?
Excel provides flexible data management, interactive charts, and automated calculations. Therefore, organizations can easily create governance dashboards.
What metrics should an AI governance dashboard track?
Important metrics include:
-
AI model count
-
Model ownership
-
Compliance status
-
Risk level indicators
-
Incident tracking
-
Governance score
-
Model cost
Can small organizations use an AI governance dashboard?
Yes. Small organizations can also benefit from governance dashboards because they improve transparency and risk monitoring.
How often should organizations update AI governance dashboards?
Organizations should update governance dashboards regularly, ideally weekly or monthly, to maintain accurate insights.
Visit our YouTube channel to learn step-by-step video tutorials