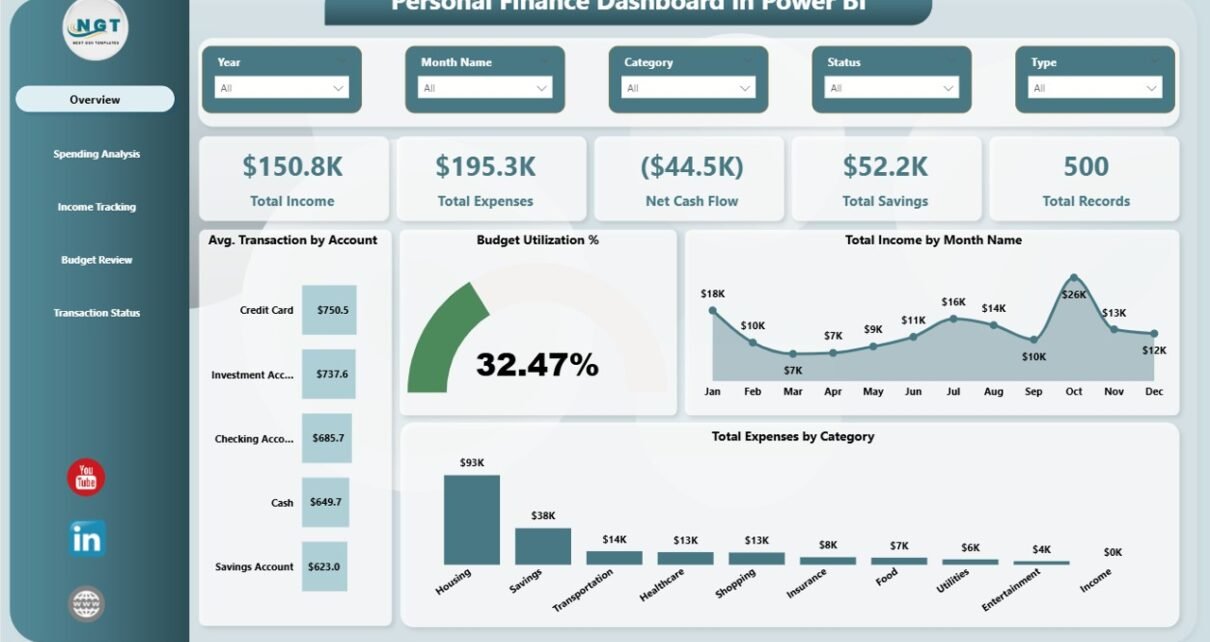
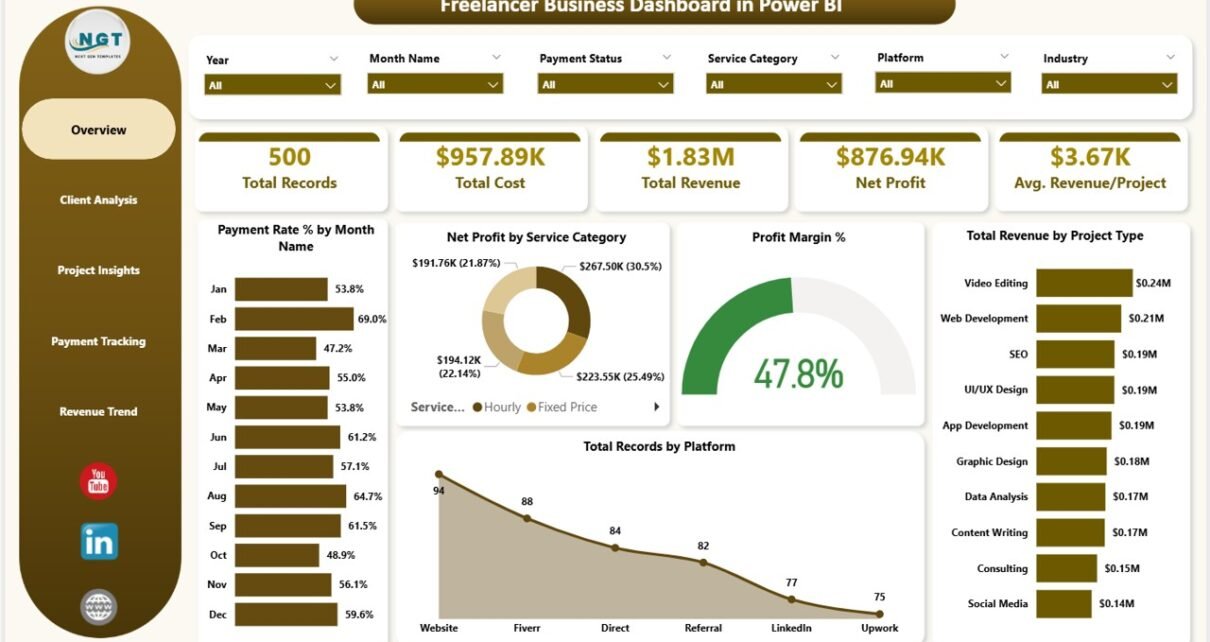
• Excel and VBA
    • VBA Course
    • Shortcut Keys
    • Useful Formulas
    • Basic Charts
    • Advanced Chart
    • Sort and Filter
    • Pivot Table
    • Data Validation
    • Conditional Formatting
    • Auto Fill and Flash Fill
    • Find and Replace
  • DownloadsPopular
    • Excel VBA Tools
    • Dashboard
      • Excel Dashboard
      • KPI Dashboard
      • Power BI Dashboard
    • Charts
      • Progress Charts
      • Info-graphics
      • Animated Charts
      • Comparisons
      • Gantt Charts
      • Heatmaps
      • Speedometers
      • Timelines
    • Inventory Management
    • HR and Payrolls
    • VBA Automation
    • Utilities and Converters
    • Checklist
    • Calendars
    • Data Analysis
    • Excel Templates
    • Financial Tools
    • Project Management
    • Sales and Marketing
    • Productivity
  • Excel Dashboard
  • Templates
  • Tutorials
    • Charts and Visualization
    • VBA
    • Excel Tips and Tricks
  • Power BI
  • Template StoreNew
  • CoursesNew
  • About Us
  • Contact Us

PK: An Excel Expert

Transforming Data into Decisions

Power BI

This category provides comprehensive tutorials on creating dynamic and insightful visualizations with Power BI. Whether you need to analyze complex data sets or create interactive dashboards, our tutorials will guide you through the process. Each tutorial comes with a free practice file for download and tutorial videos to help you follow along easily. Start your Power BI tutorial now and learn how to create engaging and informative reports. Impress your colleagues and boss with your data visualization and analysis skills by exploring this category today.

Dashboard Power BI

Museums & Cultural Centres KPI Dashboard in Power BI

December 12, 2025December 12, 2025 PKComments Off on Museums & Cultural Centres KPI Dashboard in Power BI
Museums and cultural centres play an important role in preserving history, promoting creativity, and enriching communities. Because of this heavy responsibility, cultural institutions must track many performance metrics to understand
Read More
Dashboard Power BI

Optical Retail Dashboard in Power BI

December 11, 2025December 11, 2025 PKComments Off on Optical Retail Dashboard in Power BI
The optical retail industry grows rapidly as customers demand high-quality eyewear, advanced lenses, competitive pricing, and excellent service. Because of this, retailers must track many KPIs—sales, cost, profit, customer satisfaction,
Read More
Dashboard Power BI

Public Health Programs Dashboard in Excel

December 11, 2025December 11, 2025 PKComments Off on Public Health Programs Dashboard in Excel
Public health programs improve community well-being, reduce disease risks, and strengthen healthcare outcomes. However, teams often struggle to track activities, budgets, beneficiaries, and performance indicators in one place. Reports stay
Read More
Power BI

Metro & Subway KPI Dashboard in Power BI

December 11, 2025December 11, 2025 PKComments Off on Metro & Subway KPI Dashboard in Power BI
Modern metro and subway operations run with high speed, tight schedules, and strict safety rules. Every trip, every train, and every station generates useful data. When teams track this data
Read More
Dashboard Power BI

Packaging Industry Dashboard in Power BI

December 11, 2025December 11, 2025 PKComments Off on Packaging Industry Dashboard in Power BI
The packaging industry runs on speed, accuracy, and real-time decision-making. Every day, teams monitor production volumes, energy usage, material performance, defect levels, and delivery timelines. When managers track these KPIs
Read More
Dashboard Power BI

Glass Manufacturing Dashboard in Power BI

December 11, 2025December 11, 2025 PKComments Off on Glass Manufacturing Dashboard in Power BI
Running a glass manufacturing unit demands constant monitoring, quick decisions, and complete clarity over daily operations. Production teams deal with many challenges every single day—energy usage, furnace temperature, cooling time,
Read More
Dashboard Power BI

Science and Technology Parks KPI Dashboard in Power BI

December 11, 2025December 11, 2025 PKComments Off on Science and Technology Parks KPI Dashboard in Power BI
Science and Technology Parks (STPs) help countries grow their innovation capabilities. They support startups, research institutes, technology companies, and incubation centers. These parks act as engines of economic development because
Read More
Dashboard Power BI

Loan Portfolio KPI Dashboard in Power BI

December 11, 2025December 11, 2025 PKComments Off on Loan Portfolio KPI Dashboard in Power BI
Managing a loan portfolio becomes harder every year. Competition rises, credit risk changes fast, customers expect quick decisions, and leadership demands accurate performance insights. Because of these challenges, financial institutions
Read More
Dashboard Power BI

Research & Development Institutes KPI Dashboard in Power BI

December 11, 2025December 11, 2025 PKComments Off on Research & Development Institutes KPI Dashboard in Power BI
Research and Development (R&D) institutes run innovation, discovery, science, and technology growth. These institutes handle complex projects, long development cycles, advanced experiments, and multi-disciplinary teams. Because of this, leaders need
Read More
Dashboard Power BI

Sportswear Chains Dashboard in Power BI

December 10, 2025December 10, 2025 PKComments Off on Sportswear Chains Dashboard in Power BI
Managing a sportswear retail chain involves constant movement—inventory shifts, seasonal demand, changing customer behavior, and competitive pricing. Although many sportswear chains collect large volumes of data, they often struggle to
Read More

Posts pagination

Previous 1 2 3 4 … 56 Next
  • Excel and VBA
    • VBA Course
    • Shortcut Keys
    • Useful Formulas
    • Basic Charts
    • Advanced Chart
    • Sort and Filter
    • Pivot Table
    • Data Validation
    • Conditional Formatting
    • Auto Fill and Flash Fill
    • Find and Replace
  • DownloadsPopular
    • Excel VBA Tools
    • Dashboard
      • Excel Dashboard
      • KPI Dashboard
      • Power BI Dashboard
    • Charts
      • Progress Charts
      • Info-graphics
      • Animated Charts
      • Comparisons
      • Gantt Charts
      • Heatmaps
      • Speedometers
      • Timelines
    • Inventory Management
    • HR and Payrolls
    • VBA Automation
    • Utilities and Converters
    • Checklist
    • Calendars
    • Data Analysis
    • Excel Templates
    • Financial Tools
    • Project Management
    • Sales and Marketing
    • Productivity
  • Excel Dashboard
  • Templates
  • Tutorials
    • Charts and Visualization
    • VBA
    • Excel Tips and Tricks
  • Power BI
  • Template StoreNew
  • CoursesNew
  • About Us
  • Contact Us
Copyright © 2023 PK-AnExcelExpert.com - Privacy Policy
This website uses cookies to improve your user experience, analyze site traffic and serve targeted ads in accordance with our Privacy Policy ACCEPT
Privacy & Cookies Policy

Privacy Overview

This website uses cookies to improve your experience while you navigate through the website. Out of these cookies, the cookies that are categorized as necessary are stored on your browser as they are essential for the working of basic functionalities of the website. We also use third-party cookies that help us analyze and understand how you use this website. These cookies will be stored in your browser only with your consent. You also have the option to opt-out of these cookies. But opting out of some of these cookies may have an effect on your browsing experience.
Necessary
Always Enabled
Necessary cookies are absolutely essential for the website to function properly. This category only includes cookies that ensures basic functionalities and security features of the website. These cookies do not store any personal information.
Non-necessary
Any cookies that may not be particularly necessary for the website to function and is used specifically to collect user personal data via analytics, ads, other embedded contents are termed as non-necessary cookies. It is mandatory to procure user consent prior to running these cookies on your website.
SAVE & ACCEPT