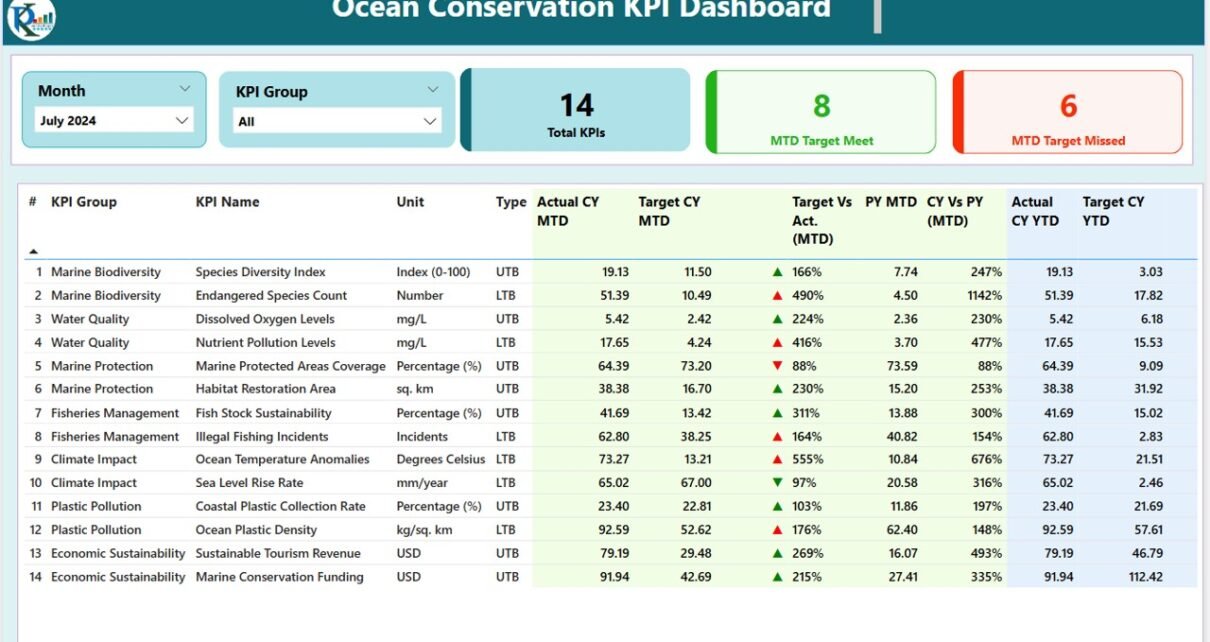
Ocean Conservation KPI Dashboard in Power BI
The ocean plays a crucial role in sustaining life on Earth, yet it faces numerous threats such as pollution, overfishing, and climate change. As we strive to protect and preserve
Transforming Data into Decisions
This category provides comprehensive tutorials on creating dynamic and insightful visualizations with Power BI. Whether you need to analyze complex data sets or create interactive dashboards, our tutorials will guide you through the process. Each tutorial comes with a free practice file for download and tutorial videos to help you follow along easily. Start your Power BI tutorial now and learn how to create engaging and informative reports. Impress your colleagues and boss with your data visualization and analysis skills by exploring this category today.