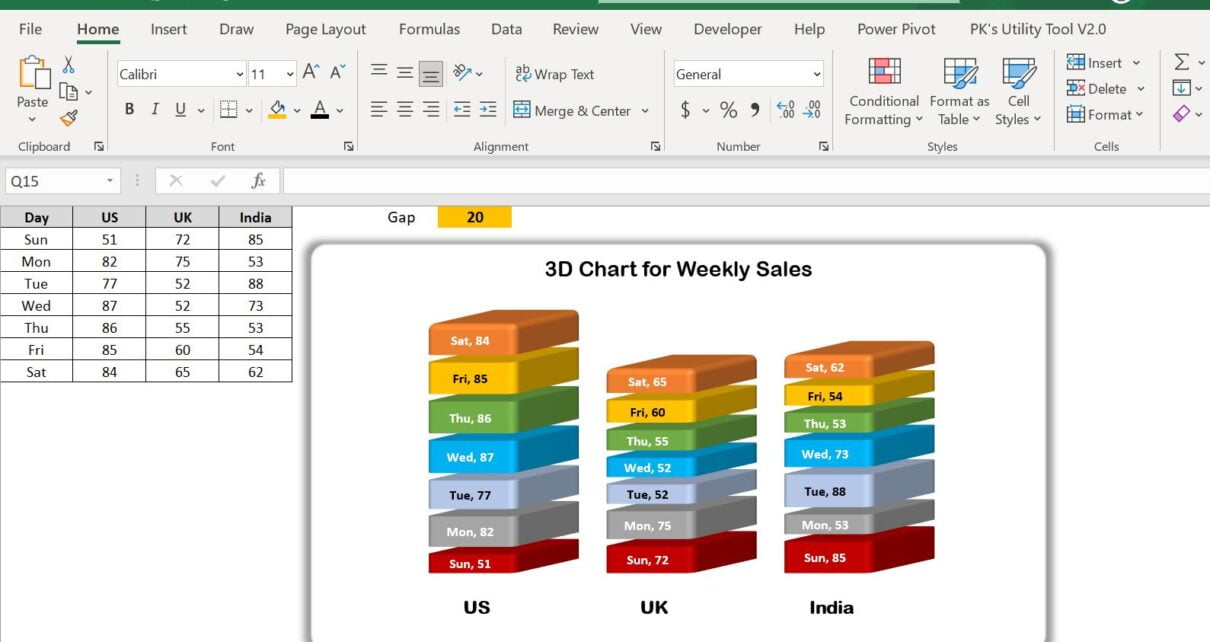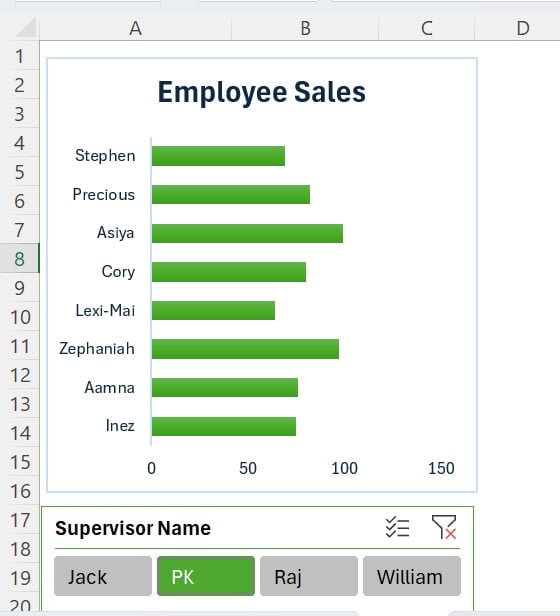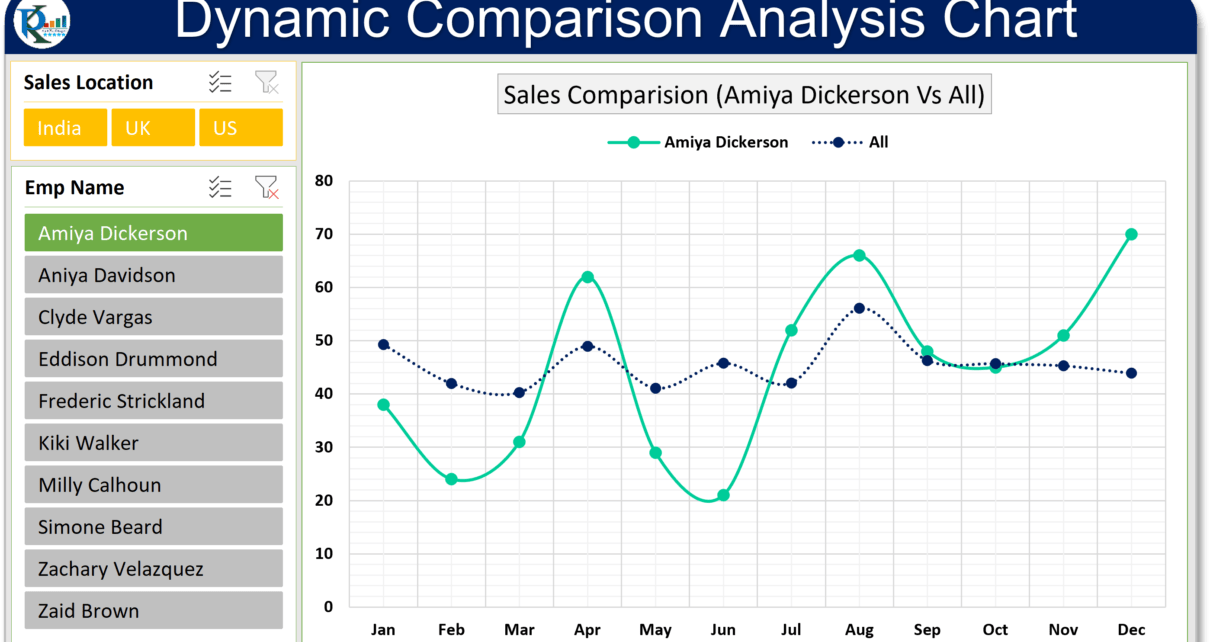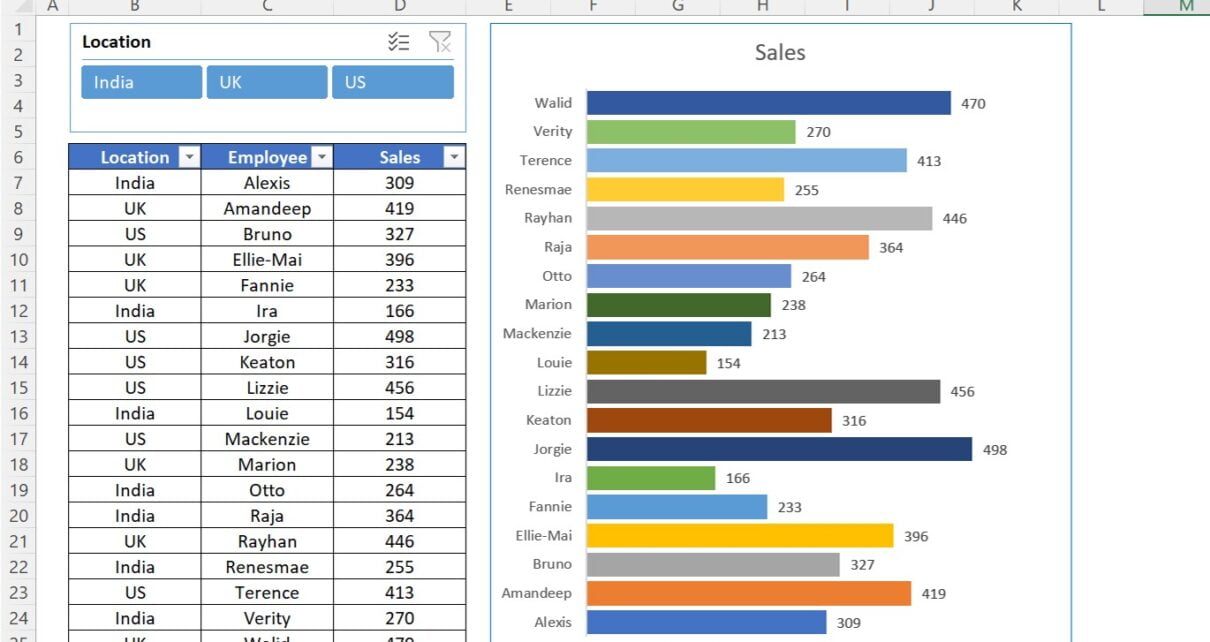
Quick Dynamic Sales by Employees chart with Slicer in Excel
Introduction: Create insightful and interactive sales visualizations with the Dynamic Sales by Employees chart with Slicer, featuring Excel's powerful slicer functionality. This tool allows you to filter sales data by