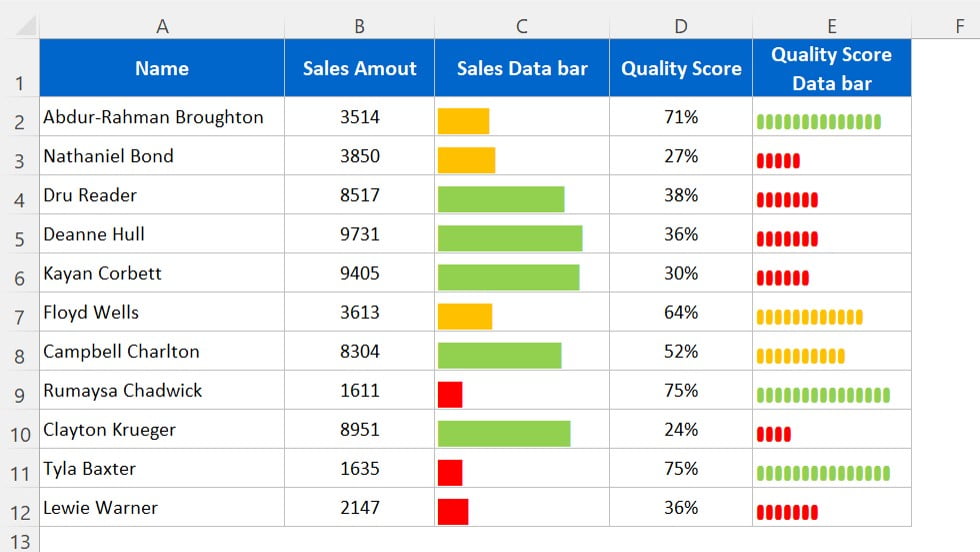
Multi-color Data bar with REPT function
The Multi-color Data Bar with REPT Function in Excel adds a vibrant, dynamic touch to your data visualization. By leveraging the REPT function and conditional formatting, you can create color-coded
Transforming Data into Decisions