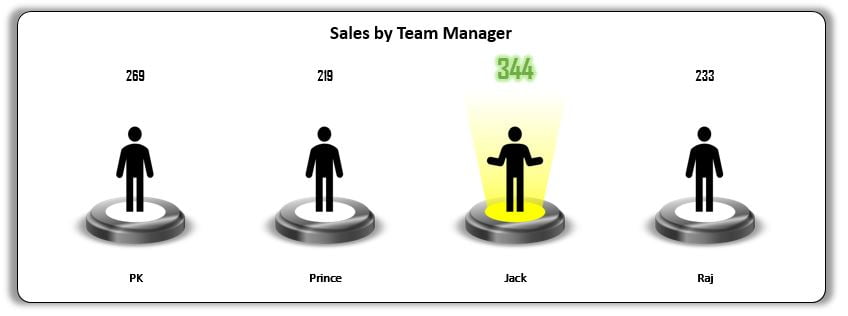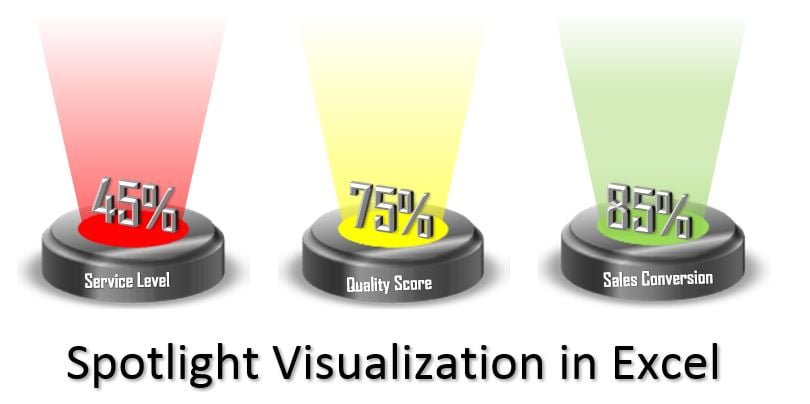
Spotlight Visualization in Excel (Part-1)
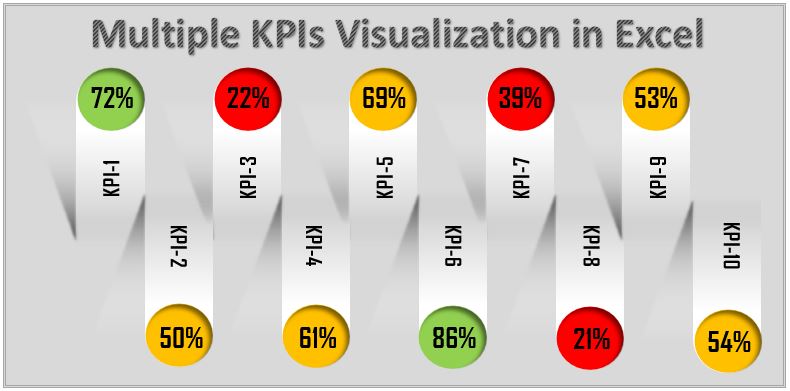
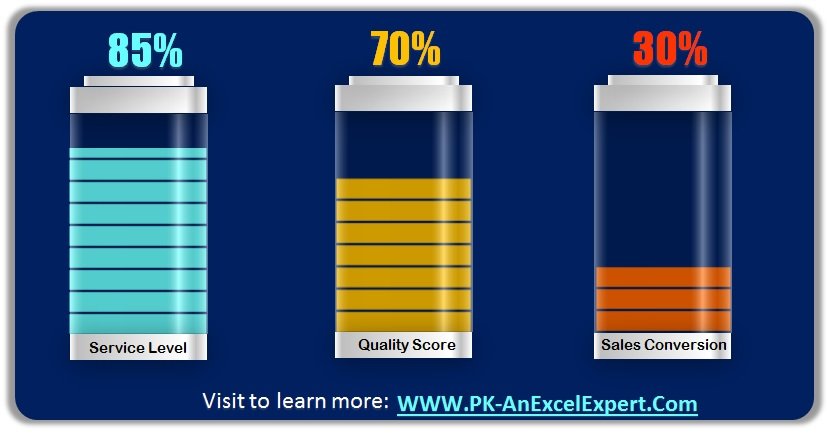
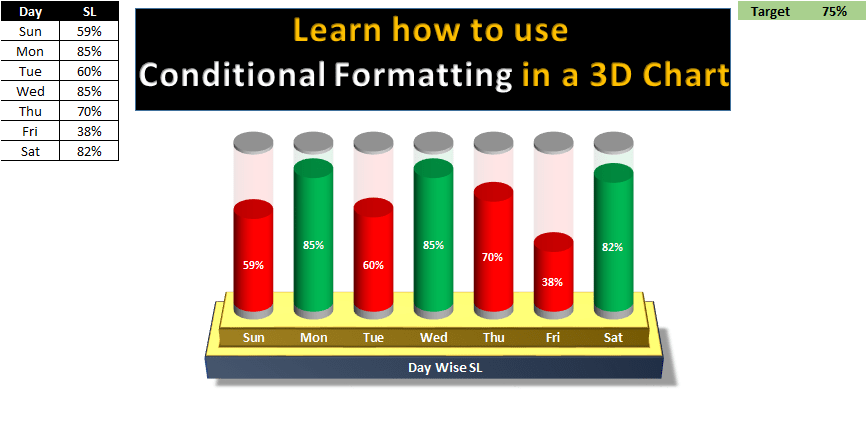
Drive into the world of data visualization with our Spotlight Visualization in Excel (Part-1), where we introduce the engaging use of RAG (Red, Amber, and Green) color coding to represent
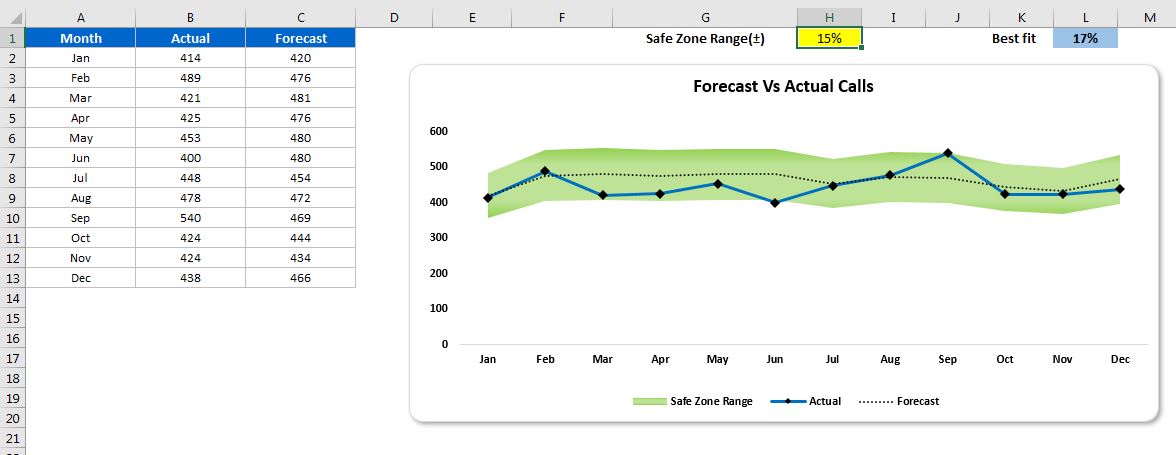
Transforming Data into Decisions